HST Observations of Galactic Globular Cluster Cores. II. NGC 6273 and the Problem of Horizontal-Branch Gaps.11affiliation: Based on observations with the NASA/ESA Hubble Space Telescope, obtained at the Space Telescope Science Institute, which is operated by AURA, Inc., under NASA contract NAS5-26555.
Abstract
We present observations of the center of the Galactic globular cluster NGC 6273, obtained with the HST/WFPC2 camera as part of the snapshot program GO-7470. A , color–magnitude diagram (CMD) for 28,000 stars is presented and discussed. The most prominent feature of the CMD, identified for the first time in this paper, is the extended horizontal branch blue tail (EBT) with a clear double-peaked distribution and a significant gap. The EBT of NGC 6273 is compared with the EBTs of seven other globular clusters for which we have a CMD in the same photometric system. From this comparison we conclude that all the globular clusters in our sample with an EBT show at least one gap along the HB, which could have similar origins. A comparison with theoretical models suggests that at least some of these gaps may be occuring at a particular value of the stellar mass, common to a number of different clusters. From the CMD of NGC 6273 we obtain a distance modulus . We also estimate an average reddening E()=0.470.03, though the CMD is strongly affected by differential reddening, with the relative reddening spanning a magnitude in the WFPC2 field. A luminosity function for the evolved stars in NGC 6273 is also presented and compared with the most recent evolutionary models.
1 Introduction
A growing number of Galactic globular clusters (GGC) is found to show extended-horizontal-branch blue tails (EBT), which sometimes reach the He-burning main sequence, indicating that some of the stars must have lost (almost) all of their envelope during the red giant branch (RGB) phase. The EBTs represent a puzzle in the stellar evolution models. In many GGCs there is another peculiarity: a discontinuity in the stellar distribution along the EBT, which sometimes results in a sort of gap, i.e., a region clearly underpopulated in stars (Sosin et al. 1997a, Catelan et al. 1998). No clear explanation for the origin of the gaps is available at present. These abnormalities in the HB probably represent one of the most extreme of the mixed bag of anomalies that are sometimes lumped under the term “second-parameter problem” (cf. Ferraro et al. 1998).
In this paper, we present a new cluster with both an EBT and a significant gap on it: NGC 6273. This object is one of the 46 clusters we are hoping to observe within our ongoing HST snapshot programs. NGC 6273 (M19) () is a medium-concentration (, Djorgovski 1993), intermediate-metallicity ([Fe/H] , Zinn & West 1984) cluster, located toward the direction of the Galactic bulge (, ). NGC 6273 is the second most luminous cluster, after Cen, in the Djorgovski (1993) compilation. In a photographic image NGC 6273 looks very similar to Cen. The other noteworthy property of NGC 6273 is its high ellipticity, , which makes M19 the most flattened of the GGC in the White & Shawl (1987) catalogue, and probably in the entire Galaxy. The only available color–magnitude diagram (CMD) is by Harris, Racine, & De Roux (1976), and it barely reaches the HB level. The CMD looks quite dispersed due to field contamination and differential reddening, estimated by the same authors to be around 0.2 magnitude in . Here we present a new CMD, extending to 2 magnitudes below the turnoff (TO), and corrected for differential reddening..
2 Observations and Analysis
The center of the GGC NGC 6273 was observed with the HST WFPC2 camera through the filters F439W and F555W ( HST A series of short and long exposures was secured in order to cover a large magnitude range (see Table 1 for a detailed log of the observations). The longer F439W exposures were repeated in order to allow removal of cosmic rays. In both cases, the cluster center was placed in the PC field.
| Object | Filter | Exp. time | Date |
|---|---|---|---|
| NGC 6273 | F555W | 10s | May 5, 1998 |
| ” | F555W | 40s | ” |
| ” | F439W | 40s | ” |
| ” | F439W | 160s | ” |
| ” | F439W | 160s | ” |
The images were pre-processed by the standard HST pipeline. Following the procedures described by Silbermann et al. (1996), we masked out the vignetted pixels and bad pixels and columns using a vignetting mask created by P. B. Stetson, together with the appropriate data-quality file for each frame. We have also multiplied each frame by a pixel area map (also provided by P. B. Stetson) in order to correct for the geometric distortion (Silbermann et al. 1996). The saturated pixels of the brightest stars in the longest exposures were corrected as in Cool, Piotto, & King (1996), using the shorter exposures.
The photometric reduction was carried out following the same procedure that is described in detail in Piotto et al. (1999a) for a similar set of images acquired within the same HST program. The raw instrumental magnitudes were transformed into the standard Johnson system using Eq. (8) in Holtzman et al. (1995) and the coefficents in their Table 7.
As this paper makes extensive use of star counts, particular attention was devoted to estimating the completeness in all the principal branches of the CMD. The completeness corrections were determined by artificial-star experiments, again as described in Piotto et al. (1999a).
3 Color–Magnitude Diagrams
The CMD for 28,000 stars in NGC 6273 is shown in Fig. 1. The diagram extends from almost the tip of the giant branch (stars brighter than are saturated even in the shortest-exposure frames) to 2 magnitudes below the TO. All the relevant branches of the CMD are well defined. As in all the CMDs of the GGC cores, a well defined sequence of blue stragglers is clearly seen, extending from the TO up to the HB. The most prominent features in Fig. 1 are the extended blue HB and the striking gap centered at . Neither of these features was reached by the previously published CMD.
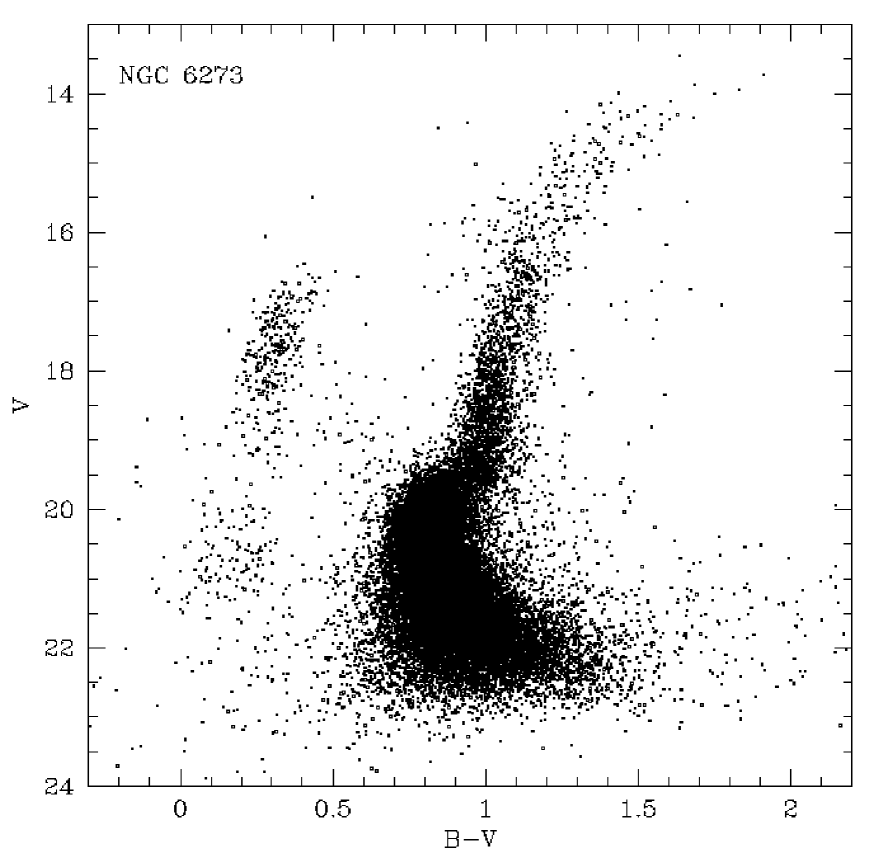
3.1 Reddening
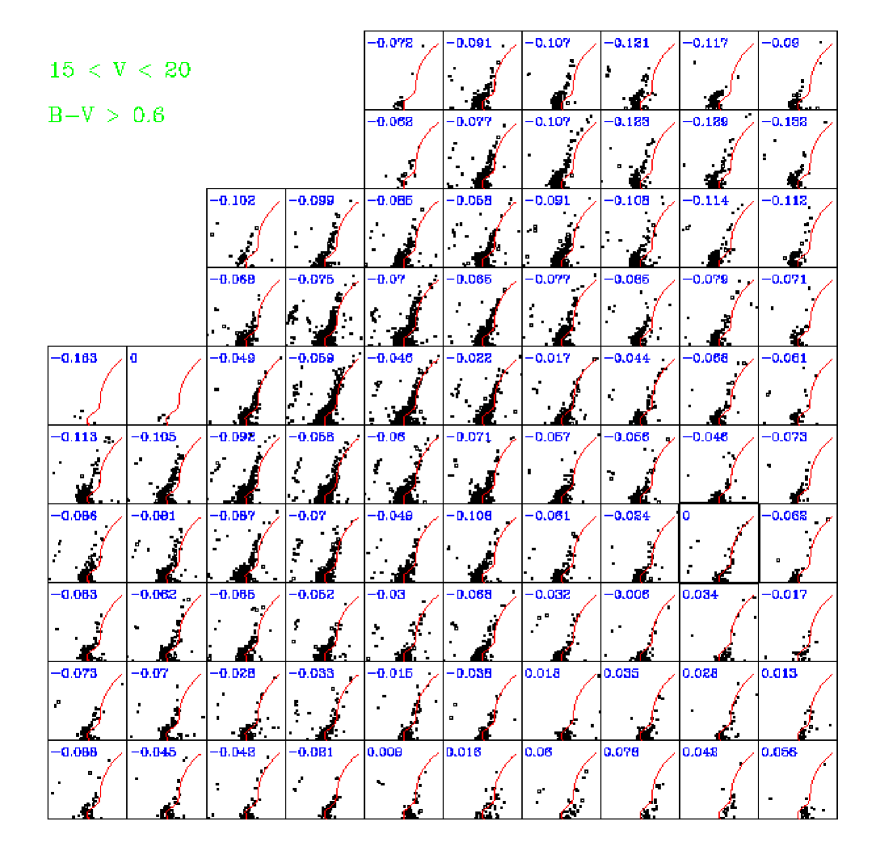
All the sequences in Fig. 1 are broadened. The broadening is much larger than the typical photometric errors, at all magnitudes. According to the artificial-star experiments, the dispersion in color due to photometric errors along the RGB (for ) is (standard deviation around the mean value). In view of the position of NGC 6273 (, ), we can expect some differential reddening. In order to test this hypothesis, we divided our field into 86 arcsec2 regions (Fig. 2). The dimensions of the regions are a compromise between the need to have the highest spatial resolution and the need to have a sufficient number of stars to be able to identify the giant-branch position. For each sub-image we obtained a CMD. We selected one of these CMDs as the reference CMD, and extracted its fiducial points by drawing a line by hand. In Fig. 2 the CMDs for each region are compared with the fiducial line obtained by fitting a spline to the fiducial points. The effects of the differential reddening are clearly visible. For each region the reddening relative to the fiducial sequence is indicated. The relative reddening has been calculated as follows. In each spatial region, for each star with and , we calculated its distance from the fiducial CMD along the reddening line [defined by the relation ]. Each one of these distances is the resultant of two components: on the abscissa and on the ordinate. The relative reddening is the median value of the abscissas of all the distances. Fig. 2 shows a radial trend of the relative reddening, with the central region less reddened. The relative reddening spans a magnitude in the WFPC2 field, confirming the results by Harris et al. (1976). The standard deviation around the average reddening [the mode of the reddening distribution for the WFPC2 field is ] is 0.05 magnitude. We also determined the average reddening of NGC 6273 by comparing the location of its EBT with the EBTs of two other clusters: NGC 1904 (Sosin et al. 1997b, Piotto et al. 1999b) and NGC 6205 (M13, Zoccali & Piotto 1999). The turning down of the blue part of the HB is due to the saturation of the color as the bolometric correction increases sharply at K. It is thus not very sensitive to metallicity or age. We selected these two clusters for the comparison because they show the same peculiar HB as NGC 6273. Besides, in Zinn & West (1984) the three clusters have the same metallicity (formally within 0.03 dex). The data of NGC 1904 and NGC 6205 are in the same HST photometric system as NGC 6273. By comparing the HBs, we find that NGC 6273 is magnitude redder than NGC 1904 and magnitude redder than NGC 6205. Assuming for NGC 1904 (Stetson & Harris 1977) and for NGC 6205 (Djorgovski 1993), we have a mean reddening for the reference fiducial points of Fig. 2 for our field in NGC 6273.
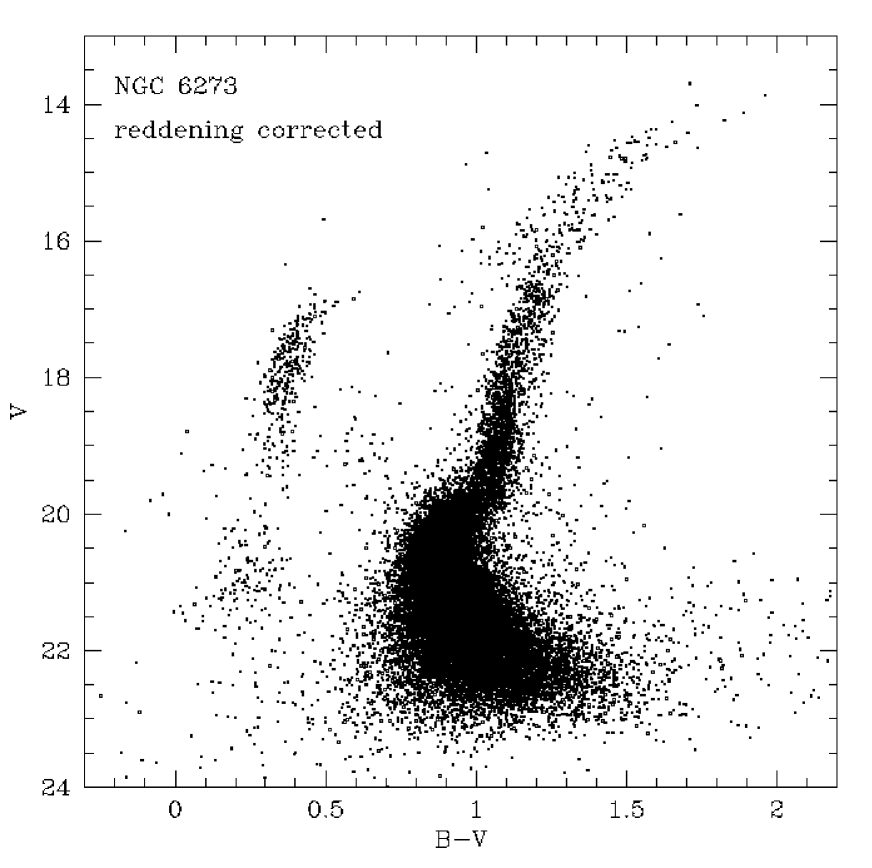
The reddening estimates in Fig. 2 can be used to (partially) correct the CMD of Fig. 1 for the effects of differential reddening. To the CMDs in each of the regions shown in Fig. 2 we applied the relative reddening values indicated, and corrected the color and the magnitude of each star for reddening and the corresponding absorption . The resulting CMD for the entire WFPC2 field is shown in Fig. 3. All the sequences in the CMD of Fig. 3 are sensibly narrower than in Fig. 1, but still broader than expected from the artificial-star experiments. There are two possible explanations: i) there might be some differential reddening on spatial scales smaller than arcsec2; ii) there might be some dispersion in the metal content of the stars in NGC 6273. Though the first hypothesis seems the more likely, nevertheless in view of the similarity of NGC 6273 to Cen discussed in Section 1, a study of the metallicity of its stars would be worth doing. The spread in the combined equivalent width of the lines in the Ca II triplet () in Fig. 7 of Rutledge et al. (1997) might be an indication of a possible metallicity dispersion among the NGC 6273 stars, but the number of measured stars is too small to allow any conclusion.
3.2 Distance
NGC 6273 has a blue HB without a horizontal portion, making the distance determination quite uncertain. So far, only three RR Lyrae have been identified in the direction of NGC 6273 (Clement and Sawyer Hogg 1978). Two of them fall within the RR Lyrae instability strip of NGC 6273, indicating possible cluster membership. The third one is 1.5 mag. brighter than the HB, and Clement and Sawyer Hogg (1978) consider it to be a non-member.
A more accurate distance estimate comes again from a comparison with NGC 1904 and NGC 6205. In particular, the large statistical sample of stars in the CMD of NGC 6273 and of the reference clusters allows us to derive an accurate luminosity function (LF), where the red-giant bump (Iben 1968) can be easily identified at . In view of the similarity in metallicity (and the similarity of the CMDs) we expect the bump to be located at the same absolute magnitude in the three clusters. From the LFs of NGC 1904 and NGC 6205 (Zoccali & Piotto 1999) we measured for NGC 1904 and for NGC 6205. Adopting an apparent distance modulus () (Ferraro et al. 1992) for NGC 1904 and () (Ferraro et al. 1997) for NGC 6205, we obtain for NGC 6273 () and (), respectively. From here on, we will adopt for NGC 6273 (). As there is no error associated with the distance determination of NGC 1904 and NGC 6205, we have assumed a typical error of 0.2 magnitude, though the method would allow relative distance determination with sensibly smaller uncertainties.
Assuming , and adopting , the absolute distance modulus of NGC 6273 is , i.e., NGC 6273 is at kpc from the Sun, at kpc from the Galactic plane.
4 The distribution along the HB
Certainly, the most prominent features of the CMDs of both Fig. 1 and Fig. 3 are the extended blue tail of the HB
and the gap along it. As discussed in Section 1, there are
other clusters which have HBs apparently similar to that of NGC 6273.
One question that is still open is whether these features originate from
the same (though still unknown) physical process. Certainly, the lack
of clear observational inputs makes more difficult the physical
interpretation of both the EBT and the gaps. There are two problems
which complicate the analysis of the presently available data:
i) the heterogeneity of the data gathered so far, in particular the
different photometric bands used;
ii) the shape of the HB,
particularly complicated in the , plane because of the
saturation of the color as a temperature index when .
In order to try to shed some light on this problem, we have collected from the HST archive all the public WFPC2 images of GGC cores observed with the same filters (F439W and F555W) that we used in our previous HST GO-6095 program, and that we are still using in the presently running GO-7470 and will use in GO-8118. At the present time, we have CMDs for 29 GGCs in this homogeneous data set. Among these, at least eight GGCs show blue tails with more or less pronounced gaps.
A detailed comparison of the positions of peaks and gaps as a function of stellar mass or temperature for different theoretical models is beyond the scope of the present paper, and will be addressed elsewhere. On a more empirical basis, as originally suggested by Rood & Crocker (1985, 1989), in order to analyze the distribution of the HB stars it is useful to define a new coordinate, , which is linear along the HB ridge line. This coordinate removes the saturation of the color as a function of the temperature. Unfortunately, different authors (Ferraro et al. 1992, Dixon et al. 1996, Catelan et al. 1998) have given different definitions of , besides the fact that sometimes the definition itself has not been clear nor the measurement of easily reproducible.
In order to linearize all the HBs in our data base, which is the largest one presently available, we were led to define an which is itself slightly different from the previous ones. However, in order to avoid confusion, and in the attempt to introduce a “standard” , we describe in detail the recipe we used.
-
•
First of all, the observed CMDs were de-reddened, as described in Section 3.1 for NGC 6273, by comparison with NGC 6205, adopting an for the latter.
-
•
The HB colors and magnitudes were then transformed according to the following relations:
These new “color” and “brightness” coordinates allow mapping the CMD onto a plane where 1 unit in the abscissa has the same length (in centimeters) as 1 unit in the ordinate, mantaining the same scale as in Ferraro et al. (1992) and Fusi Pecci et al. (1993). This last condition (which is at the basis of the choice of the numerical factors in the above equation) is not strictly necessary for the comparison among our clusters, but we preferred to keep our as close as possible to the previous definitions.
-
•
The HB ridge lines (HBRL) were obtained by a spline interpolation of hand-drawn fiducial points.
-
•
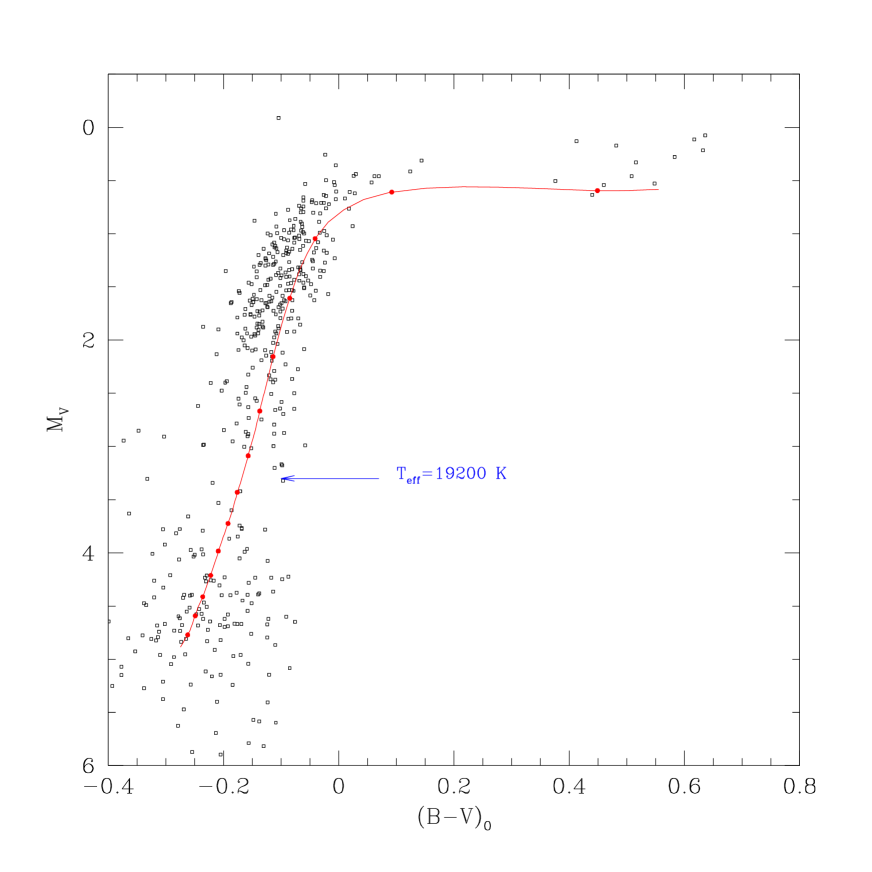
As shown in Fig. 4, the projection of each HB star on the HBRL was determined as the point (, ) that minimizes the distance
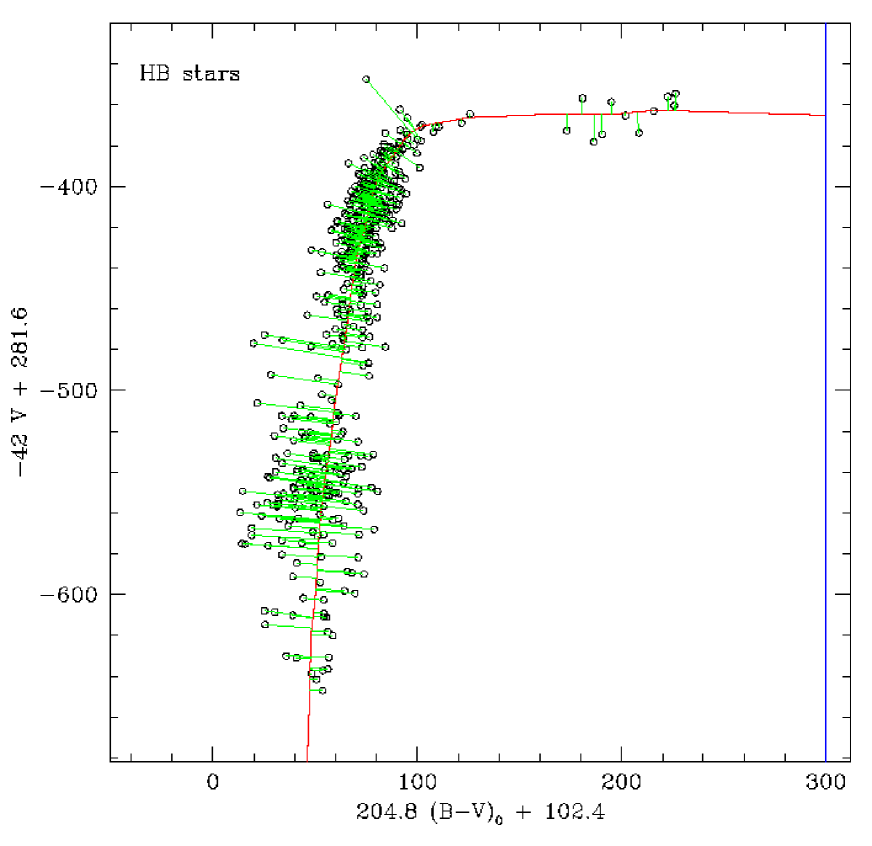
Figure 4: The diagram used to project the HB stars of NGC 6273 onto the HBRL. In this scale, 1 unit in the abscissa has the same length as 1 unit in the ordinate. The HBRL and the projection vector of each star are shown. The vertical line on the right marks the adopted zero point for . -
•
For each star, the length of the HBRL from a fixed zero point of the coordinate, at , to the point (,) was then computed by dividing the HBRL into pieces of , and approximating each of these pieces by a straight line.
-
•
Finally, the coordinate was obtained applying the scaling relation:
as in Dixon et al. (1996) for NGC 1904.
This procedure gives an on the same scale as in Ferraro et al. (1992) and Dixon et al. (1996), with a different zero point for , now set at (corresponding to ). The zero point corresponds to a point redder than the reddest HB star in NGC 6441 (the most metal-rich of our clusters), in order to avoid negative values for .
4.1 The HB of NGC 6273
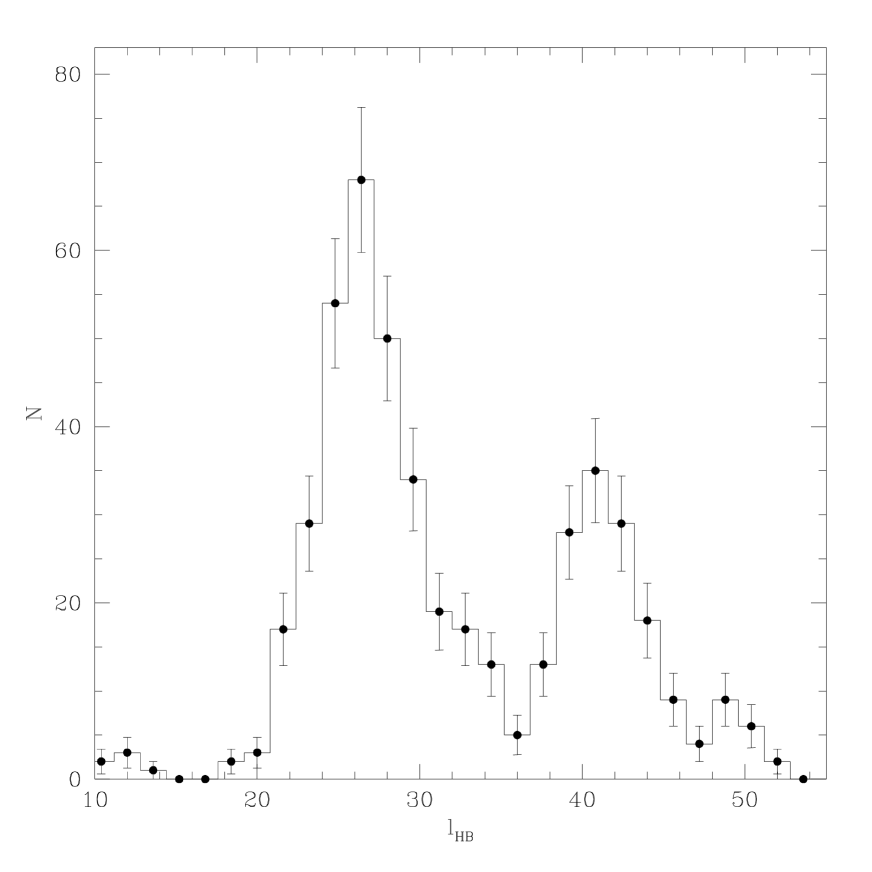
The distribution for NGC 6273 is shown in Fig. 5. The HB shows two remarkable peculiarities. First of all, there is a blue tail which in the CMD extends well below the cluster turnoff. Second, the EBT is clearly bimodal, with two peaks centered on and on and a large gap, centered on . Apart from NGC 2808, none of the HBs with EBTs in our sample (cf. Section 4.2) shows such a clear bimodality in the distribution. Fig. 5 shows that the two peaks are quite sharp. It is questionable whether the distribution along the EBT of NGC 6273 is peculiar because of the presence of these two peaks or rather because of the gap. The two peaks can be fitted with gaussian functions centered on and on with a sigma of 2.1 and 2 in units, respectively. According to the new horizontal-branch models by Bono, Cassisi, & Castellani (1999), this dispersion in corresponds to a mass dispersion on the HB. Figure 6 shows an enlargment of the HB of NGC 6273 with overplotted the HB model by Bono et al. (1999). The model has been fitted adopting the average reddening obtained in Section 3.1 and allowing a vertical shift such that the model is the lower envelope of the red HB stars. According to these models, the gap in NGC 6273 corresponds to a K, and to a mass of .
4.2 Multimodal HBs in other clusters
Though the gap in Fig. 5 is remarkable, it is rather difficult to assess its statistical significance. None of the methods suggested by Catelan et al. (1998) can be applied to NGC 6273, as it is not possible to know what is the underlying true distribution. Surely it cannot be uniform, as supposed by Ferraro et al. (1998) for NGC 6093 and NGC 6205. On the other hand, there are other clusters which have blue tails and show gaps in the HB which might be related to the gap in NGC 6273. It is of some interest to check whether these gaps are located in similar positions on the HBs of different clusters. Ferraro et al. (1998) have shown that all the clusters with EBTs have a gap on the lower part of the blue tail. They have also suggested that at least one gap seems to be present at the same location in all clusters, at K. The models in Fig. 6 seem to suggests a slightly hotter temperature for the gap in NGC 6273. However, the absolute value of the temperature depends on the adopted models (Ferraro et al. used the models by Dorman et al. 1997), and the adopted transformation from the theoretical to the observational plane. Moreover, the vs. plane is not the best one for estimating the of such hot stars, which can be better estimated with ultraviolet observations, as in Ferraro et al. (1997).
In the following, we will try to take advantage of the fact that we have eight clusters with blue HB tails observed exactly in the same photometric system and with homogeneous photometry. We already noted that our photometric bands are far from ideal for a study of the hot population in the EBT of the GGCs, and that, due to the saturation of the () color for stars hotter than K the HB becomes almost vertical, making more difficult the identification of all the possible gaps (real or statistical fluctuations as they might be). A typical example is NGC 1904, for which Hill et al. (1996) suggested a possible gap at K, which is not visible in our HST CMD (Sosin et al. 1997b). Still, in Figs. 7 and 9, there is clear evidence of gaps (the most significant ones are indicated by arrows), so we can still try to address the question of whether there is anything systematic about their positions.
One possible way to compare the location of the gaps in different clusters is to compare their directly. This method has the advantage of being totally empirical. However, in turn it makes very hard the interpretation of the different locations of the gaps in terms of physical parameters like or mass. This is mainly due to the fact that, by definition, does not run over the ZAHB, but over the mean HB line; therefore the comparison between observed data and models (which refer to the ZAHB) is not completely consistent. On the other hand, forcing to run over the ZAHB (i.e., the model) instead of on the mean ridge line, may introduce strong biases in the projections of the stars in those regions where the shape of the model does not reproduce exactly the observed HB. Finally, the models often do not reach magnitudes as faint as the data do, in the EBT. For these reasons, and since all the gaps visible in our CMDs are actually located in the vertical part of the HB, we decided that a more direct analysis could be done by simply comparing the distribution in absolute magnitude of the vertical part of the HBs of the different clusters.
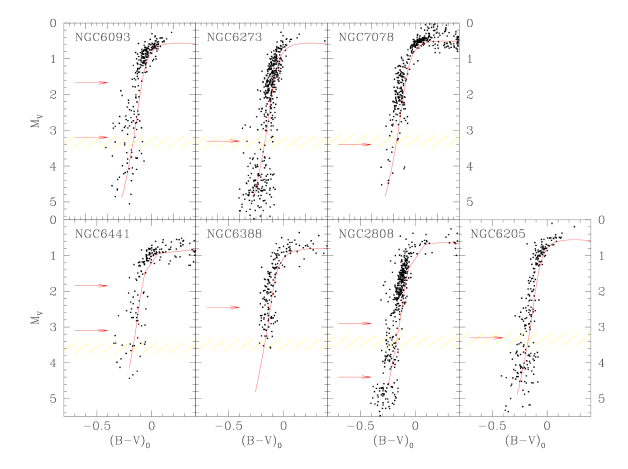
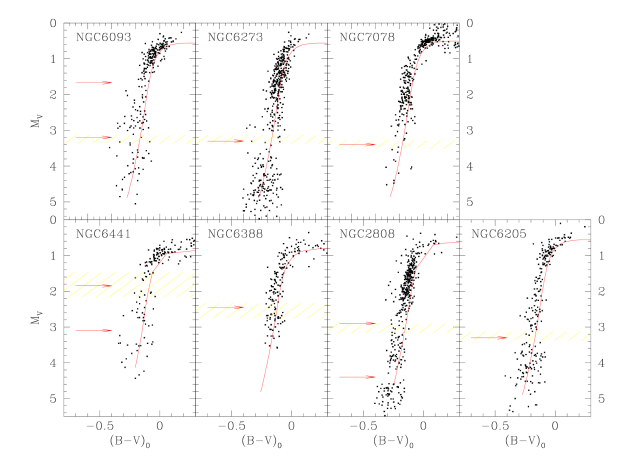
To this end, we proceeded as follows. We registered the blue bend of all the HBs to that of NGC 6205, in order to constrain the relative reddening. We then assumed an for NGC 6205 and de-reddened accordingly the HBs of all the other clusters. Allowing only a vertical shift we then matched the lower envelope of the stars in the observed HBs with the models by Bono et al. (1999), as shown by Fig. 7. In this figure, the most prominent HB gaps are indicated with the horizontal arrows. Following the suggestion by Ferraro et al. (1998) we marked with a dashed horizontal strip the region corresponding to K (i.e., the temperature at the center of the gap of NGC 6273). At least one gap of the intermediate-metallicity and metal-poor clusters is always inside this strip, confirming their hypothesis that in all the EBTs there is a gap corresponding to this temperature. However, for the more metal-rich clusters, namely NGC 6441, NGC 6388, and NGC 2808, there is no gap corresponding to the dashed areas in Fig 7. While in the case of NGC 6388 the region at K is in any case in a sparsely populated part of the CMD, in NGC 6441 and NGC 2808 it corresponds to local peaks in the distribution along the HB. Note that in the case of NGC 2808, all the gaps visible in the ultraviolet regions ( vs. F214W diagram) are also visible in the vs. CMD (Sosin et al. 1997). We do not have suitable UV data for NGC 6388 and NGC 6441. Shall we conclude that gaps are at random positions in the HB? Of course, the uncertainties in the models and in the transformation from the theoretical to the observational plane, and the errors in fitting the models to the observed HB, play an important role in the interpretation of Fig. 7; we cannot exclude that the hypothesis in Ferraro et al. (1998) is still valid. On the other hand, it is possible that some of the gaps marked in Figs. 7 and 9 are a random fluctuation in the distribution of the stars along the HB (Catelan et al. 1998). We have also tested an alternative hypothesis. Since the main parameter governing the position of a star along the HB is the ratio of the envelope mass to the core mass (a ratio that follows from the total mass, assuming that the core mass is the same for all these stars), we have investigated the possibility that the gaps appear at costant mass on the HB. Fig. 8 shows the same HBs of Fig. 7 with a shaded region indicating the magnitude corresponding to . At least one gap of each cluster falls inside this area, suggesting that the possibility of the gaps being physically associated with a “forbidden” value of the mass is compatible with the observations. The analysis of the histograms, in absolute magnitude, of the stars in the vertical portion of the HBs gives the same result. Figures 9 and 10 show the distribution of the same stars plotted in Figs. 7 and 8 as a function of magnitude. Again, the shaded region indicates the constant-temperature loci (Fig. 9) and the constant-mass loci (Fig. 10). And again, the hypothesis of a set of gaps at constant mass for all the clusters with EBT is in agreement with all the data at our disposal.
In conclusion, the distribution of the stars along the blue HB tails is clearly not uniform and differs from cluster to cluster. There are both peaks and gaps. All the clusters with an EBT have at least one gap, as suggested by Ferraro et al. (1998). Of course a sample of only seven clusters is not sufficient to draw any conclusion at this point. Moreover, as mentioned above, the plane is not the ideal one for these studies. Still, Figures 7–10 suggest that the possibility that gaps are at constant mass is at least as plausible as the hypothesis of gaps at constant temperature as suggested by Ferraro et al. (1998). There are also other gaps, which apparently are not directly related to either of the two proposed hypotheses.


5 Luminosity Functions
¿From the CMD of Fig. 3 it is possible to extract a LF for the evolved stars, which is an important direct test of the evolutionary clock (Renzini & Fusi Pecci 1988). It has been recently pointed out that, at least for the metal-poor clusters, the agreement of the models with the observed LFs for the GGC stars is far from satisfactory (Faulkner & Swenson 1993, Bolte 1994, and references therein). Sandquist et al. (1998), by comparing the LF of M30 with the theoretical LFs from Bergbusch & VandenBerg (1992) and VandenBerg et al. (1999), confirm this result, at least for the most metal-poor clusters, and suggest that it might be the consequence of some deep mixing events. On the other hand, Silvestri et al. (1998) claim that their set of models strongly reduces the discrepancy with the observed LFs, though they cannot provide the reasons for the differences among the different models.
The rich fields in the centers of the GGCs whose CMDs we are collecting are suitable for a detailed study of the evolution time scales along the red giant branch. In Piotto et al. (1999a) we already presented a comparison between the Bergbusch & VandenBerg (1992) LFs and the observed LFs for NGC 6362 and NGC 6934, with conflicting results. While the LF of NGC 6934 ([Fe/H] ) could be reasonably well fitted with the theoretical LFs by Bergbusch & VandenBerg (1992), NGC 6362 ([Fe/H] ) showed the same excess of bright giants as suggested by Bolte (1994) for the most metal-poor clusters.
We first tried the same fit as in Piotto et al. (1999a), using the appropriate set of isochrones from Bergbusch & VandenBerg (1992), on the observed LF of NGC 6273, after the crowding corrections. Again, we found an overabundance of bright RGB stars with respect to the MS, as for NGC 6362 or M30 (Sandquist et al. 1998).
A better fit could be obtained using both the most recent models by Silvestri et al. (1998), and the models by Straniero, Chieffi & Limongi (1997). In order to mimic an -element enhancement of 0.4 (Sneden et al. 1991), we adopted a higher metallicity than discussed in Section 1, following the method described by Salaris et al. (1993). We also adopted a flat mass function (, where the Salpeter slope is 1.35), which is more appropriate for the GC center. In both cases there is a good agreement between the observed and theoretical LFs (Fig. 11 and Fig. 12), which mostly removes the claimed discrepancies with the calculated evolutionary times along the RGB. We note that the models by Straniero et al. (1997) seem to reproduce the observed stellar distribution better.
Piotto et al. (1999a) also suggested that the large number of evolved stars in the LF from the cluster cores could be used to infer the cluster ages independently. Silvestri et al. (1998) pointed out that the method can work, provided we have an independent distance estimate. This is also evident from Figs. 11 and 12. Each panel shows the fit of the NGC 6273 LF with the theoretical LFs for 4 different ages. The inset in each panel shows the trend as a function of the distance. The minimum value of the is similar in the three panels corresponding to an age Gyr, while it is higher for 10 Gyr. Note that if we allow the distance to vary, there is no preferred age between 12 and 16 Gyr. However, this would imply an uncertainty in the apparent distance modulus at a level of more than 0.4 magnitude, which is not realistic. On the other hand, if we have some estimate of the distance, the uncertainty in the age is drastically reduced. For example, if we take the distance estimate from Section 3.2 we are forced to conclude that the age of NGC 6273 is Gyr (from the Straniero et al. 1997 models, slightly older than from the Silvestri et al. models). Note that the distance obtained in Section 3.2 is still based on the old, shorter distance scale. If we adopt the longer distance scale from the HIPPARCOS data, as in Gratton et al. (1997), we should reduce the ages by 2 Gyr.
It remains still to verify the suggestion by Bergbusch & VandenBerg (1992) that the detailed structure of the LF around the TO can constrain both the age and the distance. The smearing of the LF due to the differential reddening does not allow applying the method to NGC 6273, however.


6 Acknowledgments
References
- (1)
- (2) Bolte, M. 1994, ApJ, 431, 223
- (3) Bono, G., Cassisi, S., & Castellani, V. 1999, in prepation
- (4) Bergbusch, P. A., & VandenBerg, D. A. 1992, ApJS, 81, 163
- (5) Catelan, M., Borissova, J., Sweigart, A. V., Spassova, N., 1998, ApJ, 494, 265
- (6) Clement, C., & Sawyer Hogg, H., 1978, AJ, 83, 167
- (7) Cool, A. M., Piotto, G., & King, I. R. 1996, ApJ, 468, 655
- (8) Dixon, W. V. D., Davidsen, A. F., Dorman, B., & Ferguson, H. C., 1996, AJ, 111, 1936
- (9) Djorgovski, S. 1993, in Structure and Dynamics of Globular Clusters, eds. S. G. Djorgovski & G. Meylan (San Francisco: ASP),p. 373
- (10) Ferraro, F. R., Clementini, G., Fusi Pecci, F., Sortino, R., & Buonanno, R. 1992, MNRAS, 256, 391
- (11) Ferraro, F. R., et al. 1997, A&A, 324, 915
- (12) Ferraro, F. R., Paltrinieri, B., Fusi Pecci, F., Rood, R. T., & Dorman, B., 1998, ApJ, 311, 319
- (13) Faulkner, J., & Swenson, F. J. 1993, ApJ, 411, 200
- (14) Fusi Pecci, F., Ferraro, F. R., Bellazzini, M., Djorgovski, S. G., Piotto, G., & Buonanno, R., 1993, AJ, 105, 1145
- (15) Gratton R. E., Fusi Pecci, F., Carretta, E., Clementini, G., Corsi, C., & Lattanzi, M. 1997, ApJ, 491, 749
- (16) Harris, W. E., Racine, R., & de Roux, J., 1976, ApJS, 31, 13
- (17) Hill, R. S., 1996, AJ, 112, 601
- (18) Holtzman, J. A., Burrows, C. J., Casertano, S., Hester, J. J., Watson, A. M., & Worthey, G. S. 1995, PASP, 107, 1065
- (19) Iben, I. 1968, Nature, 220, 143
- (20) Norris, J., 1983, ApJ, 272, 245
- (21) Piotto, G., Zoccali, M., King, I. R., Djorgovski, S. G., Sosin, C., Dorman, B., & Rich, R. M. 1999a, AJ, 117, 264
- (22) Piotto, G., et al. 1999b, in preparation
- (23) Renzini, A., & Fusi Pecci, F. 1988, ARA&A, 26, 199
- (24) Rood, R. T., & Crocker, D. A., 1985, in Horizontal Branch and UV-Bright Stars, ed. A. G. D. Philip (Schenectady: L. Davis Press), 99
- (25) Rood, R. T., & Crocker, D. A. 1989, in The Use of Pulsating Stars in Fundamental Problems of Astronomy (IAU Colloq. 111), ed. E. G. Schmidt (Cambridge: Cambridge Univ. Press),p. 103
- (26) Rutledge, G. A., Hesser, J. E., Stetson, P. B., Mateo, M., Simard, L., Bolte, M., Friel, E. D., & Copin, Y., 1997, PASP, 109, 883
- (27) Salaris, M., Chieffi, A.,& Straniero, O., 1993, ApJ, 414, 580
- (28) Sandquist, E. L., Bolte, M., & Hernquist, L. 1997, ApJ, 477, 335
- (29) Silbermann, N. A., et al. 1996, ApJ, 470, 1
- (30) Silvestri, F., Ventura, P., D’Antona, F., & Mazzitelli, I., 1998, ApJ, submitted
- (31) Sneden, C., Kraft, R. P., Prosser, C. F., & Langer, G. E., 1991, AJ, 102, 2001
- (32) Sosin, C., Dorman, B., Djorgovski, S. G., Piotto, G., Rich, R. M., King, I. R., Liebert, J., Phinney, E. S., & Renzini, A. 1997aApJ, 480, L35
- (33) Sosin, C., Piotto, G., King, I. R., Djorgovski, S. G., Rich, R. M., King, I. R., Dorman, B., Liebert, J., & Renzini, A. 1997b in Advances in Stellar Evolution, eds. R. T. Rood and A. Renzini (Cambridge: Cambridge Univ. Press), p. 92
- (34) Stetson, P. B., & Harris, W. E., 1977, AJ, 82, 954
- (35) Straniero, O., Chieffi, A., & Limongi, M., 1997, ApJ, 490, 425
- (36) VandenBerg D. A., Swenson F. J., Rogers F. J., Iglesias C. A., & Alexander D. R., 1998, ApJ, submitted
- (37) White, R. E., & Shawl, S. J., 1987, ApJ, 317, 246
- (38) Zinn, R., & West, M. 1984, ApJS, 55, 45
- (39) Zoccali, M., & Piotto, G., 1999, in preparation
- (40)