Water vapor absorption in early M-type stars
Abstract
The spectrometers onboard the Infrared Telescope in Space (IRTS) reveal water vapor absorption in early M-type stars, as early as M2. Previous observations detected H2O vapor absorption only in stars later than M6, with the exception of the recent detection of H2O in $β$~Peg (M2.5 II-III). In our sample of 108 stars, 67 stars have spectral types earlier than M6. The spectral types are established by means of their near-infrared colors on a statistical basis. Among the 67 stars of spectral types earlier than M6, we find water vapor absorption in six stars. The observed absorption features are interpreted using a local thermodynamic equilibrium model. The features are reasonably fitted by model spectra with excitation temperatures of 1000–1500 K and water column densities of to cm-2. These numbers imply that the H2O molecules are present in a region of the atmosphere, located above the photosphere. Furthermore, our analysis shows a good correlation between the H2O absorption band strength, and the mid-infrared excess due to the circumstellar dust. We discuss the relation between the outer atmosphere and the mass loss.
Key Words.:
infrared: stars – stars: late-type – stars: atmospheres – stars: circumstellar matter – stars: variables – surveys1 Introduction
Water is one of the most abundant molecules in the atmosphere of late M-giants, and it is a dominant absorber in the near-infrared (near-IR) region. Water vapor in stellar atmospheres has been studied by theoretical and observational methods. The strength of the H2O absorption possibly correlates with the spectral type, the effective temperature of the star, and the near-IR color (Kleinmann & Hall kleinmann (1986); Lançon & Rocca-Volmerange lancon (1992)), even though such correlations were not clearly found by Hyland (hyland (1974)). According to Spinrad & Wing (spinrad (1969)) and Hyland (hyland (1974)), H2O could only be detected in giants with spectral type M6 or later. This was consistent with hydrostatic models of the atmosphere of red-giants (Tsuji tsuji (1978); Scargle & Strecker scargle (1979)). As a further complication, most late M-giants are long period variables, and in general, the band strength of the H2O absorption features depends on stellar variability. For example, Mira variables show very deep H2O absorption, and the depths of H2O features in Miras vary from phase to phase (Hyland hyland (1974)). High-resolution spectroscopic observations of the Mira variable R Leo by Hinkle & Barnes (hinkle (1979)) revealed that a significant fraction of the H2O molecules were in a component with a distinct velocity, and a cooler excitation temperature than molecules near the photosphere. They interpreted this ‘cool component’ as an overlying layer above the photosphere.
These previous studies were mostly based on ground or airborne observations, where the terrestrial H2O interferes with a detailed study of the center of the stellar water bands. In contrast, observations from space are ideal for investigations of stellar H2O features. Using the Infrared Space Observatory (ISO), Tsuji et al. (tsuji97 (1997)) discovered a weak H2O absorption in the early M-type star, $β$~Peg (M2.5II-III). They argued that the observed H2O is in a ‘warm molecular layer’ above the photosphere.
In this paper, we present the results of a study of H2O absorption features, using data from the Infrared Telescope in Space (IRTS, Murakami et al. murakami96 (1996) and references therein).
2 Sample Data
This study is based on data from the two grating spectrometers onboard the IRTS: the Near-Infrared Spectrometer (NIRS), and the Mid-Infrared Spectrometer (MIRS). The IRTS was launched in March 1995, and it surveyed about 7% of the sky with four instruments during its 26 day mission. The NIRS covers the wavelength region from 1.43 to 2.54 and from 2.88 to 3.98 m in 24 channels with a spectral resolution for point sources of m. The MIRS covers the range from 4.5 to 11.7 m in 32 channels with a resolution of m. Both spectrometers have a rectangular entrance aperture of . The total number of detected point sources is about 50,000 for the NIRS (Freund et al. freund (1997)) and about 1,000 for the MIRS (Yamamura et al. yamamura96 (1996)). The estimated absolute calibration errors are 5% for the NIRS, and 10% for the MIRS. This may cause systematic errors in the colors and the H2O index discussed in this paper. The spectra are not color corrected.
All stars used in this study were observed both by the NIRS and the MIRS between April 9 and 24. We only include stars at high galactic latitudes () in this sample, to minimize source confusion and interstellar extinction. Each selected star has a unique association with the IRAS Point Source Catalog (PSC, iras-psc (1988)), within 8 from the nominal NIRS position, and each associated PSC entry has reliable 12 and 25 m band fluxes (FQUAL3; IRAS Explanatory Supplement iras-es (1988)). Known carbon and S-type stars (Stephenson stephenson89 (1989), stephenson84 (1984)), as well as non-stellar objects were discarded from the sample. The current sample contains 108 stars. The signal-to-noise ratio for all stars is larger than 5 in all NIRS bands.
Of the 108 stars used in this study, 43 have a unique association in the Bright Star Catalogue (BSC, Hoffleit & Jaschek bsc (1991)). The distribution of spectral types for these 43 stars are: 1 B, 2 F, 4 G, 22 K, and 14 M-types. A total of 31 M-giants are found in the General Catalogue of Variable Stars (GCVS, Kholopov et al. gcvs (1988)), and the distribution of variable types in the GCVS is as follows: 10 Miras, 13 semi-regulars (SR, SRa or SRb, hereafter SR), and 8 irregulars (L or Lb, hereafter L). No M-dwarfs or M-supergiants were found in the BSC or the GCVS associations.
3 Results
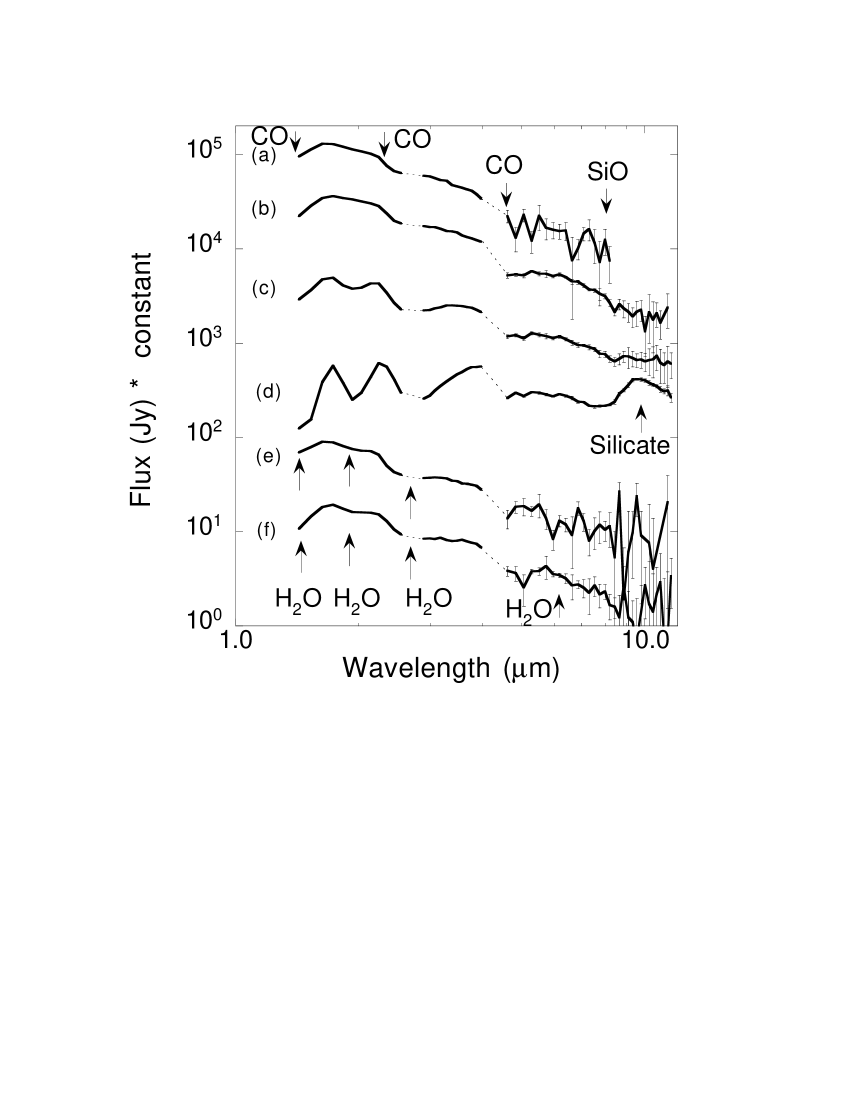
In Fig. 1, we show the composite spectra of six representative M-giants observed by the NIRS and the MIRS. We indicate the position of the molecular absorption features due to CO (1.4, 2.3, 4.6 m), H2O (1.5, 1.9, 2.7, 6.2 m), and SiO (8.2 m). The broad-band emission at 9.7 m is due to silicate dust. The H2O bands at 1.9 and 2.7 m are visible in two early M-giants, AK~Cap (M2, Lb) and V~Hor (M5, SRb), where no H2O in the photosphere was expected to be detectable.
One could argue that the early M-type stars with H2O absorption had spectral types later than M6 at the time of observation, because of their variability. However, this is not the case. We can estimate the spectral types, using the relation between the spectral type and color (Bessell & Brett bessell88 (1988)). We use the color instead of the photometric color , where is defined as:
| (1) |
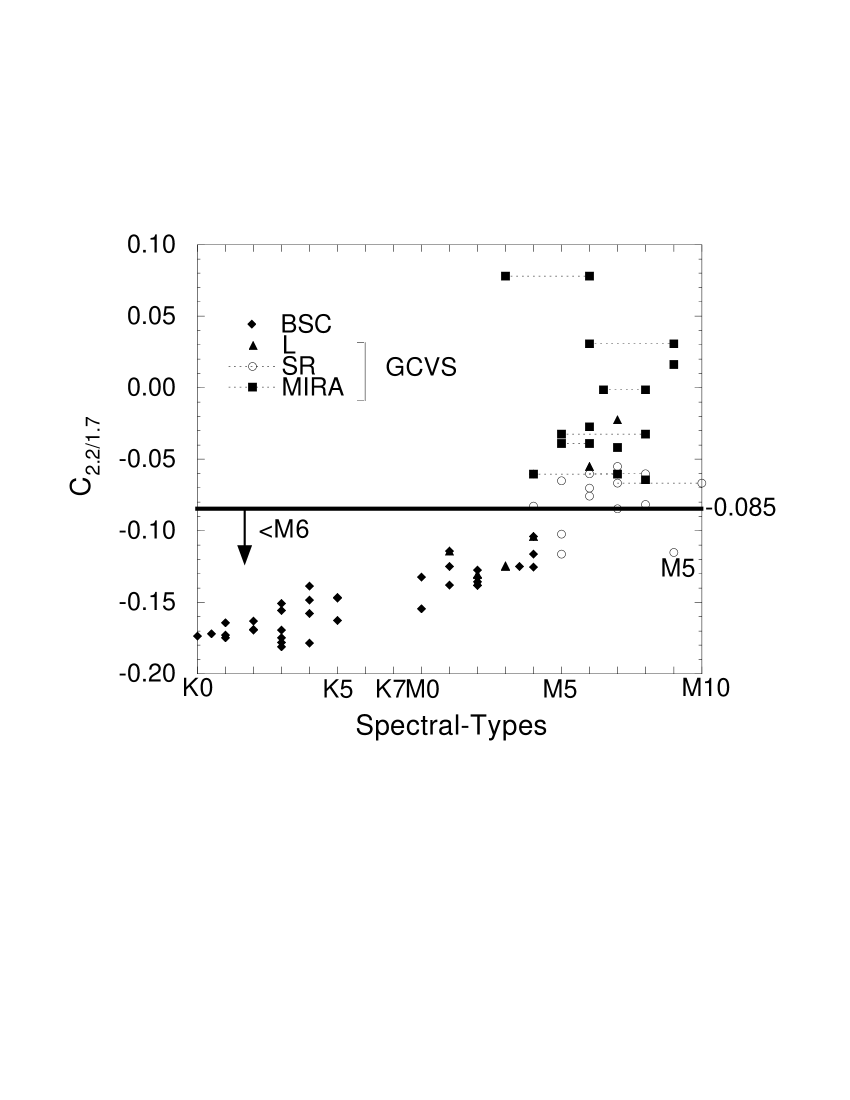
and are the IRTS/NIRS fluxes at 2.2 and 1.7 m in units of Jy, respectively. For the NIRS wavelength region, the 2.2 and 1.7 m bands are least affected by stellar H2O absorption bands. Fig. 2 shows versus the spectral types from BSC and GCVS of all the known K- and M-giants (59 giants) in the sample. There is a clear increase in toward later spectral type except for Miras. One M9 star (KP~Lyr ADS 11423) deviates from this relation, but we regard this star as M5, according to Abt (abt (1988)).
All stars of spectral type M6 and later are above . Thus, stars bluer than are expected to have spectral types earlier than M6. There are 67 stars in the M6 region, defined by . for AK~Cap and V~Hor is and , respectively. These numbers confirm that these 2 stars have spectral types earlier than M6 at the time of the IRTS observation, even though both stars show clear H2O absorption.
We now discuss the relationship between the H2O absorption strength and the spectral type. For this, we define the H2O index as follows:
| (2) |
where is the continuum flux level at 1.9 m in units of Jy, which is evaluated by linear interpolation between and . is the observed flux (Jy) at 1.9 m. In Fig. 3, we plot as a function of . The dominant measurement errors for and are due to by the slitless spectroscopy, and they are roughly 0.01 and 0.002 for stars M6, respectively.
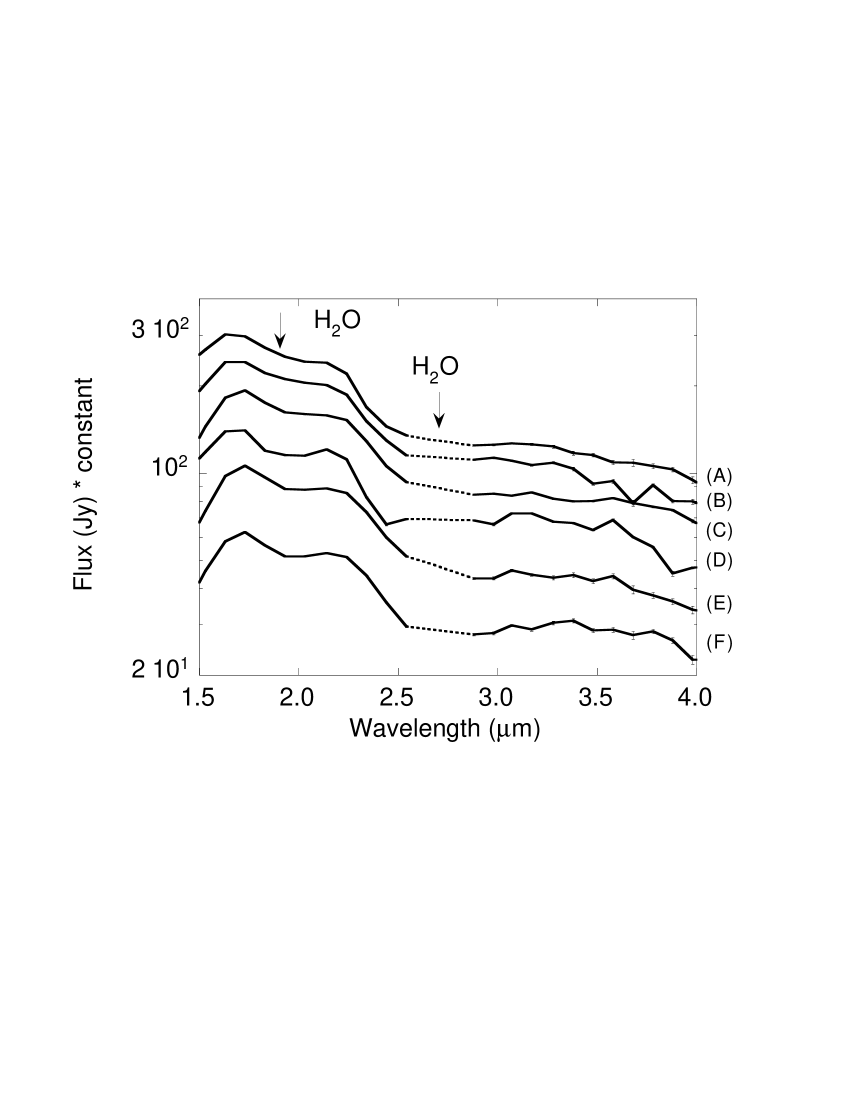
Fig. 3 can be used to find candidate stars ( M6) with H2O absorption. Since we estimated by linear interpolation, is not zero even in the absence of H2O. We evaluate the relation between and for stars without H2O, using a linear fit for the 67 stars in the M6 region, by minimizing a merit function for data points (Press et al. press (1986)). This fit is robust against outliers, i.e. stars with H2O. The result is indicated as a thick line. The thin lines indicate level from the fit, where is standard deviation of . Here, we use the level as a threshold to find candidate stars with H2O, because no star appears below the line. The stars above the are supposed to be stars with H2O absorptions. There are 6 such stars in the region of M6. The value of is almost equal to that of 3 standard deviations after the outliers are excluded. The spectra of the stars are shown in Fig. 4. These 6 stars above the line show clear evidence of H2O absorption bands at 1.9 and 2.7 m. Only AK~Cap and V~Hor have identifications of spectral type in BSC or GCVS. On the basis of their (ranging from to ), the other four stars are probably M-type stars, and not K-type stars (see Fig. 2).
4 Discussion
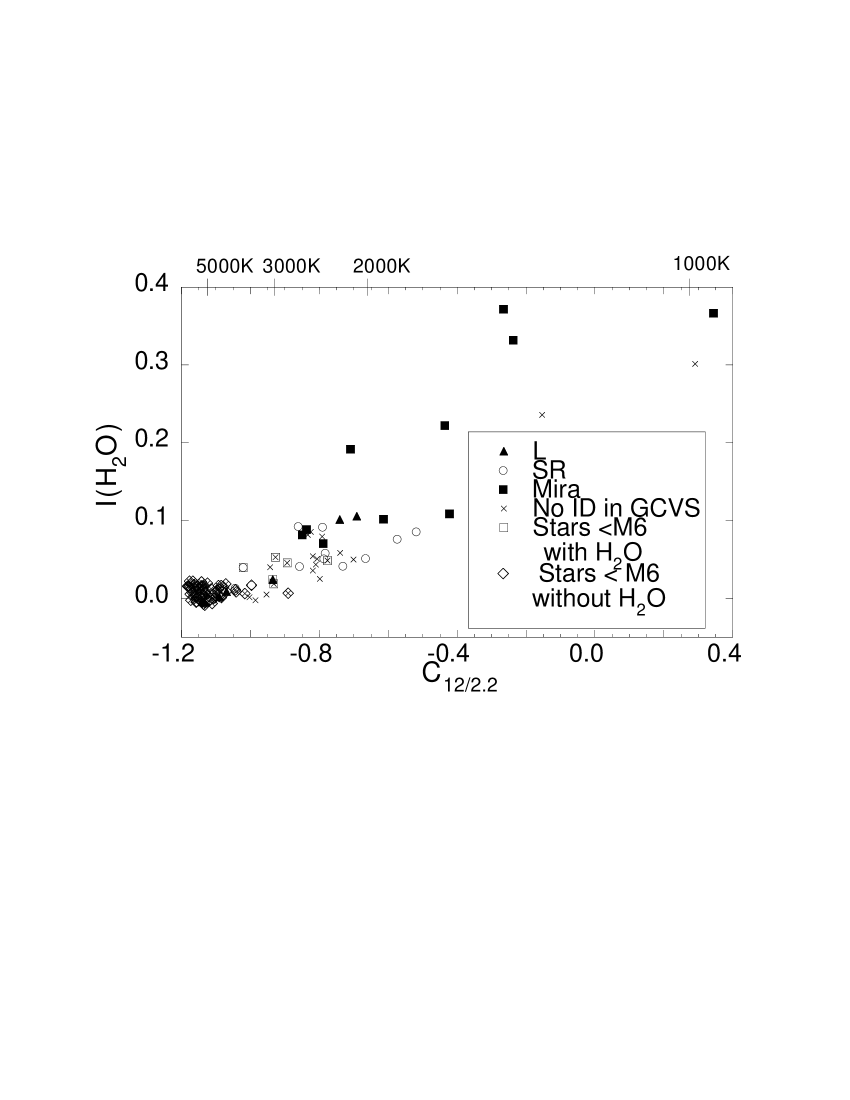
In Fig. 5, we plot versus the color defined by the NIRS 2.2 m band flux and IRAS 12 m flux () as:
| (3) |
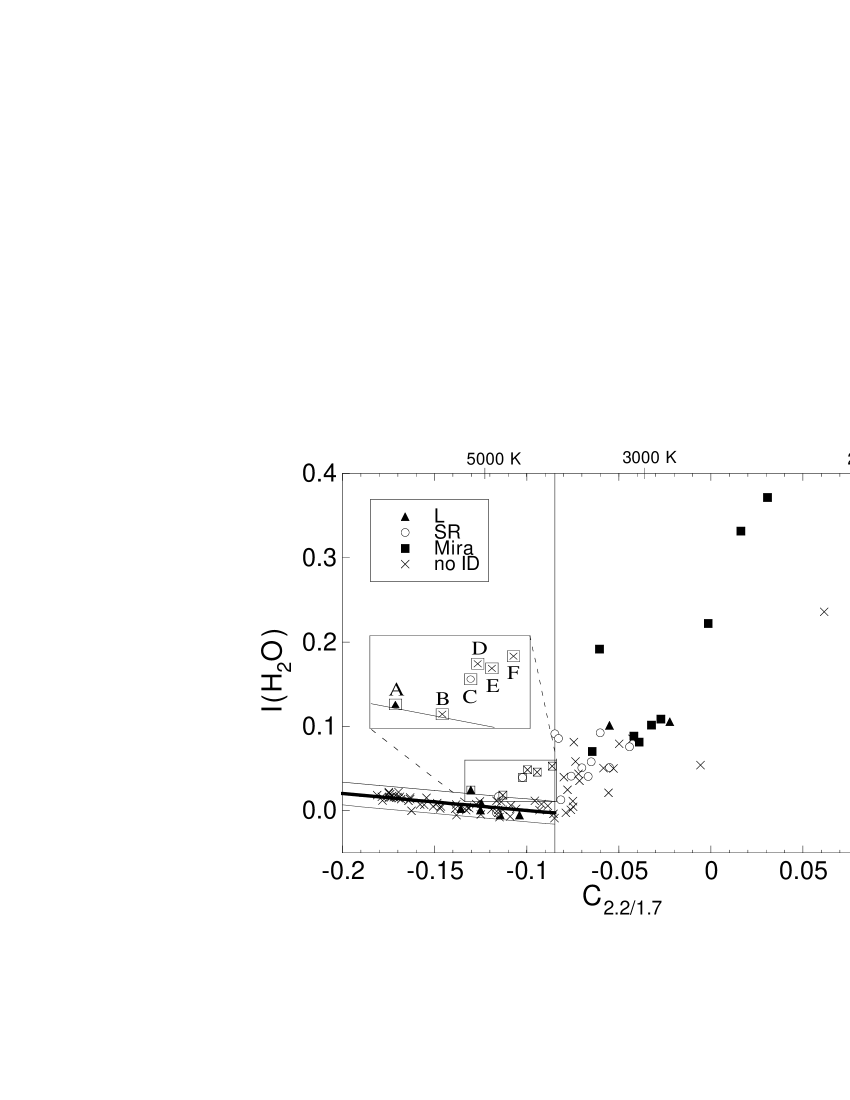
is a measure of the IR excess due to circumstellar dust, and is roughly equivalent to , which is an indicator of mass-loss rate in Miras (Whitelock et al. whitelock (1994)). Fig. 5 shows boundary at between early M-type stars with H2O and those without H2O (we regard all stars below the line in Fig. 3 as early M-type stars without H2O). Furthermore, there is a clear correlation between and , which implies that the H2O absorption is related to the circumstellar dust emission. However, as we show below, the H2O molecules are not necessarily located in the circumstellar envelope.
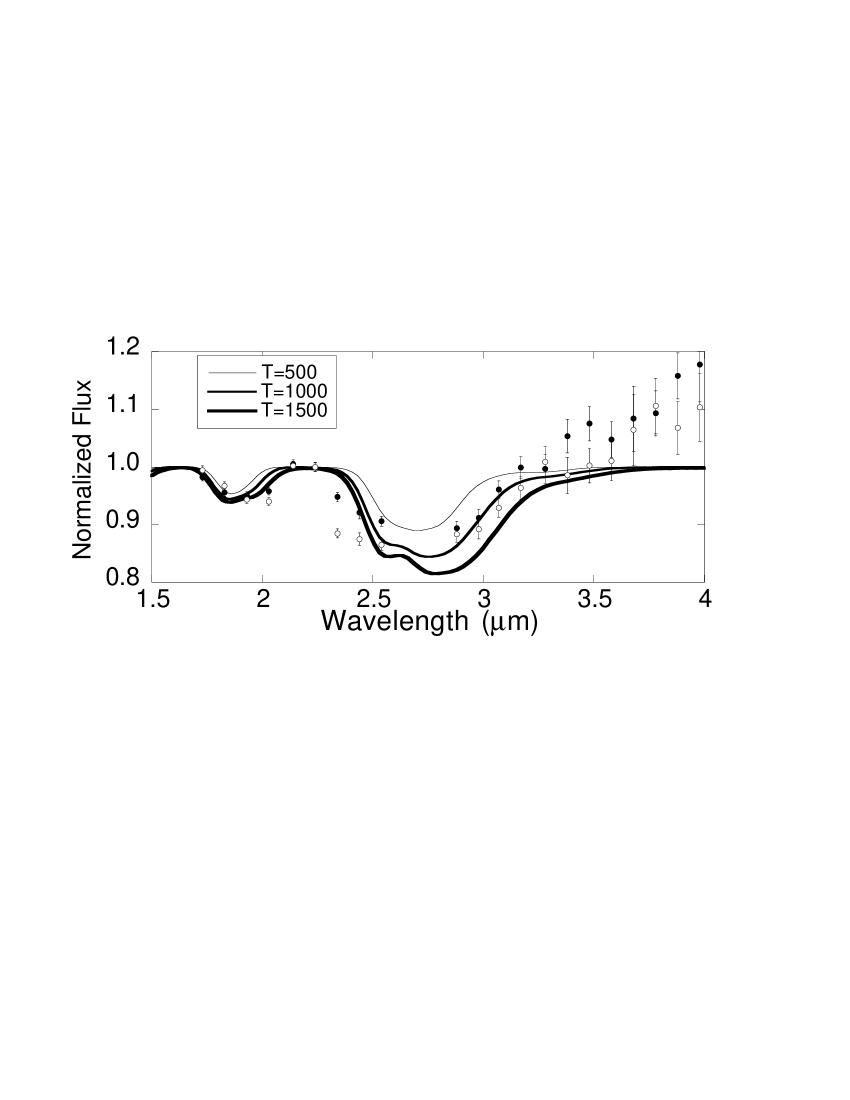
We estimate the excitation temperature (), and the column density () of H2O molecules in early M-type stars. The spectrum of a representative star AK~Cap is normalized with respect to the spectra of two early M-type stars, which have the same spectral types and similar near-IR color (), but do not show H2O absorption (), or dust excess (). The resulting normalized spectrum of AK~Cap is fitted by a simple plane parallel model with a uniform molecular layer assuming local thermodynamic equilibrium (LTE) (Fig. 6). The H2O line list is taken from Partridge & Schwenke (partridge (1997)). The turbulent velocity is assumed to be 3 . For AK~Cap, we obtain a reasonable fit for –K and cm-2. A similar analysis for V~Hor (M5III) results in –K and cm-2. If we assume that the H2O molecules were in the circumstellar envelope, the mass-loss rate obtained from these column densities would exceed (assuming an abundance ratio of H2O/H2 ; Barlow et al. barlow (1996)), which is about a factor of 10–100 larger than those expected for Ls and SRs (–, Jura & Kleinmann jurab (1992)). Thus, the H2O molecules responsible for observed feature cannot be in the circumstellar shell.
In contrast, our measured values for and are in good agreement with results by Tsuji et al. (tsuji97 (1997)), who suggested that the H2O molecules in M-type stars are located in the layer above the photosphere. Our numbers are also consistent with by Hinkle & Barnes (hinkle (1979)) for the ‘cool component’ of the Mira variable R~Leo, which is an overlaying layer of photosphere. Because the H2O molecules responsible for the near-IR absorption cannot be in the circumstellar shell, and because our results are consistent with Tsuji et al. (tsuji97 (1997)) and Hinkle & Barnes (hinkle (1979)), we conclude that they are in an outer atmosphere, i.e. the layer above the photosphere, but below the circumstellar envelope.
Numerical calculations of the atmospheres of Miras (e.g. Bowen bowen (1988); Bessell et al. bessell96 (1996)) show that the pulsation of the star extends the stellar atmosphere. Our observations show that such an extended region could also be present in some SRs and Ls. The dependence of H2O intensity on variable types as seen in Fig. 3 and 5 may result from differences in the physics of pulsation. Not all Ls and SRs show H2O absorption, which is not surprising, because of their complexity (e.g. Jura & Kleinmann jurab (1992)). Using the light curve of V~Hor (Mattei mattei (1998)), we confirm that V~Hor is probably an SR, although it shows a sudden increase of its visual magnitude before the IRTS observation. Unfortunately, no light curve is available for AK~Cap.
Hinkle & Barnes (hinkle (1979)) found that in Miras the H2O in an outer
layer is responsible for the near-IR absorption, and we find
the same situation in some
early M-type stars. If we assume a constant abundance ratio of
H2OH2, then is a measure of the total column
density in the outer layer. Furthermore, is a measure
of the amount of the hot circumstellar dust, if the circumstellar shells of
the stars in Fig. 5 have a similar dust composition.
Therefore, the total column density of the outer layer correlates with the
thickness of the circumstellar shell. This may suggest that the
outer layer influences the mass loss of the star.
In conclusion, we demonstrate that H2O absorption can be seen in early M-type stars, and that the H2O molecules are located in the outer atmosphere. The observed correlation between the intensity of the H2O absorption and the mid-infrared excess implies that the extended atmosphere is connected to the mass loss of the stars.
Acknowledgements.
The authors acknowledge Drs. M. Cohen and M. Noda for their efforts on the NIRS calibration. M.M. thanks the Research Fellowships of the Japan Society for the Promotion of Science for the Young Scientists. I.Y. acknowledges financial support from a NWO PIONIER grant. M.M.F. thanks Dr. H.A. Thronson at NASA Headquarters for discretionary funding, as well as the Center of Excellency of the Japanese Ministry of Education.References
- (1) Abt, H.A., 1988, ApJ 331, 922
- (2) Barlow, M.J., Nguyen-Q-Rieu, Truong-Bach, et al., 1996, A&A 315, L241
- (3) Bessell, M.S., Brett, J.M., 1988, PASP 100, 1134
- (4) Bessell, M.S., Scholz, M., Wood, P.R., 1996, A&A 307, 481
- (5) Bowen, G.H., 1988, ApJ 329, 299
- (6) Freund, M.M., Cohen, M., Matsuura, M., et al., 1997, in Proceedings for ‘Diffuse Infrared Radiation and the IRTS’, ASP Conference Series, vol.124, ed., H. Okuda, T. Matsumoto, T.L. Roellig, p. 67
- (7) Hinkle, K.H., Barnes, T.G., 1979, ApJ 227, 923
- (8) Hoffleit, D., Jaschek, C., 1991, ‘The Bright Star Catalogue 5th ed.’, Yale University Observatory (BSC)
- (9) Hyland, A.R., 1974, Highlights of Astronomy, vol. 3, 307, IAU
- (10) IRAS Catalogs and Atlases: Explanatory Supplement, 1988, ed. Beichman, C.A., Neugebauer, G., Habing, H.J., Clegg, P.E., Chester, T.J., Washington DC.
- (11) IRAS Point Source Catalog, 1988, Joint IRAS Working Group, Washington DC.
- (12) Jura, M., Kleinmann, S.G., 1992, ApJS 83, 329
- (13) Kholopov, P.N., Samus, N.N., Frolov, M.S., et al., 1988, ‘General Catalogue of Variable Stars, 4th Ed.’, Nauka Publishing House (GCVS)
- (14) Kleinmann, S.G., Hall, D.N.B., 1986, ApJS 62, 501
- (15) Lançon, A., Rocca-Volmerange, B., 1992, A&AS 96, 593
- (16) Mattei, J.A., 1998, Observations from the AAVSO International Database, private communication.
- (17) Murakami, H., Freund, M.M., Ganga, K., et al., 1996, PASJ 48, L41
- (18) Partridge, H., and Schwenke, D.W., 1997, J. Chem. Phys. 106, 4618
- (19) Press, W.H., Flannery, B.P., Teukolsky, S.A., Vetterling, W.T., 1986 ‘Numerical Recipes’, University of Cambridge
- (20) Scargle, J.D., Strecker, D.W., 1979, ApJ 228, 838
- (21) Spinrad, H., Wing, R.F., 1969, ARA&A 7, 249
- (22) Stephenson, C.B., 1984, ‘General Catalog of S Stars’, 2nd ed., Publication of Warner & Swasey Observatory
- (23) Stephenson, C.B., 1989, ‘General Catalog of Cool Galactic Carbon Stars’, 2nd ed., Publication of Warner & Swasey Observatory
- (24) Tsuji, T., 1978, A&A 62, 29
- (25) Tsuji, T., Ohnaka K., Aoki, W., Yamamura, I., 1997, A&A 320, L1
- (26) Whitelock, P., Menzies, J., Feast, M., et al., 1994, MNRAS 267, 711
- (27) Yamamura, I., Onaka, T., Tanabé, T., Roellig, T.L., Yuen, L., 1996, PASJ 48, L65