The Type Ia Supernova 1998bu in M96 and the Hubble Constant
Abstract
We present optical and near-infrared photometry and spectroscopy of the type Ia SN 1998bu in the Leo I Group galaxy M96 (NGC 3368). The data set consists of 356 photometric measurements and 29 spectra of SN 1998bu between UT 1998 May 11 and July 15. The well-sampled light curve indicates the supernova reached maximum light in on UT 1998 May 19.3 (JD ) with and . Application of a revised version of the Multicolor Light Curve Shape (MLCS) method yields an extinction toward the supernova of mag, and indicates the supernova was of average luminosity compared to other normal type Ia supernovae. Using the HST Cepheid distance modulus to M96 (Tanvir et al. 1995) and the MLCS fit parameters for the supernova, we derive an extinction-corrected absolute magnitude for SN 1998bu at maximum, . Our independent results for this supernova are consistent with those of Suntzeff et al. (1999). Combining SN 1998bu with three other well-observed local calibrators and 42 supernovae in the Hubble flow yields a Hubble constant, , where the error estimate incorporates possible sources of systematic uncertainty including the calibration of the Cepheid period-luminosity relation, the metallicity dependence of the Cepheid distance scale, and the distance to the LMC.
Subject headings:
distance scale — supernovae: general — supernovae: individual (SN 1998bu)1. Introduction
Type Ia supernovae (SNe Ia) have recently assumed an elite status at the top rung of the cosmic distance ladder. Comprehensive studies of SNe Ia have established their general spectroscopic and photometric homogeneity, along with quantifiable diversity. SNe Ia make reasonably good standard candles (Kowal 1968; Sandage & Tammann 1993; Branch & Miller 1993) and excellent calibrated candles (Phillips 1993; Hamuy et al. 1995, 1996b; Riess, Press, & Kirshner 1995a, 1996a; Tripp 1998; Phillips et al. 1999) which, combined with their high intrinsic luminosity, makes them superb indicators of very large distances and a powerful tool for cosmology (Branch 1998, and references therein).
The downside is that SNe Ia are rare and fleeting, making them more challenging to study than other astronomical distance indicators. Nevertheless, recent applications of these “standard bombs” have been numerous. Within a few hundred Mpc, they have been used to measure the expansion of the Universe: with recession velocities of their host galaxies and distances to individual SNe Ia, the Hubble law has been tested to redshifts at high precision (Hamuy et al. 1996b; Riess, Press, & Kirshner 1996a; Tammann 1998). SNe Ia have also been used to measure peculiar motions of galaxies and large scale flows (Tammann & Leibundgut 1990; Miller & Branch 1992; Jerjen & Tammann 1993; Riess, Press, & Kirshner 1995b; Riess et al. 1997a; Zehavi et al. 1998; Tammann 1998) as well as to provide constraints on the properties of extragalactic dust (Riess, Press, & Kirshner 1996b). At larger distances, SNe Ia serve as standard clocks: cosmological time dilation has been demonstrated by comparing light curves of distant supernovae with light curves from those nearby (Leibundgut et al. 1996; Goldhaber et al. 1997), as well as from the relative rates of spectral evolution (Riess et al. 1997b). Most recently, SNe Ia have been used to measure luminosity distances at high redshift (), from which the geometry and expansion history of the Universe can be determined (Nrgaard-Nielsen et al. 1989; Perlmutter et al. 1995; Schmidt et al. 1998). These measurements have likely tolled the death knell of standard () cold dark matter (CDM) cosmology, strongly disfavoring the possibility of enough gravitating matter to flatten the Universe (Perlmutter et al. 1998; Garnavich et al. 1998a). Even more surprisingly, preliminary indications show that the expansion is accelerating at the current epoch (Riess et al. 1998a; Perlmutter et al. 1999), inconsistent with the idea that ordinary matter is the dominant component of the Universe’s energy density. Alternatives such as a cosmological constant, or other forms of energy density similar to it, seem to be favored (Garnavich et al. 1998b; Perlmutter et al. 1999). Combined with constraints from the cosmic microwave background anisotropy power spectrum, the supernovae have also given preliminary indications for a Universe with zero global curvature (Garnavich et al. 1998b; White 1998; Lineweaver 1998; Tegmark 1999; Efstathiou et al. 1999; Perlmutter, Turner, & White 1999; Roos & Harun-or-Rashid 1999).
These studies rely on SNe Ia only as bright, precise, relative distance indicators. However, the determination of the expansion rate of the Universe, the Hubble constant, and the age of the Universe require an accurate absolute distance scale. Measuring absolute distances to SNe Ia requires calibrating them through objects on lower rungs of the distance ladder. The best distance indicator for this remains what it has been since the days of Hubble himself: Cephei variable stars. Cepheids are bright enough to be studied in nearby galaxies, including those which have hosted SNe Ia. In addition they can be found in significant numbers, which allows for a precise mean period-luminosity (PL) relation to be constructed and compared to nearby samples. In general Cepheids in external galaxies are compared to Cepheids in the Large Magellanic Cloud (LMC), whose distance is calibrated through a variety of means (not always with the same result, cf. Section 5.2.3). The importance of Cepheids to calibrate secondary distance indicators (including SNe Ia) prompted the creation of the Hubble Space Telescope (HST) Key Project on the Extragalactic Distance Scale, which has measured Cepheid distances to a number of nearby galaxies (Freedman et al. 1994, 1998 and references therein). Another HST effort has been underway to measure Cepheid distances to galaxies that have hosted SNe Ia, to calibrate them specifically (Sandage et al. 1992; Saha et al. 1997, and references therein). At present the use of SNe Ia to measure the Hubble constant is limited by the paucity of local calibrators, not by the number or precision of distances to objects in the Hubble flow.
Nature has been kind by providing us with SN 1998bu in the Leo I Group galaxy M96 (NGC 3368), for which a Cepheid distance had already been obtained with HST by a third group, Tanvir et al. (1995). In this paper we calibrate the absolute magnitude of SN 1998bu through extensive optical and near-infrared photometry and spectroscopy. In §2 we describe our observations and reduction procedure. In §3 we derive parameters of SN 1998bu, including the extinction along the line of sight as well as a quantitative estimate of the intrinsic luminosity of SN 1998bu compared to other SNe Ia. In §4 we combine the properties of SN 1998bu with other Cepheid-calibrated SNe Ia and SNe Ia in the Hubble flow to determine the Hubble constant () and its statistical uncertainty. We discuss our results, sources of systematic error, and implications for the age of the Universe, , in §5. Finally, we conclude and summarize in §6. Independent observations and analysis of SN 1998bu have been performed by Suntzeff et al. (1999), and we compare our analysis and results with theirs throughout the paper. Infrared and optical spectra and uncalibrated light curves of SN 1998bu have also been presented by Meikle & Hernandez (1999).
2. Observations and Analysis
2.1. Discovery
SN 1998bu was discovered by the amateur astronomer M. Villi on UT 1998 May 9.9 on CCD images of M96 (Villi 1998). The supernova was located at , (equinox 2000.0), about one arcminute north of the host galaxy nucleus (Nakano & Aoki 1998). At the Center for Astrophysics we monitor new, bright supernovae spectroscopically with the Center for Astrophysics F. L. Whipple Observatory (FLWO) 1.5-m Tillinghast reflector and FAST spectrograph (Fabricant et al. 1998), and photometrically with the FLWO 1.2-m reflector in optical and near-infrared passbands. Our photometric observations of SN 1998bu with the 1.2-m began on May 11.1, with the new STELIRCAM near-infrared InSb array detector. The discovery of SN 1998bu ocurred during lunar bright time, and so the 1.5-m telescope was not equipped with the FAST instrument until May 15.
High resolution spectra taken by Munari et al. (1998) with the Asiago Observatory 1.8-m telescope showed interstellar Na I D absorption from our Galaxy, as well as from M96 at a heliocentric radial velocity of . Low-disperson spectra of SN 1998bu were taken by Meikle et al. (1998) on May 12.9 and Ayani, Nakatani & Yamaoka (1998) on May 14.5, which revealed the supernova to be of type Ia about a week before maximum light. Our first spectroscopic observations of SN 1998bu with the FLWO 1.5-m were taken on May 16.1.
A type Ia supernova in a galaxy whose Cepheid distance had already been measured by HST (Tanvir et al. 1995) provided a unique opportunity; it was the opposite of the usual case, in which an HST Cepheid distance to a galaxy is measured specifically because the galaxy was an SN Ia host. Well-measured light curves are the key to SN Ia distances, so we undertook extensive photometric observations in the passbands.
2.2. Optical Photometry
The plurality of our optical photometric observations (29 nights) was obtained with the FLWO 1.2-m telescope + “4Shooter” CCD mosaic camera (Szentgyorgyi et al. 1999). The 4Shooter consists of a 2x2 array of thinned, back-side illuminated, anti-reflective coated Loral CCD detectors, situated at the f/8 Cassegrain focus. The pixel size is 15 µm, yielding a scale of per pixel at the focal plane and a field of view of approximately on a side for each chip, with total sky coverage of 0.15 deg2. Our observations were taken in a 2x2 binned mode, so that the resulting images were sampled at per pixel, well matched to the typical seeing (15- FWHM) achieved at this telescope. All observations of SN 1998bu with the mosaic were made on the same CCD (chip 1), which has the best combination of cosmetic characteristics and quantum efficiency. Two nights of observations were obtained on this telescope with the “AndyCam” instrument, a CCD camera with a single CCD, very similar to those that make up the 4Shooter. Both instruments have good ultraviolet and near-infrared response, which enabled us to make observations in the Johnson and Kron-Cousins bandpasses. Our optical filters are constructed from Schott glass components, as recommended by Bessell (1990) for coated CCDs. The FLWO filter prescriptions are described by Riess et al. (1999); in general they match well the prescriptions of Bessell (1990), though the FLWO filter extends to somewhat longer wavelengths. The FLWO filter transmission is also a good match to the Bessell (1990) UX specification.
Our FLWO 1.2-m observations of SN 1998bu are part of an ongoing supernova monitoring program at CfA. Supernova observations are not well suited to the scheduled time allocation procedure that is typical at most telescopes. To follow supernovae, the time allocation committee authorizes us to enlist the generous aid of the scheduled observers, asking them to devote a small fraction of observing time (usually limited to minutes per night) to the SN program. We complement the monitoring observations with scheduled nights (usually one night per month) to measure fainter objects and perform photometric calibrations. We have been quite successful observing in this mode; a set of 22 SNe Ia light curves garnered as a result of this program has been presented by Riess et al. (1999).
The FLWO 1.2-m is equipped with an infrared instrument during bright time, which provides useful IR supernova data (obtained in a similar observing mode), at the price of bright-time gaps in our optical light curves. For this object we made a special effort to minimize these gaps by inviting observers at other institutions to participate. Six epochs of optical photometric observations in were taken at the Michigan-Dartmouth-MIT (MDM) Observatory 2.4-m Hiltner telescope and direct imager, with the thinned, back-illuminated, 10242 “Charlotte” CCD detector, located at the f/7.5 Cassegrain focus and providing a field-of-view at per pixel. Further observations on two nights were obtained at the Kitt Peak National Observatory (KPNO) 0.9-m telescope, with the T2KA (20482) CCD detector at the f/7.5 Cassegrain focus, yielding a field-of-view at per pixel. Target of opportunity observations were also carried out on five nights during NOAO time at the WIYN Observatory 3.5-m telescope with the S2KB (20482) CCD Imager at f/6.3 with per pixel and a field-of-view.
Other sites also observed SN 1998bu and we report those data as well. We include CCD data from the Whitin Observatory 0.6-m telescope at Wellesley College (eight nights using a 10242 CCD at f/13.5, with a scale of per pixel), the Gettysburg College Observatory 0.4-m (twelve nights using a 10242 CCD at f/11, per pixel) and the 0.76-m Katzman Automatic Imaging Telescope (KAIT) at Lick Observatory run by the University of California, Berkeley (fifteen nights with a 5122 CCD at f/8.2, per pixel). The detectors used in these observations were not as blue-sensitive as the others, so only images were taken. Our observations of SN 1998bu continued until July 2 when it was too close to the setting sun to provide good photometric data. In total our optical photometric data set consists of 327 measurements of SN 1998bu.
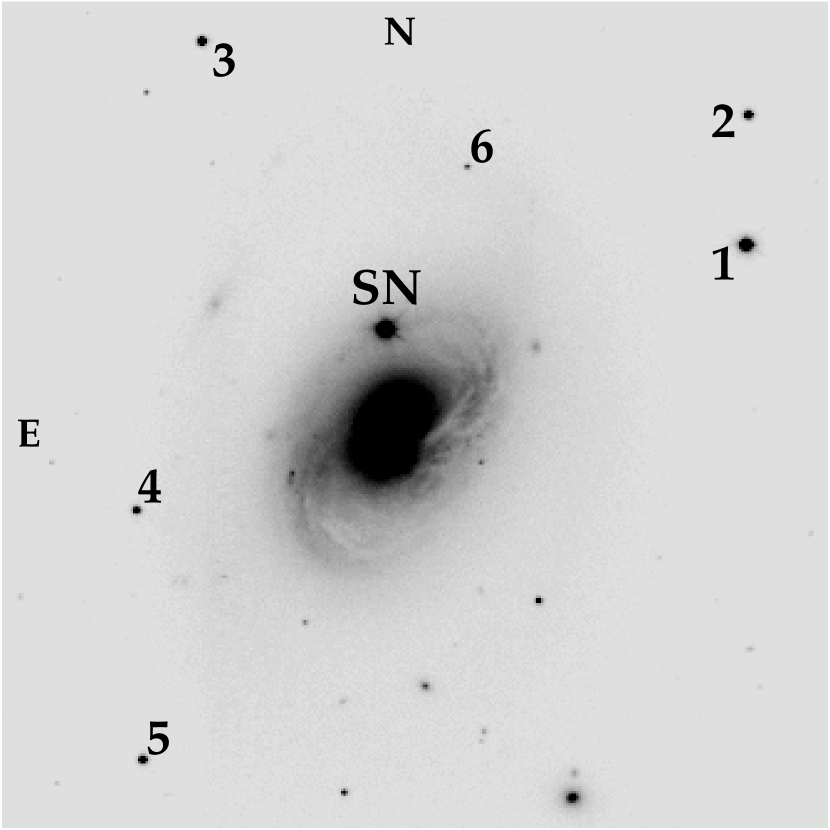
All CCD observations were reduced (uniformly, beginning with the raw data) in the standard fashion, with bias subtraction, dark current subtraction (not necessary in most cases) and flat-field correction using the IRAF CCDPROC package. Most of the observations were taken in non-photometric conditions, so we have performed differential photometry with a sequence of six comparison stars in the supernova field, shown in Fig. 1. Comparison stars 1 and 2 were calibrated on four photometric nights (two from the FLWO 1.2-m, one each from the MDM 2.4-m and Kitt Peak 0.9-m). Stars 3, 4 and 5 were not in the MDM field of view, so these were calibrated from three nights. To calibrate the comparison stars into a local standard star sequence, Landolt (1992) standard fields providing stars in a wide range of color were observed in over a wide range in airmass. The supernova field was also observed in these filters at an airmass within the airmass range of the standard star observations. These data were reduced and stellar instrumental magnitudes were determined from aperture photometry using the APPHOT package in IRAF. We then derived zero points and transformation coefficients linear in airmass and color from the standard stars using the prescription of Harris, Fitzgerald, & Reed (1981). This transformation was then applied to the comparison star instrumental magnitudes to determine their standard magnitudes. We treated observations from each photometric night independently, and averaged the final standard magnitudes. Table 1 displays these mean standard magnitudes, along with the error in the mean determined from the scatter of repeat observations. We also list the comparison star identification numbers from Suntzeff et al. (1999). Our independent photometry of the comparison stars agrees well with their results.
| Star | ||||||||
|---|---|---|---|---|---|---|---|---|
| 1 (S6) | 13.521(0.027) | 13.594(0.012) | 13.068(0.009) | 12.774(0.012) | 12.475(0.011) | 12.02(0.05) | 11.85(0.03) | 11.77(0.03) |
| 2 (S7) | 15.437(0.029) | 15.551(0.015) | 15.016(0.013) | 14.715(0.015) | 14.403(0.015) | |||
| 3 (S1) | 15.523(0.035) | 15.520(0.018) | 14.895(0.017) | 14.553(0.019) | 14.199(0.019) | |||
| 4 (S2) | 16.501(0.040) | 16.495(0.027) | 15.789(0.024) | 15.384(0.026) | 14.971(0.025) | |||
| 5 (S8) | 16.778(0.039) | 16.280(0.025) | 15.441(0.024) | 14.987(0.027) | 14.573(0.025) | |||
| 6 (S12) | 19.210(0.042) | 17.730(0.031) | 16.805(0.040) | 15.583(0.033) | 14.36(0.05) | 13.75(0.04) | 13.54(0.03) |
Note. — The S identifiers are from Suntzeff et al. (1999). Uncertainties in the magnitudes are listed in parentheses.
To measure the brightness of SN 1998bu, we performed aperture photometry of the supernova and comparison stars on each image. We derived an aperture correction determined from one or a few isolated bright stars measured through circular apertures of varying radii (with sky measurements in a surrounding annulus). We were thus able to measure the supernova light through a small aperture, so that noise from the background sky would be minimized. Due to the varying seeing and pixel scales at the sites, we did not impose a fixed angular size aperture for all the observations. In all cases, though, the aperture for the supernova instrumental magnitudes was the same size as the aperture for the comparison stars in the field. We chose aperture photometry over point-spread-function (PSF) fitting primarily out of convenience, but also because in many instances the fields were too small or the exposures too short to reliably determine the PSF from nearby stars.
We also determined the linear color transformation coefficients for each telescope/instrument/filter combination. At sites which had photometric conditions, these were the same as those used in determining comparison star magnitudes. For the other sites, color terms were determined from observations of either Landolt fields or other standard star fields but allowing for a varying zero point to account for the non-photometric conditions. The transformation coefficients were also checked with the local comparison stars. Color terms for each telescope/filter combination are listed in Table 2. Uncertainties in the transformation coefficients were propagated to the error estimate in the final photometry.
| Telescope | |||||
|---|---|---|---|---|---|
| CfA4 | 0.935 | 0.887 | 0.973 | 1.086 | +0.041 |
| CfA1 | 0.926 | 0.939 | 0.982 | 1.068 | +0.027 |
| MDM | 0.782 | 1.061 | 0.981aaThe MDM -band photometry was not used; see text for details. | 1.027 | +0.019 |
| KP09 | 0.907 | 0.912 | 1.005 | 1.027 | +0.009 |
| WIYN | 1.140 | 0.974 | 1.060 | 1.100 | +0.019 |
| Gett | 0.549bbAs described in the text, we have not used a linear transformation to place Gettysburg and Wellesley -band supernova photometry onto the standard system. | 0.894 | 1.006 | +0.009 | |
| Well | 0.658bbAs described in the text, we have not used a linear transformation to place Gettysburg and Wellesley -band supernova photometry onto the standard system. | 0.980 | 1.099 | +0.030 | |
| KAIT | 0.929 | 1.190 | 1.082 | +0.001 |
Note. — The telescope designations are: CfA4, FLWO 1.2-m with 4Shooter; CfA1, FLWO 1.2-m with AndyCam; MDM, MDM Hiltner 2.4-m; KP09, KPNO 0.9-m; WIYN, WIYN 3.5-m; Gett, Gettysburg 0.4-m; Well, Wellesley 0.6-m; and KAIT, KAIT 0.76-m. The tabulated values for the color columns (, , , ) are the transformation coeffiencents from the standard color to the instrumental color, e.g., CfA4: . The tabulated values for the last column are transformation coefficients from to the instrumental magnitude, e.g., CfA4: .
Since our observations of SN 1998bu used local standard stars at the same airmass as the supernova, no airmass correction was necessary for the differential photometry. By using the measured color terms, we only had to determine the zero point of each frame, by solving for the offset between the comparison star color-corrected instrumental magnitudes and their standard magnitudes. The zero point was determined from the flux-weighted combination of all available comparison stars. The scatter in the comparison star magnitudes (typically mag) was used as an estimate of the internal error in determining the zero point. From the derived zero point and color transformation coefficient, we were then able to transform the supernova instrumental magnitude into a standard magnitude.
This procedure was quite effective in the majority of cases. However, supernova photometry requires special care. Where the color terms are large (due to a mismatch between the filter/detector response and a standard Landolt response), the use of a linear color correction can be insufficient. This problem is especially acute in supernova photometry because of deep, wide features in the spectra of supernovae. Even when a large color correction works well when applied to stars (i.e., yields very small differences with standard magnitudes), such large corrections may not be appropriate to supernovae. In most cases, filters were well-matched and the derived color corrections were small, so nothing more complicated was required. However, in two data sets (the Gettysburg and Wellesley filters), the color-corrected supernova magnitudes were significantly discrepant with other data. In both of these cases the color terms were quite large. To combat this problem, we determined a correction based on the filter transmission and detector sensitivity functions from these two sites. We used these response functions with spectrophotometric observations of a number of SNe Ia at varying ages, and determined magnitude corrections relative to the standard passband defined by Bessell (1990). This procedure mirrors the use of K-corrections for high-redshift supernovae (Kim, Goobar, & Perlmutter 1996; Schmidt et al. 1998). Combining these corrections (usually to mag) with zero points determined from the comparison stars brought these two data sets into good accord with the others, though the photometry has signficantly higher uncertainty (typically mag).
In addition, we encountered a puzzle in the MDM -band data, which was discrepantly bright (by mag) compared to data from four other telescopes at nearly the same epoch. However, in this case, the derived color term was not very large. We were unable to procure the filter and detector characteristics for this data set. Thus we cannot provide an adequate explanation for this anomaly; it is possible that the filter transmission is mismatched just such that a color term derived from stellar observations (which were somewhat limited in color) would be small (e.g., high transmission at some wavelengths compensated by low transmission at others), while the supernova spectrum at the epoch of the observations led to a discrepant magnitude. Since four other telescopes provided mutually consistent observations at the same epoch, we have disregarded the MDM data. We were fortunate to possess contemporaneous observations so that we could discover this discrepancy, and it illustrates the need for a careful investigation of filter and detector characteristics when combining observations of supernovae made at various sites (Suntzeff et al. 1999; Wells et al. 1994).
A futher complication in supernova photometry is proper discrimination between light from the supernova and light from the underlying galaxy (Boisseau & Wheeler 1991). Accurate subtraction of the galaxy background is essential to measure correct magnitudes, and even more important in measuring light curves, as a constant unremoved galaxy background will cause a supernova light curve to look more shallow (i.e., mimic a slower decline rate). Though SN 1998bu is projected on a spiral arm of M96, the background from the galaxy is relatively faint. We were fortunate to possess images of M96 prior to the appearance of SN 1998bu, taken with the FLWO 1.2-m for another program. Our original plan was to use this image as a template and apply the galaxy subtraction techniques described by Schmidt et al. (1998; see also Filippenko et al. 1986). This was very successful in a few cases, but it turned out that the template image quality was much poorer (due to seeing and the pixel scale) than
| Julian Day | Telescope | |||||
|---|---|---|---|---|---|---|
| 2450944.68 | 12.45(0.14) | 12.23(0.10) | 11.95(0.15) | KAIT | ||
| 2450947.63 | 12.47(0.11) | 12.15(0.02) | 11.86(0.04) | 11.72(0.04) | Gett | |
| 2450948.59 | 12.08(0.02) | 11.80(0.04) | 11.68(0.04) | Well | ||
| 2450948.65 | 12.41(0.09) | 12.09(0.02) | 11.80(0.04) | 11.70(0.04) | Gett | |
| 2450949.67 | 11.99(0.03) | 11.74(0.05) | 11.67(0.06) | Gett | ||
| 2450949.67 | 11.96(0.04) | 12.29(0.02) | 11.98(0.01) | 11.72(0.03) | 11.63(0.03) | CfA4 |
| 2450951.58 | 12.28(0.07) | 11.90(0.02) | 11.71(0.04) | 11.68(0.04) | Well | |
| 2450951.63 | 11.93(0.03) | 11.72(0.04) | 11.67(0.04) | Gett | ||
| 2450951.67 | 11.91(0.03) | 11.80(0.09) | KAIT | |||
| 2450951.68 | 12.21(0.02) | 11.90(0.01) | 11.68(0.03) | 11.66(0.03) | CfA4 | |
| 2450952.62 | 12.29(0.07) | 11.87(0.02) | 11.70(0.04) | 11.70(0.04) | Well | |
| 2450952.64 | 11.88(0.02) | 11.71(0.05) | 11.74(0.05) | Gett | ||
| 2450952.66 | 12.00(0.05) | 12.21(0.02) | 11.86(0.01) | 11.66(0.03) | 11.71(0.03) | CfA4 |
| 2450952.67 | 11.85(0.03) | 11.75(0.09) | 11.69(0.06) | KAIT | ||
| 2450953.63 | 12.34(0.11) | Gett | ||||
| 2450953.70 | 12.03(0.05) | 12.24(0.02) | 11.87(0.01) | 11.66(0.03) | 11.73(0.03) | CfA4 |
| 2450955.64 | 12.14(0.05) | 12.28(0.02) | 11.86(0.01) | 11.65(0.03) | 11.79(0.03) | CfA4 |
| 2450955.66 | 12.26(0.11) | 11.88(0.02) | 11.66(0.04) | 11.80(0.05) | Gett | |
| 2450955.68 | 11.85(0.03) | 11.82(0.06) | KAIT | |||
| 2450956.59 | 12.35(0.07) | 11.90(0.02) | 11.71(0.04) | 11.83(0.04) | Well | |
| 2450956.64 | 12.23(0.04) | 12.32(0.02) | 11.87(0.01) | 11.67(0.03) | 11.80(0.03) | CfA4 |
| 2450956.68 | 11.89(0.03) | 11.79(0.09) | 11.84(0.06) | KAIT | ||
| 2450957.63 | 12.31(0.05) | 12.36(0.02) | 11.92(0.01) | 11.72(0.03) | 11.87(0.03) | CfA4 |
| 2450957.65 | 12.34(0.11) | 11.96(0.03) | 11.75(0.05) | 11.88(0.05) | Gett | |
| 2450959.68 | 12.48(0.04) | 12.50(0.02) | 12.01(0.01) | 11.82(0.03) | 11.98(0.03) | CfA1 |
| 2450960.57 | 12.57(0.07) | 12.02(0.02) | 11.91(0.04) | 12.04(0.04) | Well | |
| 2450960.69 | 12.61(0.05) | 12.56(0.02) | 12.04(0.01) | 11.89(0.03) | 12.05(0.03) | CfA1 |
| 2450961.57 | 12.74(0.11) | 12.12(0.03) | 12.02(0.05) | Gett | ||
| 2450961.60 | 12.64(0.07) | 12.07(0.02) | 11.99(0.04) | 12.10(0.04) | Well | |
| 2450962.66 | 12.76(0.05) | 12.70(0.02) | 12.12(0.01) | 12.05(0.03) | 12.21(0.03) | CfA4 |
| 2450963.64 | 12.86(0.05) | 12.81(0.03) | 12.21(0.02) | 12.15(0.03) | 12.26(0.04) | CfA4 |
| 2450963.68 | 12.88(0.05) | 12.26(0.02) | 12.28(0.06) | 12.30(0.04) | KAIT | |
| 2450964.63 | 13.01(0.05) | 12.94(0.03) | 12.28(0.01) | 12.21(0.03) | 12.30(0.03) | CfA4 |
| 2450964.68 | 12.97(0.05) | 12.34(0.02) | 12.32(0.04) | KAIT | ||
| 2450965.64 | 13.14(0.05) | 13.03(0.02) | 12.35(0.01) | 12.29(0.03) | 12.31(0.03) | CfA4 |
| 2450965.67 | 13.05(0.03) | 12.42(0.02) | 12.33(0.04) | WIYN | ||
| 2450966.60 | 13.10(0.07) | 12.42(0.02) | 12.35(0.04) | 12.29(0.04) | Well | |
| 2450967.65 | 13.45(0.05) | 13.24(0.02) | 12.48(0.01) | CfA4 | ||
| 2450967.66 | 13.35(0.05) | 13.24(0.02) | 12.50(0.01) | 12.35(0.03) | MDM | |
| 2450968.67 | 13.53(0.04) | 13.40(0.02) | 12.59(0.01) | 12.46(0.03) | 12.33(0.03) | KP09 |
| 2450968.68 | 13.50(0.04) | 13.36(0.02) | 12.55(0.01) | 12.33(0.03) | MDM | |
| 2450968.72 | 13.60(0.05) | 13.43(0.03) | 12.62(0.02) | 12.48(0.03) | 12.31(0.03) | WIYN |
| 2450969.59 | 13.51(0.11) | 12.62(0.02) | 12.43(0.05) | 12.26(0.04) | Gett | |
| 2450969.60 | 13.40(0.07) | 12.61(0.02) | 12.43(0.04) | 12.25(0.04) | Well | |
| 2450969.65 | 13.68(0.04) | 13.51(0.02) | 12.64(0.01) | 12.47(0.03) | 12.31(0.03) | KP09 |
| 2450969.67 | 13.75(0.05) | 13.52(0.03) | 12.66(0.02) | 12.50(0.03) | 12.30(0.03) | WIYN |
| 2450969.69 | 13.53(0.05) | 12.66(0.02) | 12.50(0.06) | 12.32(0.06) | KAIT | |
| 2450969.69 | 13.66(0.04) | 13.47(0.02) | 12.59(0.01) | 12.28(0.03) | MDM | |
| 2450970.69 | 13.82(0.05) | 13.59(0.02) | 12.64(0.01) | 12.25(0.03) | MDM | |
| 2450971.71 | 13.97(0.05) | 13.72(0.02) | 12.69(0.01) | 12.23(0.03) | MDM | |
| 2450972.65 | 14.12(0.04) | 13.84(0.02) | 12.74(0.01) | 12.20(0.03) | MDM | |
| 2450972.68 | 14.16(0.04) | 13.89(0.02) | 12.80(0.01) | 12.52(0.03) | 12.22(0.03) | WIYN |
| 2450973.58 | 13.95(0.11) | 12.80(0.02) | 12.45(0.05) | 12.16(0.04) | Gett | |
| 2450973.68 | 14.01(0.05) | 12.54(0.06) | 12.22(0.04) | KAIT | ||
| 2450974.67 | 14.45(0.05) | 14.11(0.03) | 12.87(0.02) | 12.51(0.04) | 12.19(0.04) | WIYN |
| 2450978.69 | 14.51(0.06) | 13.09(0.02) | 12.61(0.06) | 12.12(0.05) | KAIT | |
| 2450979.70 | 14.60(0.06) | 13.14(0.03) | 12.64(0.06) | 12.14(0.05) | KAIT | |
| 2450980.65 | 15.15(0.04) | 14.68(0.02) | 13.16(0.01) | 12.61(0.03) | 12.08(0.03) | CfA4 |
| 2450981.66 | 15.22(0.04) | 14.74(0.02) | 13.25(0.01) | 12.69(0.03) | 12.12(0.03) | CfA4 |
| 2450981.69 | 14.74(0.06) | 13.24(0.03) | 12.71(0.07) | 12.14(0.05) | KAIT | |
| 2450982.60 | 13.30(0.03) | 12.79(0.06) | 12.13(0.05) | Gett | ||
| 2450982.65 | 15.29(0.05) | 14.81(0.02) | 13.30(0.02) | 12.75(0.03) | 12.16(0.03) | CfA4 |
| 2450982.70 | 14.84(0.06) | 13.36(0.02) | 12.83(0.06) | 12.24(0.04) | KAIT | |
| 2450983.66 | 15.31(0.05) | 14.89(0.02) | 13.38(0.01) | 12.83(0.03) | 12.24(0.03) | CfA4 |
| 2450984.67 | 15.39(0.04) | 14.94(0.02) | 13.45(0.01) | 12.92(0.03) | 12.33(0.03) | CfA4 |
| 2450984.70 | 14.95(0.05) | 13.51(0.02) | 13.00(0.06) | KAIT | ||
| 2450985.65 | 15.00(0.02) | 13.53(0.01) | 13.03(0.04) | 12.42(0.03) | CfA4 | |
| 2450986.66 | 15.48(0.05) | 15.05(0.02) | 13.56(0.01) | 13.08(0.03) | 12.47(0.03) | CfA4 |
| 2450986.69 | 15.09(0.05) | 13.13(0.06) | KAIT | |||
| 2450987.66 | 15.50(0.04) | 15.09(0.02) | 13.63(0.01) | 13.12(0.03) | 12.55(0.03) | CfA4 |
| 2450988.66 | 15.53(0.04) | 15.12(0.02) | 13.67(0.01) | 13.18(0.03) | 12.63(0.03) | CfA4 |
| 2450989.65 | 15.58(0.04) | 15.18(0.02) | 13.72(0.01) | 13.24(0.03) | 12.68(0.03) | CfA4 |
| 2450990.65 | 15.61(0.05) | 15.21(0.02) | 13.77(0.01) | 13.28(0.03) | 12.75(0.03) | CfA4 |
| 2450990.69 | 15.22(0.05) | 13.82(0.02) | 13.34(0.06) | 12.80(0.05) | KAIT | |
| 2450991.65 | 15.62(0.05) | 15.22(0.02) | 13.82(0.01) | 13.31(0.03) | 12.81(0.03) | CfA4 |
| 2450992.64 | 15.64(0.04) | 15.24(0.02) | 13.84(0.01) | 13.38(0.03) | 12.86(0.03) | CfA4 |
| 2450993.64 | 15.62(0.06) | 15.26(0.03) | 13.88(0.02) | 13.42(0.03) | 12.91(0.03) | CfA4 |
| 2450994.64 | 15.69(0.05) | 15.29(0.02) | 13.92(0.01) | 12.97(0.03) | CfA4 | |
| 2450995.64 | 15.69(0.04) | 15.31(0.02) | 13.96(0.01) | 13.49(0.03) | 13.04(0.03) | CfA4 |
| 2450996.64 | 13.97(0.01) | 13.09(0.03) | CfA4 |
Note. — The telescope designations are as in Table 2.
many of our observations, and degrading the supernova observations to match the template added undesirable correlated noise. In additional cases the observed fields did not align well with the template image (because there were very few stars in some of the small-field observations). Instead we estimated the galaxy background flux directly from the template image (using an aperture and sky annulus appropriate to each observation) and subtracted this flux from that of the supernova. The correction to the supernova magnitude was initially negligibly small and grew larger as the supernova faded, but the maximum correction made was only 0.025 mag. Our prediscovery images justify the assumption of a small host-galaxy flux contribution made by Suntzeff et al. (1999). Our final photometry for SN 1998bu is listed in Table 3 and the optical light curves are shown in Figure 2.

2.3. Infrared Photometry
Infrared photometry of SN 1998bu in the passbands was obtained at the Fred L. Whipple Observatory (FLWO), the Mount Stromlo Observatory (MSO), the Infrared Telescope Facility (IRTF), and with the ESO New Technology Telescope (NTT). The FLWO data were obtained with the 1.2-m telescope and “STELIRCam” IR camera which consists of two 2562 InSb detector arrays permitting simultaneous imaging in two filters (Tollestrup et al. 1999). The FLWO filters were manufactured by Barr Associates in 1987 for a number of institutions including NOAO. The MSO data was taken with the 2.3-m telescope and CASPIR Spectrograph/Imager which uses a 2562 InSb detector. The IRTF data was obtained with the NASA 3-m telescope and NSFCAM IR camera which uses a 2562 InSb detector. The NTT is a 3.5-m aperture telescope and observations were made using the SOFI imaging spectrograph which employs a 10242 HgCdTe array.
Flat fields and sky frames were created using offset field images staggered between the supernova exposures. The alternating offset field frames were subtracted from the corresponding data images and then divided by the normalized, average flat field. Standard stars for the FLWO observations were taken from Elias et al. (1982), while the NTT used standards from Persson et al. (1998), and the IRTF used the UKIRT faint standards (Hunt et al. 1998). The MSO data was calibrated with standards from Carter & Meadows (1995). Where possible, the results were transformed to the Elias system, but the variety of detectors, filters and standards introduces systematic errors on the order of 0.05 mag. Two stars (stars 1 and 6) near the supernova were calibrated from the FLWO data and used as secondary standards on non-photometric nights; their magnitudes are listed in Table 1. The galaxy background at the position of the supernova is smooth and much fainter than the supernova light, so that aperture photometry was sufficient. The resulting supernova photometry is given in Table 4 and displayed in Figure 3.
| Julian Day | Telescope | |||
|---|---|---|---|---|
| 2450945.6 | 11.76(0.06) | 11.88(0.06) | 11.81(0.05) | FLWO |
| 2450948.6 | 11.59(0.06) | 11.77(0.06) | 11.59(0.05) | FLWO |
| 2450951.88 | 11.66(0.04) | 11.84(0.04) | 11.60(0.03) | IRTF |
| 2450970.7 | 13.32(0.06) | 11.94(0.05) | 11.95(0.05) | FLWO |
| 2450974.91 | 13.23(0.06) | 11.68(0.06) | 11.89(0.05) | MSO |
| 2450975.97 | 13.12(0.04) | 11.79(0.03) | 11.77(0.03) | ESO |
| 2450976.88 | 13.08(0.06) | 11.65(0.06) | 11.77(0.05) | MSO |
| 2450978.65 | 12.81(0.06) | 11.73(0.06) | 11.74(0.05) | FLWO |
| 2450978.87 | 11.67(0.10) | 11.77(0.10) | MSO | |
| 2450984.76 | 12.68(0.05) | 12.00(0.03) | 12.05(0.04) | IRTF |

2.4. Optical Spectroscopy
All of our optical spectroscopic observations were obtained at the FLWO 1.5-m telescope with the FAST spectrograph. This long-slit spectrograph has been designed for high throughput and features a thinned, back-side illuminated, anti-reflection coated CCD detector. The slit length is and can be adjusted to several widths; we have generally employed a slit for our observations. These were made using a 300 line/mm grating which results in a resolution of roughly 0.6 nm and a usable wavelength range from 360 to 720 nm. We began observations of SN 1998bu on May 16.1 and continued through July 15.1, on a total of 27 nights.
We have reduced the spectra in the standard manner with IRAF. The two-dimensional CCD exposures were corrected for bias and dark-current and were flat-fielded using CCDPROC. A 1D spectrum was extracted at the supernova position subtracting the neigboring sky using the APEXTRACT task. Wavelength calibration was performed by extracting the same aperture from an exposure of a HeNeAr lamp taken just after the supernova observation and identifying emission lines. We also performed flux calibration through the reduction of a spectrophotometric standard star each night (Massey et al. 1988). The conditions for the supernova observations were usually not photometric, so the absolute flux calibration is generally unreliable. The relative flux measurement may also suffer because of differential refraction (Filippenko 1982), as the slit was always oriented east-west (PA ) rather than being optimally oriented at the parallactic angle. In general, then, our spectra likely underestimate the flux in the blue by 10 to 20%. In addition, since we have not used a blocking filter, second-order light contaminates the red end of the spectra. The supernova flux in the blue is generally lower than in the red and the detector sensitivity to the blue photons is also low, so that the second-order contamination is on the order of only a few percent. Second order contamination in the standard star spectra is more significant (since the standard stars are typically quite blue), so that the flux calibration in the red is also somewhat uncertain. Uncertainties in the flux calibration in both the blue and the red thus make these spectra unsuitable for spectrophotometry. Contamination of the supernova spectra by underlying galaxy light (after subtracting the local sky) was small, as in the case of the optical photometry. In some cases, multiple observations on the same night were combined into one. Cosmic rays and telluric lines were removed by hand. Figure 4 shows a representative subset of our optical spectroscopy of SN 1998bu and the spectral evolution of the supernova covering 60 days, from approximately 3 days before maximum light in the band. The complete spectroscopic data set is available upon request.

2.5. Infrared Spectroscopy
Infrared spectra of SN 1998bu were obtained with the KPNO 4-m telescope and OSU-NOAO Infrared Imager (ONIS) on 1998 June 14.2 UT. The ONIS covered the -band range from 2.0 m to 2.4 m with a resolution of 1.6 nm (FWHM). A sequence of two-minute exposures was made, while stepping the target along the slit. These were combined for a total integration of 24 minutes. A spectrum of the F5V star BS 4281 was divided into the supernova spectrum to remove telluric absorption (except in the deep absorption bands at 1.4 and 1.9 m). A smooth spectrum of an F5V star was created by interpolating the broad band colors (Johnson et al. 1968), with the zero point set by the catalog magnitude of BS 4281. Multiplying the supernova spectrum and the synthetic F5V star spectrum corrects for the detector sensitivity variations and roughly calibrates supernova flux. The spectral flux was then adjusted to match the observed -band photometric magnitude of the supernova interpolated to the date of the spectrum.
A spectrum was also taken with the SOFI instrument on the ESO NTT on 1998 June 11.0 UT. SOFI covered 0.95 m to 2.5 m in two grating settings with significant overlap. Four 120-s exposures were obtained at each tilt at four slit positions allowing good sky subtraction. Spectra of HD177619 (an F7V star) were used to remove telluric bands and calibrate the relative sensitivity of the detector as described above. Absolute flux calibration was done using the -band magnitude determined from SOFI imaging done on the same night.
The KPNO and ESO spectra were combined into a single high-quality spectrum of SN 1998bu at an age of about +25 days which is shown in Figure 5. There are few good infrared spectra of SNe Ia at the same epoch to compare with these data; however, a spectrum of SN 1995D taken with the MMT+FSPEC at an age of +24 days is also shown for comparison.

3. Results
3.1. Spectra
Type I supernovae are distinguished from those of type II by the absence of hydrogen in their spectra, and SNe Ia are further distinguished from SNe Ib and SNe Ic by the prominent Si II (635.5 nm) absorption at maximum light (for examples and a detailed discussion see Filippenko 1997). Other absorption features in the optical at maximum light are predominantly from intermediate mass elements (Si, Ca, S, O, Mg) at high velocity () in the outer layers of the supernova ejecta. Lines of Fe become prominent at about two weeks after maximum light as the effective photosphere recedes into the ejecta, and about a month after maximum light the supernova enters the optically-thin nebular phase where forbidden emission lines of iron-peak elements (Fe, Co) dominate (Kirshner & Oke 1975). The optical spectra of SN 1998bu shown in Figure 4 follow this typical evolution. A more detailed comparison is illustrated in Figure 6 where we show the optical spectra of SN 1998bu and other prototypical SNe Ia near maximum light. The spectra are remarkably similar, though there are some differences in the detailed shapes and velocities of the features.

A more quantitative comparison between SN 1998bu and other typical SNe Ia is illustrated in Figure 7. We show the velocities of Si II nm and Ca II H & K flux minima as a function of supernova phase for a number of prototypical SNe Ia: SN 1994D (Patat et al. 1996), SN 1992A (Kirshner et al. 1993), SN 1990N (Leibundgut et al. 1991a), SN 1989B (Barbon et al. 1990; Wells et al. 1994), and SN 1981B (Branch et al. 1983). SN 1998bu falls well within the scatter defined by these other objects.
However, the measurement of Ca II H & K velocities is made more challenging by the presence of a feature blueward of the Ca feature (indicated in Figure 6 by a question mark), which may be due to either Si or possibly high-velocity Ca (Branch 1998, personal communication; Hatano et al. 1999). For SN 1998bu this unidentified feature was well separated from the normal Ca feature, as is seen in the early spectra of the sequence in Figure 4. The feature weakens with time such that by day +28 only the normal Ca feature remains. The sequence suggests that the Ca absorption velocity should be defined by the redder of the two troughs. For other SNe Ia, Figure 6 shows that the unidentified feature and the Ca feature are not always well separated, such as in the SN 1989B and SN 1990N spectra, where only a shoulder is visible rather than two distinct minima. The spectrum of SN 1972E was taken at significantly lower resolution, and there it looks like a single absorption feature. Thus comparing measured Ca II H & K velocities is tricky; our use of the red trough may lead to a systematically lower velocity measured at early times, as seems to be the case in Figure 7.
Supernovae with unusual luminosity also have unusual spectra. Both SN 1991T, one of the most luminous SNe Ia known, and SN 1991bg, one of the least luminous, showed spectral peculiarities in their maximum light spectra. SN 1991T lacked a well-defined Si II nm feature at maximum (Filippenko et al. 1992a; Phillips et al. 1992), though its subsequent evolution was similar to other SNe Ia. On the other hand, maximum light spectra of SN 1991bg showed a deep absorption trough attributed to Ti II centered at a wavelength of 420 nm (Filippenko et al. 1992b; Leibundgut et al. 1993). The absence of spectroscopic peculiarities in SN 1998bu makes it a suitable calibrator of the SN Ia distance scale.

The infrared spectrum of SN 1998bu in Figure 5 is one of the best obtained for a type Ia supernova. It is strikingly similar to an IR spectrum of SN 1995D taken at the same phase. SN 1995D also showed no spectroscopic peculiarities in the optical and a typical light curve (Riess et al. 1999), bolstering the evidence that SN 1998bu is a fairly normal SN Ia. The IR spectra are qualitatively a good match to the model spectra of Wheeler et al. (1998), although the models do not extend to the observed age of SN 1998bu and are meant to fit the peculiar event SN 1986G. In the -band (m), which consists of absorption features of Co, Ni, and Si, the spectra of SNe Ia 1998bu, 1995D and 1986G (Wheeler et al. 1998; Frogel et al. 1987) are nearly identical from 14 days past maximum onwards. The -band (m) spectra of SN 1998bu and SN 1995D do not show as large a gap between the peaks at 1.6 m and 1.8 m as does SN 1986G. The deficit at 1.7 m is not visible at all in the peculiar SN 1991T (Bowers et al. 1997), but that spectrum was taken at a more advanced age than the others. These observations suggest that the 1.7 m gap depth may possibly be correlated with light curve decline rate (and therefore luminosity) and supports the idea of Wheeler et al. (1998) that the 1.7 m gap is an indicator of the highest velocity of the Ni/Co region, though clearly more infrared spectra of SNe Ia are required to test this hypothesis. As in the optical spectra, the infrared spectra do not indicate that SN 1998bu was peculiar.
3.2. Light Curves and Peak Brightness
The optical light curves of SN 1998bu presented in Figure 2 are among the best sampled early-time light curves of any SN Ia. The band observations are particularly valuable as SNe Ia have not often been observed in this passband. In addition, our observations began before maximum light (unless stated otherwise, we take maximum light to mean the time of maximum brightness in the band). These light curves are typical of SNe Ia; the curves are well fit by the templates of Leibundgut (1989). In section 3.3 we describe the detailed analysis of these light curve shapes, an essential part of using this SN Ia as a distance indicator.
Work on SNe Ia as standard or calibrated candles employs the maximum brightness in the and bands. We have determined the peak apparent magnitude and time of maximum in the -band for SN 1998bu using a simple quadratic fit to the points within roughly five days of the light curve peak, weighted by their photometric uncertainties. The results are
| (1) |
| (2) |
(Throughout the paper, all apparent and absolute magnitudes are expressed in units of mag). The supernova apparent magnitude in at the time of maximum given above is
| (3) |
The time when the supernova was brightest in the band was JD , at . These results are quite consistent with the finding of Leibundgut (1989) that maximum light in occurs about two days after maximum light in and his result that the magnitude at that time is mag brighter than the magnitude at the time of maximum. The time of maximum brightness in the band is not well determined because of the starting point of our data set, but our data are consistent with the Leibundgut (1989) result of maximum occurring three days before maximum light in . The apparent magnitude at maximum is . SNe Ia show increased variety in their and light curves as compared to the bluer passbands, illustrated clearly in the composite light curves presented by Riess et al. (1999). The and light curves of SN 1998bu are consistent with these composite curves both in their general shape and times of maximum in those bands.
In comparing our photometry with the independent data set of Suntzeff et al. (1999), we find excellent agreement. The times of maxima in the various passbands are quite consistent given the stated uncertainties, as are the light curves in general. In Figure 8, we compare the photometry directly by plotting the difference between our magnitudes and those of Suntzeff et al. (1999). To make this comparison we have spline-interpolated the Suntzeff et al. (1999) light curves to the times of our observations, and have only computed differences when observations were within two days of each other to ensure the accuracy of the interpolation. The uncertainty in the magnitude difference was taken as the quadrature sum of the stated photometric uncertainties. As in the case of the photometry itself, the difference uncertainties are significantly correlated (due to the uncertainty in the comparison stars, for instance). The largest differences occur, as expected, in the -band, and in general the agreement between the two data sets is best near maximum light. Given the difficulties particular to supernova photometry, the consistency in the light curves is reassuring. Because small systematic differences in photometry can have a magnified effect in distance determination (through the reddening, for example), proper accounting of the (correlated) photometric errors is vital in order to obtain consistent results.

One important result from the photometry is that the observed color of the supernova at maximum, mag, is significantly redder than typical SNe Ia, which have mag (Schaefer 1995). Very underluminous supernovae such as SN 1991bg can have quite red intrinsic colors at maximum, but they also show distinct spectroscopic peculiarities. The absence of any such peculiarities in SN 1998bu suggests that this red color is not intrinsic to the supernova but rather a result of interstellar extinction along the line of sight. Supporting evidence for this extinction is presented in Section 3.3.
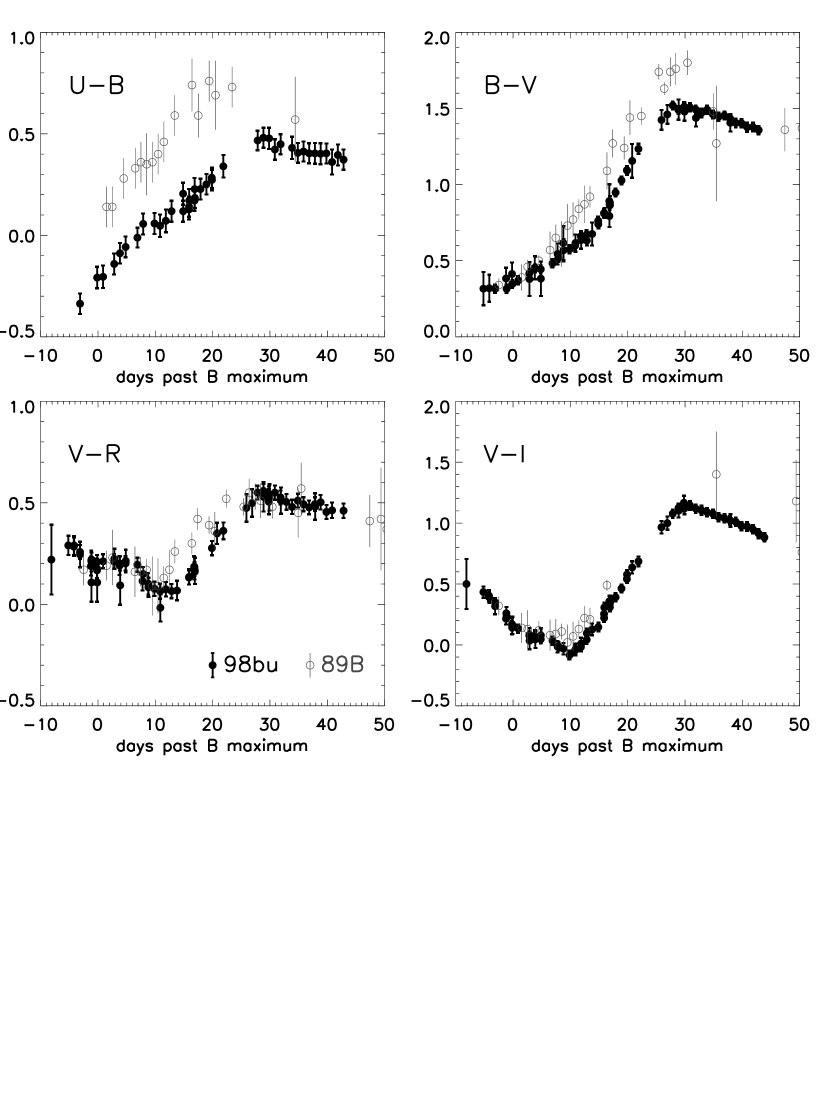
The optical color curves of SN 1998bu are also quite typical, as shown in Figure 9, where we present the color evolution of SN 1998bu compared to SN 1989B, also a spectroscopically normal SN Ia (Wells et al. 1994). Both of these supernovae had a similar color index at maximum light and the general shape of the color evolution of these two supernovae are in reasonable agreement. The slope of the rise is measurably different, resulting from the fact that SN 1989B was a faster-declining object. The other striking difference is the offset of the curves for the two supernovae. This could be a result of photometric uncertainties in calibrating the band, where detector sensitivities and filter transmissions can differ substantially from one site to another and require careful calibration (see the discussion by Suntzeff et al. 1999). However, it may also point to interesting diversity in the -band characteristics of SNe Ia, or diversity in the selective-to-total extinction properties of dust. A more detailed investigation of SNe Ia light curves in the near ultraviolet is warranted. This may be particularly important for observations of SNe Ia at high redshift where observations at optical wavelengths probe the rest-frame ultraviolet. Without a thorough understanding of SNe Ia -band properties, cosmological inferences based on rest-frame -band light curves are suspect.
In the infrared, the light curves of SN 1998bu match the templates developed by Elias et al. (1985), as shown in Figure 3, where we have fit the templates to the data by adjusting them independently in magnitude and together in time. The bright second maximum typical of SNe Ia in the infrared passbands shown in the templates is clearly observed in SN 1998bu, as is the -band deficit. The best-fit magnitude offsets to the templates are as follows: , , and . We find that the fiducial time as defined by Elias et al. (1985) is about 3 days before maximum light in . This differs slightly from the Elias et al. result, which suggested was roughly 5 days before maximum light; however, only three supernovae were used in that determination, so it would not be surprising if there were some variance. A larger sample of infrared light curves, especially with observations near the first maximum, would be useful. We note that Meikle & Hernandez (1999) show a large amount of infrared photometry of SN 1998bu near optical maximum; combining these data with our light curve (which is dominated by later points) should yield one of the best infrared light curves of a type Ia supernova.
3.3. Multicolor Light Curve Shape Analysis
The relation between luminosity and light curve shapes for SNe Ia, as quantified by Phillips (1993), and subsequently Hamuy et al. (1996a), led to the development of techniques to measure distances to SNe Ia from multicolor light curves. Hamuy et al. (1996b) showed how light curves and templates (Hamuy et al. 1996d) could be combined to derive accurate distances using a analysis. In a similar vein, Riess, Press, & Kirshner (1996a) developed the Multicolor Light Curve Shape (MLCS) method, a statistical technique to measure distances to SNe Ia from their light curves, allowing for reddening in the host galaxy. In this approach, the light curves of a “training set” of supernovae with estimated luminosities and extinctions are used to derive template light curves for a fiducial SN Ia, along with derived correction templates which detail the change in the light curve shapes as a function of luminosity and extinction. We focus on MLCS distances to SNe Ia in this paper; Phillips et al. (1999) present an extension to their template-fitting technique which also incorporates reddening, and the results of applying this method to SN 1998bu are reported by Suntzeff et al. (1999).
The orginal MLCS training set was based on nearby SNe Ia and relative distances measured to their host galaxies via the Tully-Fisher (TF), the surface brightness fluctuation (SBF), or the planetary nebula luminosity function (PNLF) methods. The only requirement was that these methods give accurate relative distances to the galaxies. Once trained, the method can be used on the light curves of a SN Ia, to determine the luminosity difference, , between that supernova and the fiducial () supernova as well as a derived extinction to the supernova. Application of MLCS to a sample of more distant supernovae indicated the effectiveness of this procedure. The dispersion in SN Ia distances about the Hubble line was reduced from mag in the standard candle assumption to mag with MLCS. The technique also demonstrated the Hubble law was applicable to large distances corresponding to velocities , as was also shown by Hamuy et al. (1996b).
However, uncertainties in these secondary distance determinations, inherent difficulties in estimating the extinction to some supernovae, and the small number of training set objects caused some problems in the derived MLCS SN Ia distance scale, as pointed out by Saha et al. (1997). To combat the major problems, Riess et al. (1998a) presented a new version of MLCS in which the relative distances for the training set objects were derived from their host galaxy recession velocities and the Hubble law for galaxies with redshifts . In addition, estimates of the extinction to the training set supernovae were refined, and effects of extinction on the shape of the light curve based on temporal variations in the effective selective-to-total extinction ratios from the evolving supernova spectrum (Nugent, Kim, & Perlmutter 1999) were also included. The procedure detailed in Riess et al. (1998a) was restricted to and light curves up to 40 days past maximum, to be applied to the high-redshift supernovae that are the focus of that paper, but a procedurally identical version (with one exception) using full light curves is used in this paper. Here we have used a “wide” choice of the a priori extinction distribution, with mag rather than a distribution which overly simplified the models of Hatano, Branch, & Deaton (1998). We found that our distribution based on those models predicts many fewer significantly reddened supernovae than are observed. Applying a Bayesian filter based on that particular distribution leads to underestimated extinctions in reddened supernovae and produces biased distances. We have reverted to the less restrictive prior distribution that was used by Riess, Press, & Kirshner (1996a), so that the posterior distribution is shaped primarily by the observations rather than by the prior (cf. Figure 12).
The MLCS analysis fits the light curves with templates that are a function of luminosity and extinction. To determine the peak brightness of the supernova (in the band which is arbitrarily chosen as the default), rather than using just the points near maximum light, the whole light curve is used, through a weighted average of the difference between the light curve and the best-fit template. We designate this weighted average to differentiate it from the estimate of maximum light brightness based on only the points near the time of maximum light, . Again, we note that the time of maximum light is defined in the band, such that both and describe the magnitude at the time of peak luminosity. The difference between and is quite small in all cases, but disregarding the distinction would make it appear as though there are discrepancies in derived distances at the level of mag.
The MLCS analysis of a set of supernova light curves results in three major parameters: , , and . Application of the MLCS method on the light curves of SN 1998bu yields a maximum light brightness , which is quite consistent with the result from just the points near maximum, . The derived extinction is mag and the luminosity difference mag (i.e., the supernova was 2% less luminous than the fiducial). For the purposes of comparing supernovae and measuring distances, we define as the extinction-corrected maximum light apparent magnitude of the supernova in the band. We further define the quantity , which would be the maximum light apparent -band brightness of the supernova had it been free of absorption and of fiducial luminosity. For SN 1998bu, then, we have
| (4) |
| (5) |
where the uncertainties are primarily due to the (correlated) uncertainties in the derived luminosity correction and extinction, with the uncertainty in the extinction ( mag) being the dominant component.
The derived extinction can be compared directly with the supernova’s red color at maximum light. Assuming that a typical unreddened SN Ia has (Schaefer 1995) implies a color excess for SN 1998bu of mag. Adopting (at maximum light) yields mag, fully consistent with the MLCS extinction derived from the full light curves. We note that the expected extinction from our Galaxy along the line of sight to SN 1998bu is small, mag (Schlegel, Finkbeiner, & Davis 1998), so that the bulk of the reddening is from M96 itself111Stanek (1998) and Arce & Goodman (1999) have recently concluded that the Galactic reddening maps of Schlegel, Finkbeiner, & Davis (1998) might overestimate the extinction in regions where mag. The Galactic extinction towards M96 is well below this level, so this should not be a major concern.. The color of SNe Ia is also generally quite uniform at days past maximum light, with mag (Lira 1995; Riess et al. 1998a; Phillips et al. 1999). The observed color of SN 1998bu at that time, mag, also implies a color excess consistent with the extinction derived from the full MLCS analysis. Suntzeff et al. (1999) derive a total reddening for SN 1998bu of mag based on the and color evolution (Phillips et al. 1999), which is consistent with our results.
Further evidence comes from the infrared light curves, where effects of dust are expected to be small. By comparing our IR observations with those of other well-observed type Ia events and assuming that the optical-IR colors are constant for normal SN Ia, we can derive another check on the inferred extinction. For example, the maximum of SN 1981B was fainter by 0.08 mag than the maximum of SN 1998bu, while in -band the SN 1981B light curve was fainter than the SN 1998bu light curve by 0.87 mag (Elias et al. 1981). Using the extinction law of Cardelli, Clayton, & Mathis (1989) with , the difference in visual extinction between the two supernovae is given by . Hence, the relative extinction between 1981B and 1998bu is mag. Unfortunately, there are few type Ia supernovae with low extinctions and good IR light curves which can be used in this way. Combining infrared and optical data of SN 1980N and SN 1981D, both in NGC 1316 (Hamuy et al. 1991), gives a relative extinction of 0.81 mag and a rough lower limit consistent with our derived value. SN 1989B was highly extinguished as is SN 1998bu. The visual magnitude difference between these two is 0.11 mag (SN 1998bu is brighter) and the difference is mag (SN 1998bu is fainter), suggesting that there is 0.20 mag less visual extinction to SN 1998bu than SN 1989B. Wells et al. (1994) found a color excess to SN 1989B of mag, meaning the extinction to SN 1998bu would be mag. All of the estimates from the infrared photometry are consistent with a total visual extinction to SN 1998bu of mag, supporting the value derived in the MLCS analysis.
These checks based on the color excesses at a number of wavelengths from -band to -band are consistent with the view that the shape of the extinction curve is likely close to the standard Galactic law (Riess, Press, & Kirshner 1996b), though the absolute normalization is not constrained. Spectrophotometric observations of SNe Ia have been used to determine the normalization, with at maximum light, as well as the temporal variation of the effective due to the evolution of the supernova spectrum (Nugent, Kim, & Perlmutter 1999). The -band photometry still provides some cause for concern; if the blue color is due to differences in the properties of the absorbing dust, the estimated extinction may be incorrect.
Independent checks of the MLCS-derived extinction are valuable. One such check is the presence of interstellar Na I D and Ca II H & K absorption in high-resolution spectra, which was reported by Munari et al. (1998) and Centurion et al. (1998). The equivalent width of the Na I D1 ( nm) absorption lines reported by Munari et al. (1998) were 0.019 nm and 0.035 nm at velocities corresponding to our Galaxy and M96, respectively, and we confirm these measurements even with our low-dispersion spectra. Using the Munari & Zwitter (1997) calibration of the correlation between the equivalent width and reddening they derive color excesses of 0.06 and 0.15 mag, for a total reddening of mag. However, the relation between the absorption-line equivalent widths and the reddening has a large scatter, with a typical dispersion of 0.15 mag in for multi-component lines (Munari & Zwitter 1997), so that these values do not contradict the extinction inferred from the MLCS analysis (cf. discussion by Suntzeff et al. 1999).
We can also check our derived luminosity with other techniques. The relation between light curve shape and luminosity was pioneered by Phillips (1993) and Hamuy et al. (1995, 1996a) using the quantity , which parameterizes the light curves in terms of the magnitude decline of the supernova over the fifteen days after maximum light. From our light curve, we measure , which agrees very with Suntzeff et al. (1999), who found . Direct comparison of the luminosity correction is made difficult because of effects of extinction on the light curve shape, as well as differences in our respective fiducial templates. Nevertheless, we can measure from the MLCS fiducial template (, ) which yields . Thus the measured values of and , both of which imply SN 1998bu to be quite close to the MLCS fiducial template, indicate consistency in the two approaches. This is not surprising, since both methods use the shape of the observed light curve in a similar fashion.
An alternative approach was described by Nugent et al. (1995), who presented correlations between spectral features and intrinsic SNe Ia luminosity. In particular they define two indicators: Si II, the ratio of the depths of Si II absorption lines observed at 580 and 615 nm; and Ca II, the flux ratio of the continuum levels just blue and red of the Ca II H & K absorption. Our maximum-light spectra of SN 1998bu yield Si II and Ca II. Riess et al. (1998b) present linear relations between and both Si II and Ca II, which yield a mean luminosity correction for SN 1998bu of and , respectively. These agree well with the luminosity correction result derived in the MLCS analysis.
All indications thus suggest that SN 1998bu was an intrinsically normal type Ia supernova, significantly extinguished by dust along the line of sight. With the MLCS analysis we determine the peak brightness (), the luminosity correction ( mag), and the extinction ( mag), so that SN 1998bu can be used to calibrate the SN Ia distance scale.
4. The Distance Scale
4.1. Hubble-Flow SNe Ia
Constructing the Hubble diagram requires a sample of well-observed SNe Ia in the Hubble flow where errors due to peculiar velocities are expected to be small, and which is analyzed in exactly the same way as the local calibrators. Our MLCS sample consists of 42 SNe Ia, 26 from the Calán/Tololo supernova search (Hamuy et al. 1993, 1996c) and 16 from the CfA supernova monitoring campaign (Riess et al. 1999). The only further selection criteria we have imposed (other than those inherent in the two data sets) is a cut in the host-galaxy recession velocity, which has been corrected to the cosmic microwave background (CMB) frame222Heliocentric redshifts for the host galaxies were first transformed to the Local Group rest frame by adding (-30, 297, -27) in Galactic Cartesian coordinates (de Vaucouleurs et al. 1991; Lynden-Bell & Lahav 1988). The recession velocities in the Local Group frame were then transformed to the CMB rest frame by adding (10, -542, 300) (Smoot et al. 1992).. We have excluded supernovae in galaxies with where peculiar motions become increasingly important. Additionally, we have excluded supernovae in galaxies with , where the relation between luminosity-distance and redshift begins to be non-linear at a level which could affect our results (Schmidt et al. 1998).
The Hubble-flow sample consists of the following SNe Ia: SN 1990O, SN 1990af, SN 1991U, SN 1991ag, SN 1992J, SN 1992K, SN 1992P, SN 1992ae, SN 1992ag, SN 1992al, SN 1992aq, SN 1992au, SN 1992bc, SN 1992bg, SN 1992bh, SN 1992bk, SN 1992bl, SN 1992bo, SN 1992bp, SN 1992br, SN 1992bs, SN 1993B, SN 1993H, SN 1993O, SN 1993ac, SN 1993ae, SN 1993ag, SN 1993ah, SN 1994M, SN 1994Q, SN 1994S, SN 1994T, SN 1995D, SN 1995E, SN 1995ac, SN 1995ak, SN 1995bd, SN 1996C, SN 1996Z, SN 1996bl, SN 1996bo, and SN 1996bv. We emphasize that all of these supernovae have well-sampled multicolor CCD light curves, with photometry obtained, reduced, and transformed to the standard system in a similar fashion, an essential feature which allows us to combine the data sets.
We use MLCS to turn these SNe Ia into standard candles, so that the extinction- and luminosity-corrected maximum light absolute magnitude, , is a constant, where is the distance modulus. Using the definition of the distance modulus,
| (6) |
where is the distance in Mpc, is the recession velocity in , and is the Hubble constant measured in its conventional units of , we get the result
| (7) |
Since the absolute magnitude of the fiducial SN Ia is taken to be constant, we can determine that
| (8) |
Here is “the intercept of the ridge line” and is a constant which can be determined from observations of Hubble-flow SNe Ia alone.


In Figure 10 we present this relation for our sample of 42 Hubble-flow SNe. The small scatter allows us to solve precisely for the intercept, , as shown more clearly in Figure 11. The best-fit intercept (which is simply the mean of ) using all the supernovae is , where the uncertainty is the formal standard error in the mean, and assumes the residuals from each supernova are normally distributed and independent. We assign a 1 uncertainty to the redshift to account for the contribution of peculiar motions (Riess, Press, & Kirshner 1996a). The dispersion about the mean is ; this corresponds to a dispersion in magnitudes (obtained simply by multiplying by 5) of mag, implying only an 8% relative distance uncertainty per object333Some of this uncertainty arises from the uncertainty in the redshift due to peculiar velocities. Our sample has an error-weighted mean redshift of roughly 10,000 so that the adopted 300 uncertainty corresponds to a 3% distance uncertainty on average. This means the actual relative distance uncertainty intrinsic to the MLCS analysis of the supernovae is only 7% per object.. Our derived intercept depends upon the choice for the fiducial luminosity () supernova. As long as the comparison with the local calibrators is made with the same choice, there is no problem. However, when comparing this set of Hubble-flow SNe with those analyzed by a different technique, such as the method (Suntzeff et al. 1999; Phillips et al. 1999), there will likely be an offset in due to the different choices of a fiducial luminosity. Such an offset will also be reflected as the same offset for the fiducial absolute magnitude, .
The quoted statistical uncertainty in the measurement of is quite small, and it is surely underestimated. We assumed that each supernova distance is independent, whereas in reality there exists some covariance. Thus, the true uncertainty in the mean does not simply decrease as , but rather levels off due to a floor caused by systematic uncertainties. It is thus important to estimate at what level this floor is reached. The formal uncertainty in corresponds to mag or just over one percent uncertainty in the Hubble constant arising just from the Hubble-flow supernovae.
Sample differences between the Hubble-flow and calibrating SNe Ia are one potential source of systematic uncertainty at this level. The present sample is necessarily imperfect; one difference occurs due to the host-galaxy type: our Hubble-flow sample includes supernovae in both early-type and late-type hosts, while hosts of the local calibrators have Cepheid distances, and thus are of late-type only. Hamuy et al. (1995) have shown that SNe Ia in E/S0 galaxies are systematically fainter than those in spirals or irregulars (we refer to galaxies classified Sa or later, including irregulars, as “spirals” in what follows). More accurately, the highest luminosity SNe Ia are found only in spirals (Riess et al. 1999), perhaps implying a relation between recent star formation and the brightest SNe Ia. Nevertheless, SNe Ia brightness in both early-type and late-type galaxies correlate similarly with light curve shape, so that an MLCS (or ) analysis will still correct SNe Ia in spirals and ellipticals to the same fiducial luminosity without using any information on the galaxy morphology, as demonstrated by Schmidt et al. (1998). To further test this we have divided our sample into two subsets, early-type and late-type hosts, solving independently for the intercept. The results are presented in Table 5. We see that after application of MLCS the offset between in early-type and late-type galaxies is inconsistent with zero at only the 1.5 level. Determining whether this difference is significant will require a larger sample. However, this offset would lead to a difference in the derived Hubble constant (for a fixed ) of (in the sense that early-type galaxies yield the slightly higher value).
| Sample | [mag] | ||
|---|---|---|---|
| All | 42 | 0.16 | |
| Late-type (Sa) | 25 | 0.17 | |
| Early-type (E/S0) | 17 | 0.14 | |
| 28 | 0.16 | ||
| 14 | 0.15 |
Another potential source of systematic uncertainty in the measurement of is the effect of galaxy peculiar velocities and flows. We have transformed the measured host-galaxy recession velocity to the frame at rest with respect to the CMB frame, but distortions of the velocity field will result in errors in our derived intercept. Some peculiar velocity studies (e.g., Giovanelli et al. 1998) have indicated convergence of the flow field relative to the Local Group with the CMB dipole at redshifts , though others do not (e.g., Lauer & Postman 1994). Our full sample is cut at , so flows may be important at the lowest redshifts. To check this we examined a subset of data with where such motions should have a much smaller effect. As Table 5 shows, there is no signifcant difference in between our full sample and the sample restricted to .
There is a larger difference in comparing the more distant sample with the remaining SNe Ia, i.e. those with . In this case the offset in differs from zero at . Zehavi et al. (1998) have interpreted this result as the effect of a local void, whereby we live in a slightly underdense region compared to the average density of the universe, leading to a larger nearby expansion rate. For a fixed the difference in would lead to a “local” Hubble constant larger than the global value by . Again, more Hubble-flow SN Ia light curves will help determine whether this offset is real, a statistical fluke, or an artifact of the analysis technique. Since the large majority of our sample (28 of 42) have , the mean is more reflective of the global value.
We have performed an additional test of our derived intercept by employing a simple geometric flow model which includes the effects of nearby mass concentrations such as the Virgo Cluster, the Great Attractor, and the Shapley Supercluster on the velocities of the supernovae host galaxies (Mould et al. 1999). Using the position and redshifts of our galaxy sample, this model predicts that we underestimate the Hubble constant by in assuming that the Hubble-flow galaxies are at rest with respect to the CMB frame.
Additional sources of uncertainty may remain, for instance due to correlations in the MLCS analysis arising from the training set and construction of the templates, or uncertainties in the calibration of the photometric system. A larger sample of Hubble-flow SNe Ia would be helpful to determine what unidentified systematics may remain and at what level they affect our conclusions.
Given that the identified systematic errors in the Hubble-flow SNe do not yet definitively suggest a bias in our derived intercept, we use these results only as a guide to the size of the systematic uncertainty. Based on these explorations, a reasonable estimate of the 1 systematic uncertainty in the Hubble-flow supernovae would be in the Hubble constant. Our best estimate for the intercept of the ridge-line and its total uncertainty is then . As we discuss below, this uncertainty in the Hubble-flow SNe Ia is dwarfed by both statistical and systematic uncertainties in the Cepheid-calibrated supernovae and our measurement of (Hamuy et al. 1996b; Riess, Press, & Kirshner 1996a).
4.2. Cepheid-Calibrated SNe Ia
To measure the Hubble constant we need both the intercept of the ridge line, , and the maximum light absolute magnitude of our fiducial SN Ia, . We use a sample of SNe Ia in galaxies with distances measured via Cepheids. SN 1998bu in NGC 3368 is only the most recent example, others are listed by Saha et al. (1997) in their Table 6: SN 1895B and SN 1972E in NGC 5253, SN 1937C in IC 4182, SN 1960F in NGC 4496A, SN 1981B in NGC 4536, and SN 1990N in NGC 4639. Their table also includes SN 1989B in NGC 3627, but the distance to this galaxy is only inferred from distances to other galaxies in the Leo group (including NGC 3368). We restrict our sample to the best cases: supernovae in galaxies whose distances are directly measured by Cepheids rather than distances to groups or clusters. Schaefer (1998) has also recalibrated the light curve of SN 1974G in NGC 4414, for which the host-galaxy Cepheid distance has been measured by the HST Distance Scale Key Project (Turner et al. 1998).
The supernovae we use as calibrators are only those which are measured and analyzed in the same way as our Hubble-flow sample, to avoid systematic errors. For this reason, we only consider SNe Ia which have photoelectrically measured multicolor light curves. As our observations of SN 1998bu have shown, even CCD data measured and calibrated similarly can yield discrepant photometry depending on the details of the telescope, detector, and filters. Such calibration problems, as well as problems of galaxy background subtraction and transformation to the Landolt system, make photographic photometry of supernovae subject to systematic differences in the peak brightness, colors, and the light curve shape. The last point is crucial; we must be certain that the observed light curve shape is an intrinsic property of the supernova, and not an artifact of systematic errors resulting from photographic photometry (Boisseau & Wheeler 1991; Pierce & Jacoby 1995). While heroic efforts (e.g., Schaefer 1998 and references therein) have been made in compiling and reanalyzing older photographic (and even visual) light curves, the best path to the Hubble constant lies along another route: precise distances to well-observed objects. The drawback to a high standard for the data is that our calibrating sample is small, consisting of four SNe Ia: SN 1998bu, SN 1990N, SN 1981B and SN 1972E. We pay in random error what we avoid in systematic bias and we believe this to be a good bargain.
The Cepheid distances to the host galaxies of these four supernovae have been measured by two HST programs, but the general approach among all the HST Cepheid programs is the same. From the derived mean magnitudes of the Cepheids and a relation (Madore & Freedman 1991), distance moduli (relative to the LMC) can be determined. The two-color photometry allows for an estimate of the extinction, either on a Cepheid-by-Cepheid basis or in the mean, yielding an extinction-corrected distance modulus for the host galaxy.
It is important to use distance moduli for the host galaxies which are derived consistently (e.g., always using the same relation, the same LMC distance modulus, the same extinction prescription, etc.) so that each supernova is on an equal footing. Thus we have not simply used the final distance modulus quoted in the Cepheid papers, but rather have tried to extract as uniform a set of distance moduli as we can with limited information. This approach also allows us to more easily consider systematic effects in the Cepheid distances. For instance, in this section we use distance moduli with the LMC distance fixed at mag (Hereafter, all distance moduli will have implied units of magnitudes). We do not yet include the uncertainty in this value because that uncertainty is implicit in each host galaxy distance, and moreover it is perfectly correlated, such that the derived mean absolute magnitudes will suffer the same uncertainty. We postpone discussion and quantification of such systematic (“external”) uncertainties to the next section.
4.2.1 SN 1998bu in M96 (NGC 3368)
For SN 1998bu, Tanvir et al. (1995) discovered seven Cepheids with well-determined light curves in M96. They derived an extinction-corrected distance modulus of with the uncertainty coming from the photometric errors and the uncertainty (in the mean) of the fit to the relation. However, their photometry was not corrected for the WFPC2 “long/short” exposure effect (Hill et al. 1998) which leads to and magnitudes systematically too bright by 0.05 mag in long exposures such as those for Cepheid programs. We have corrected the distance modulus of M96 for this effect, yielding , with the quoted uncertainty being only the “internal” error. Combined with the extinction-corrected maximum light apparent magnitude from Equation 4, we derive an extinction-corrected maximum light absolute magnitude for SN 1998bu, . To determine the absolute magnitude of our fiducial SN Ia, , we also include the derived luminosity difference mag for SN 1998bu, which leads to .
Our absolute magnitude for SN 1998bu is fainter than that reported by Suntzeff et al. (1999) who found . This offset arises from different estimates of the extinction. We have employed mag derived from the MLCS analysis of the light curves, whereas Suntzeff et al. (1999) derive a total mag, yielding mag. This difference is, for better or worse, within the uncertainties, and may arise partly from an offset in the intrinsic colors in the light curve fitting methods, but some more careful comparisons between the two methods may be necessary. Nevertheless, it turns out that the derived Hubble constant is not very different in the two methods.
4.2.2 SN 1990N in NGC 4639
For SN 1990N we have performed an MLCS analysis on light curves from Lira et al. (1998), with the results presented in Table 6. We have used the extinction corrected Cepheid distance modulus to NGC 4639 determined by Saha et al. (1997), , based on 15 high-quality Cepheids. From this we derive an absolute magnitude for SN 1990N of and an estimate of the fiducial absolute magnitude .
4.2.3 SN 1981B in NGC 4536
Our MLCS analysis of SN 1981B was based on the light curves of Buta & Turner (1983). Saha et al. (1996) found a total of 73 Cepheids in NGC 4536 and determined an extinction corrected distance modulus, . This leads to an absolute magnitude for SN 1981B of and .
4.2.4 SN 1972E in NGC 5253
Finally, for SN 1972E, we have light curves from Ardeberg & de Groot (1973) and Leibundgut et al. (1991b). Saha et al. (1995) have presented their final analysis of Cepheids in NGC 5253, with their result . However, some cautions are in order. These observations were made with the original WFPC instrument (with spherical aberration) rather than WFPC2; also, the -band light curves were transformed from the HST F785LP filter rather than F814W. These differences may possibly lead to a small systematic difference in the derived distance modulus compared to the other host galaxies. Furthermore, the Cepheid sample is small, as there are only 5 Cepheids with high-confidence mean magnitudes in both and . Using the derived apparent moduli in and , and estimating the Cepheid extinction in the same manner as for the other three host galaxies, we have rederived the same distance modulus as Saha et al. (1995) but with a significantly larger uncertainty, . Our MLCS analysis of SN 1972E then leads to and .
We present the MLCS results, Cepheid distances, and absolute magnitudes for SN 1998bu and the three other calibrating SNe Ia in Table 6. We note that the estimates for are consistent given their uncertainties, though SN 1981B seems to give a measurably fainter value. Since the estimates are mutually consistent and there is no a priori reason to distrust any of them, we take the data at face value. The error-weighted mean gives the maximum light absolute magnitude of our fiducial SN Ia, . As with the ridge-line intercept, here again we must be wary of the uncertainty estimate since it ignores the covariance in the Cepheid distances. Kochanek (1997) has shown there is significant statistical covariance in the Cepheid distance moduli, even beyond the common zero-point set by the LMC distance, which arises from a number of sources including the Cepheid photometry, the determination of mean magnitudes, and the fit to the relation. If we include an estimate of this statistical covariance to determine how to combine the Cepheid distances (usually incorrectly assumed to be independent) by using the Pearson correlation coefficient, (C. Kochanek, personal communication), our best estimate of the fiducial absolute magnitude and its statistical uncertainty becomes . This estimate still does not incorporate some sources of systematic uncertainty, including the LMC distance, which we dicuss in detail in Section 5.2.
| SN Ia | Galaxy | |||||||
|---|---|---|---|---|---|---|---|---|
| 1998bu | NGC 3368 | 11.89 | 0.94 | |||||
| 1990N | NGC 4639 | 12.68 | 0.43 | |||||
| 1981B | NGC 4536 | 11.99 | 0.35 | |||||
| 1972E | NGC 5253 | 8.43 | 0.15 | |||||
| Mean |
4.3. The Hubble Constant
With estimates of the ridge-line intercept and the maximum-light absolute magnitude of our fiducial SN Ia, we derive the Hubble constant, from
| (9) |
The mean of the four calibrating SNe Ia gives , and using all 42 Hubble-flow SNe Ia gives , which results in our best estimate of the Hubble constant,
| (10) |
where the uncertainty does not include systematic uncertainties in the Cepheid distance scale to be discussed below. Even so, it is important to note that the total uncertainty in is about three times smaller than the statistical uncertainty in . The statistical error in this small sample of calibrating SNe Ia, arising from both the uncertainty in the luminosity- and extinction-corrected supernova brightness and the uncertainty in the Cepheid distance moduli, dominates the statistical uncertainty in (Hamuy et al. 1996b; Riess, Press, & Kirshner 1996a). Reducing this statistical error can best be accomplished by observations of additional nearby SNe Ia and Cepheids in their host galaxies. SN 1998bu is the first example where a new supernova has been studied in a galaxy where the Cepheid work is already in the literature, but more will follow in the years ahead. The systematic uncertainty in the calibrating SNe and their Cepheid distances is still an important consideration, discussed in the next section.
5. Discussion
5.1. Comparison with other work
Suntzeff et al. (1999) used SN 1998bu and four other local calibrators (they included SN 1937C in IC 4182 in their local sample), combined with distant SNe Ia from the Calán/Tololo sample to derive a Hubble constant, (this uncertainty ignores covariances in the Cepheid distances). Their result, using a different method to convert light curves to luminosities and extinction (Phillips et al. 1999), is quite consistent with ours. There are slight differences in measurements of individual objects, but the overall agreement is reassuring and indicates that SNe Ia are excellent distance indicators whose intrinsic diversity can be understood and quantified.
The calibration of the peak absolute magnitude of SNe Ia has been driven by the great efforts of the HST program to measure Cepheid distances to the supernova host galaxies (Sandage et al. 1992). That group’s latest published determination of the Hubble constant and statistical uncertainty (also ignoring Cepheid covariances) is (Saha et al. 1997). This is consistent with our result – agreement to 10% is good given the long history of measurements of the Hubble constant. Nonetheless, it is instructive to pinpoint where the differences arise. The Saha et al. (1997) analysis uses a “fiducial sample” of 56 Hubble-flow SNe Ia with and peak magnitudes, typically determined from photographic plates. Enforced upon the sample is a velocity constraint, , and a color constraint mag (after correction for Galactic extinction) to avoid peculiar SNe Ia and those with large amounts of extinction. As local calibrators, they use seven SNe Ia in six galaxies with five Cepheid distances (the distance to SN 1989B was estimated by association to other Leo Group galaxies with measured Cepheid distances; see their Table 6). Their local calibrator sample is not selected by the same criteria as their fiducial sample, as no color constraint was applied to the local calibrators. So SN 1895B was used with an estimated but no color information, and SN 1989B was used though it was too red, with mag (Wells et al. 1994). (SN 1998bu would also be too red to meet the color requirement of their fiducial sample.) Nevertheless, excluding SN 1895B and 1989B from their analysis would only have a small effect and would increase their derived by about 1 .
Though we have not used SN 1895B and SN 1989B in our local sample for reasons adduced earlier, there are additional differences between the two analyses. Saha et al. (1997) include no correction for variation in intrinsic SN Ia luminosity based on light curve shape. This is particularly significant for the calibrator sample where 3 out of the 4 objects are slow decliners; including this correction makes the estimated fiducial absolute peak magnitude slightly fainter and explains about half our disagreement in . Most of the balance of the difference likely arises from the treatment of extinction. While Saha et al. (1997) correct some of their local calibrator peak magnitudes for extinction individually, they do not apply an extinction correction to their fiducial sample SNe. If the mean color excess of their fiducial sample were as little as mag, correcting for extinction would increase the mean by mag, and raise by , which is the other half of the difference in . Saha et al. (1997) argue that selection effects against the discovery of extinguished distant supernovae preclude a significant amount of extinction in the fiducial sample. While this could be true, there is no demonstration that it is true for the sample they use. The selection effects in the several searches that led to the SNe Ia of their fiducial sample are quite complicated (see, e.g. Hamuy & Pinto 1999), and a priori statements about the possible extinction distribution of the distant supernovae are not, by themselves, evidence. In particular, discovery of SNe Ia with mag does not seem to be strongly suppressed. In Figure 12 we show the extinction distribution for our Hubble-flow and calibrating samples and it is clear that a some of the supernovae found this way are, in fact, signifcantly extinguished.

The MLCS analysis was designed to address these concerns; the supernova peak magnitude, extinction and luminosity correction are quantitatively estimated for each object, with a careful attention to correlations and the final distance modulus uncertainty. This obviates the need to make arbitrary sample cuts. We have taken particular care to analyze the local calibrators and the Hubble-flow SNe Ia by the same methods. While these technical differences are significant, the difference in the derived Hubble constant between our approach and others is small. Uncertainty in the true Hubble constant still arises principally from the small size of the calibrator sample and from uncertainties in the lower rungs of the distance ladder.
5.2. External uncertainties
We examine three sources of systematic uncertainty in the distances of the galaxies that host the calibrating SNe Ia: the effect of metallicity on HST Cepheid distance moduli, recalibration of the Cepheid relation, and the distance to the LMC, which are likely to be the most important sources of systematic error.
5.2.1 Metallicity dependence of the Cepheid scale
The remarkably tight relation of Cepheids in the LMC is quite a boon to distance measurement, but also calls for understanding variation in the (and therefore derived distance moduli) with environment. Metallicity, in particular, may play an important role. Theoretical studies of Cepheid pulsation (e.g., Chiosi, Wood, & Capitanio 1993) indicate metallicity can have an effect on the brightness and colors of Cepheids, though the size of this effect is uncertain. If the brightness and colors of Cepheids vary with metallicity, their distances will be misestimated, both because of an incorrect estimate of their intrinsic brightness as well as an incorrect estimate of the extinction based on the color excess. Systematic errors in distances would occur in Cepheid populations with significantly different mean abundances than the LMC.
While it is important to understand the effects of metallicity on Cepheid luminosities and colors in many wavebands (see, e.g., Freedman & Madore 1990; Gould 1994; Stift 1995), our particular concern is the effect on the HST Cepheid distances. Recently great efforts have been made to determine empirically the relation between metallicity and distance moduli measured in and with the standard procedure of extinction correction. The “metallicity” dependence of extragalactic Cepheids is usually parameterized in terms of [O/H], the logarithmic number abundance of oxygen to hydrogen, relative to solar composition and measured via H II region spectra. We adopt the notation
| (11) |
which gives the change in the distance modulus per factor of ten in metallicity, measured in mag/dex. Then the true distance modulus of a galaxy is given by , where is the measured extinction-corrected distance modulus. Recently, Kennicutt et al. (1998) used HST observations of three fields in M101 over which a large abundance gradient has been observed from measurements of H II regions. Their analysis showed a slight correlation of distance modulus with metallicity, with . Beaulieu et al. (1997) and Sasselov et al. (1997) analyzed the effects of metallicity on the relation from observations of LMC and SMC Cepheids from the EROS microlensing project. Their conclusion was for a slightly stronger dependence444The value of quoted in their papers is for abundances measured in terms of [Fe/H]; is correct for [O/H] (D. Sasselov, personal communication)., . A global analysis of many Galactic and extragalactic Cepheids by Kochanek (1997) yielded a similar metallicity dependence; we consider this analysis in more detail in the next section.
To assess the possible impact of metal abundance on the Hubble Constant from SNe Ia, we have recalculated the distance moduli to the calibrating galaxies with these empirically determined metallicity corrections. We adopt measurements for NGC 3368 and NGC 5253 as compiled by Kennicutt et al. (1998) in their Table 4. The abundances for NGC 4639 and NGC 4536 are from Kochanek (1997), who estimated these based on metallicity-magnitude and metallicity-galaxy type relations; we have adopted an uncertainty of on these estimates, though the results are not particularly sensitive to this choice. The effect of the recalculated distance moduli is shown in Table 7, where we have derived estimates for three cases: , i.e., no metallicity dependence, from Kennicutt et al. (1998), and from Beaulieu et al. (1997) and Sasselov et al. (1997).
| SN Ia | Galaxy | ||||
|---|---|---|---|---|---|
| 1998bu | NGC 3368 | ||||
| 1990N | NGC 4639 | ||||
| 1981B | NGC 4536 | ||||
| 1972E | NGC 5253 | ||||
| Mean | |||||
The results are interesting; the corrections for metallicity yield little change in the inferred Hubble constant. Low values from SNe Ia are not due to metallicity effects on the Cepheid distances to this sample of galaxies. This is primarily due to our inclusion of SN 1998bu in NGC 3368, which is the only metal-rich calibrator, by a factor of 0.7 dex compared to the LMC. If metallicity were the culprit causing a low SNe Ia , we would expect our inferred for SN 1998bu to be very faint without a metallicity correction. However, the distance modulus of Tanvir et al. (1995) and our observations do not require a faint value. More strikingly, comparing SN 1998bu and SN 1972E we see that the estimates of are almost exactly the same without a metallicity correction, even though the metal abundance is higher in NGC 3368 than in NGC 5253 by more than a factor 10.
As a result, including a metallicity correction increases the dispersion in the estimates of from the four calibrating SNe Ia, from mag with no metallicity correction, to mag for the Kennicutt et al. (1998) value, to mag for the Sasselov et al. (1997) value. The sample size of four is probably too small to place much confidence in this result, but if it were borne out by a larger sample, it would have interesting implications. Assuming that the intrinsic dispersion in the MLCS-corrected luminosity for the calibrating supernovae is the same as that for the Hubble-flow SNe Ia ( mag), any increase in the dispersion would arise from the Cepheid distance moduli. A significant increase in dispersion with a metallicity correction would imply either that the association between H II region metallicity and Cepheid metallicity is not straightforward, that the metallicity correction was incorrect, or that some other systematic uncertainty (perhaps in the properties of SNe in regions of different metallicity) was colluding with the metallicity to counter its effect in the uncorrected distance moduli. Increasing the sample of SNe Ia in galaxies with Cepheid distances (particularly covering a wide range of metallicity) would be a very desirable path to understanding this important uncertainty in the distance scale. We note that Nevalainen & Roos (1998) used this idea of “statistical consistency” between Cepheid-calibrated distance indicators (including SNe Ia) to derive a metallicity dependence which brought the estimates of into the best concordance, . Because of the high metallicity of NGC 3368, including SN 1998bu in their analysis would likely affect this result.
In principle the supernovae themselves can provide an estimate of the metallicity correction, but minimizing the dispersion in our four calibrating supernovae yields , which is only a weak constraint given the very small sample size. In addition, such a procedure ignores a possibly significant metallicity dependence in the brightness of the supernovae themselves. Thus the current supernova data do not provide strong evidence either for or against the incorporation of a metallicity dependence in the Cepheid distance moduli. We take the results at face value, and combined with the current best estimates of we conclude that the systematic error in from metallicity considerations for this sample is small, .
5.2.2 The Cepheid relation
We (and most authors) have adopted the -band and -band relations derived from LMC Cepheids by Madore & Freedman (1991). The relations are consistent with earlier estimates (e.g., Sandage & Tammann 1968; Feast & Walker 1987), but are based on a relatively small sample of objects compared to the number now known in more distant galaxies. An error in the slope or zero-point could be an important source of systematic uncertainty. In this section, by the zero-point we do not mean to include the uncertainty in the distance to the LMC (still adopted as , and discussed extensively in the next section), but only uncertainty in the zero-point that arises from a small sample of LMC Cepheids, even after assuming the LMC distance is perfectly known.
The Madore & Freedman (1991) relations have statistical zero-point uncertainties of 0.05 and 0.03 mag in and respectively. Unfortunately, residuals for the fit to the relations are correlated, and the slope is also slightly correlated to the zero point, so that the real uncertainty in the application of the relations is not just a straightforward quadrature combination of these uncertainties. Tanvir (1996) analyzed an augmented sample of LMC Cepheids with particular attention to correlated residuals and found a slightly tighter relation. However, his result indicated bias in the Madore & Freedman (1991) calibration such that for typical period distributions, HST Cepheid distance moduli are overestimated by mag, which would imply an increase in our estimate of (to fainter intrinsic luminosity) by the same amount and a increase in for any given LMC distance.
The global analysis of Kochanek (1997) carefully and consistently treats the Cepheid data to allow for distance estimates including the systematic uncertainties we have discussed so far. Again, the distance to the LMC is fixed at . In Table 8 we present our estimates of given the distance moduli derived by Kochanek (1997) and presented in his Table 3. We have added 0.05 mag to the NGC 3368 distance modului presented there to correct for the WFPC2 “long/short” exposure effect, which was not included in his analysis of the Cepheids in that galaxy (this is just a first approximation; the correct method would be to repeat his analysis with the fainter NGC 3368 Cepheid magnitudes). With that caveat, we have considered two of his models, the first being Model 0 which derives distances in the “standard” method, with a global solution for the relation and correct treatment of correlated errors. As Table 8 shows, the estimates are generally fainter in this model, in line with the suggestion of Tanvir (1996), leading to a modest increase in . The second model we consider is Model 3-15, which also derives a global solution, but further allows for effects of metallicity and positive extinction. The result is again generally to decrease the host galaxy distances, and lead to a fainter and higher . However, we note that the estimates of are not consistent with their uncertainties (which are derived from the quadrature sum of the uncertainty in from MLCS and the uncertainty in the Cepheid distance modulus). Furthermore, the dispersion is much larger than the mag expected from the SNe Ia alone; this implies that either the local calibrating SNe Ia are very different from the Hubble-flow SNe Ia (a possibility we feel is unlikely based on their spectra and light curves), or that systematic errors remain in the Cepheid distances derived from this particular model. Further analysis is required.
| SN Ia | Galaxy | PublishedaaPublished refers to estimates based on published distance moduli as described and modified in section 4.2. | Model 0bbThese two columns are from Kochanek (1997). See text for details regarding the models. | Model 3-15bbThese two columns are from Kochanek (1997). See text for details regarding the models. |
|---|---|---|---|---|
| 1998bu | NGC 3368 | |||
| 1990N | NGC 4639 | |||
| 1981B | NGC 4536 | |||
| 1972E | NGC 5253 | |||
| Mean | ||||
These results suggest a systematic uncertainty in the calibrating SNe Ia host galaxy Cepheid distance moduli of mag due to the combined effects of metallicity, extinction and the calibration of the relation. (The resulting uncertainty in is in the opposite sense, mag.) Since definitive results regarding the exact magnitude of these effects are lacking, we just include these effects in our uncertainty, with . Our estimate of the Hubble constant then becomes
| (12) |
5.2.3 Distance to the LMC
The final source of systematic error in the Hubble constant that we consider is the distance to the LMC. All methods to measure which are based on HST Cepheid distances share this systematic uncertainty, so that comparisons in the resulting values between these methods should not include an error component from the LMC distance (i.e., comparisons of HST Cepheid-calibrated measurements should be to the analog of equation 12; if two such measurements disagree, they will disagree regardless of the LMC distance). Formally, our best estimate of the Hubble constant, including the systematic uncertainties discussed above, is given by
| (13) |
Of course, if we wish to compare our value of with those derived from techniques which are independent of the LMC distance (e.g., SNe II expanding photospheres, gravitational lens time delays, Sunyaev-Zel’dovich effect, etc.), we have to provide a best estimate for and perhaps more importantly, its uncertainty. Measurement of quantities derived from the “true” Hubble constant, such as the dynamical age of the Universe, also requires such an estimate.
However, measurements of the LMC distance modulus are notoriously inconsistent, ranging for the most part from to . The value of that we have adopted has recently faced a strong challenge from a “short” LMC distance based on Hipparcos-calibrated red clump stars (Stanek, Zaritsky, & Harris 1998; Udalski 1998) and the study of detached eclipsing binaries such as HV2274 (Guinan et al. 1998), which give and , respectively. However, recent applications of other methods, including Cepheids, RR Lyrae stars, Mira variables, and the SN 1987A ring still yield a wide range of distance moduli, many with inconsistent error bars. As an exercise, we compiled a representative (though not exhaustive) sample of 19 LMC distance moduli published in the last two years (Alcock et al. 1997; Di Benedetto 1997; Feast & Catchpole 1997; Gratton et al. 1997; Panagia et al. 1997; van Leeuwen et al. 1997; Whitelock, van Leeuwen, & Feast 1997; Bergeat, Knapik, & Rutily 1998; Cole 1998; Fernley et al. 1998; Gieren, Fouqué, & Gómez 1998; Gould & Uza 1998; Guinan et al. 1998; Luri et al. 1998a; Luri et al. 1998b; Madore & Freedman 1998; Oudmaijer, Groenewegen, & Schrijver 1998; Reid 1998; Udalski 1998). Naively assuming each measurement to be independent, a Bayesian analysis of these distance estimates in the spirit of Press (1997) yields a narrow probability density function (PDF) for the mean, with , as shown in Figure 13. If we modify the analysis so that each distance method only gets one “vote” to reduce correlated errors, the PDF becomes quite asymmetric with , where the stated value is the peak of the PDF and the upper and lower uncertainties are derived from the points at which the cumulative probability is 0.841 and 0.159. This analysis does not provide a reason for the discrepant values, and is subject to additional correlated errors that may still be lurking. Nevertheless, given the incompatible data, the method provides a reasonable and statistically defensible way to estimate , and its uncertainty.

As the current best estimate of the LMC distance modulus, we adopt mag. Others will undoubtedly have differing estimates, and can use equation 13 to determine the resulting Hubble constant. With our choice, we have as the estimate of the fiducial absolute magnitude, including all identified systematic uncertainties, . Thus, our final estimate of the Hubble constant incorporating this total systematic uncertainty is
| (14) |
5.3. Implications
One direct implication of our derived Hubble constant is an estimate of the dynamical age of the universe, , assuming a Friedmann-Robertson-Walker cosmology. In an , Einstein-de Sitter universe, . However, evidence from SNe Ia at high redshifts provides a strong observational constraint on this product, with Riess et al. (1998a) deriving and Perlmutter et al. (1999) obtaining . Assuming that systematic errors in these estimates are small (discussed extensively in both papers), we have
| (15) |
This estimate is very nearly the same as that presented by Riess et al. (1998), and is in good accord with measurements of the ages of the oldest objects in the Universe (see Chaboyer 1998 for a review). The solution to the cosmological “age crisis” is not to be found in alternative estimates of , but rather in discarding the cosmology (which would require Gyr).
The supernovae can also tell us about the structure of groups and clusters. For instance, Graham et al. (1997) obtained a Cepheid distance to NGC 3351 which is also a member of the Leo I group along with NGC 3368. However, the distance modulus they derive, , is almost 0.4 mag closer than the Tanvir et al. (1995) distance for NGC 3368, . This corresponds to a 2 Mpc difference in the line of sight distance to these galaxies, even though their projected separation is 41 arcmin, or about 120 kpc at the inferred distance. Graham et al. (1997) suggest one alternative explanation is that the -band NGC 3368 Cepheid photometry of Tanvir et al. (1995) is systematically faint, which would lead to an underestimated extinction and an overestimated distance. Metallicity corrections to the Cepheid distances do not change this conclusion, as both NGC 3368 and NGC 3351 are similarly metal rich (Kennicutt et al. 1998). If we adopt the mean from the three other calibrators, SN 1998bu can in principle be used to test the Tanvir et al. (1995) distance. However, this procedure yields , and the uncertainty is too large to provide a definitive test.
This discussion does point out an important attribute of our analysis. We have assumed that the internal errors in the Cepheid distances (i.e., excluding those factors we discuss in Section 5.2) are accurately estimated. While we have tried to create a uniform set of distance moduli from the published values, a better procedure would be to reanalyze all the Cepheid data from the different groups in a completely consistent manner, beginning with the raw HST images. The Key Project team is doing this (Gibson et al. 1999); if needed, revised distance moduli for the SN calibrators can then be used in Table 6 to determine a new estimate for and .
More information about the structure of the Leo I group can be determined by relying on the supernovae themselves. For instance, the galaxy NGC 3389, host of the SN Ia 1967C, is sometimes considered a member of the Leo I group, though various group-finding algorithms disagree about its inclusion (Schneider 1989). We have used MLCS to analyze the photoelectric light curve of SN 1967C (de Vaucouleurs 1968), and conclude that NGC 3389 is at , placing it significantly farther away than the other Leo I group galaxies.
We can also compare the distance of NGC 3368 with that of NGC 3627, in the Leo triplet, located on the sky roughly 8 degrees from the Leo I group. NGC 3627 was the host of the SN Ia 1989B, which had a light curve similar to that of SN 1998bu. From our MLCS analysis of the SN 1989B we derive , mag, and mag, yielding . Combined with our result for SN 1998bu, , we see that NGC 3627 is most likely mag closer than NGC 3368, though there is a bit of uncertainty (arising from the correlated uncertainties in the MLCS analysis of each supernova). Since the supernovae only tell us the distances of their hosts, without further information we cannot determine the relationship between the Leo I Group and the Leo triplet as a whole. HST data has been taken to measure a Cepheid distance to NGC 3627 directly; with our analysis of SN 1989B and taking derived from all four calibrators, we predict the distance modulus for NGC 3627, . In a very recent preprint, Saha et al. (1999) report their Cepheid distance to NGC 3627, with the result , in excellent agreement with our expectation. With this new Cepheid distance, we will be able to use SN 1989B as a calibrator in the future; including it in the analysis presented here would decrease our estimate by merely 0.3 .
This discussion strengthens our opinion that the sample of calibrating SNe Ia should be restricted to those for which Cepheid distances have been directly determined, rather than relying on indirect association with other members of a group or cluster. Suntzeff et al. (1999) make this point with two SNe Ia in the Fornax cluster, SN 1980N in NGC 1316 and SN 1992A in NGC 1380. Adopting the Cepheid distance to NGC 1365 (Silbermann et al. 1999; Madore et al. 1999) as the distance to the cluster and these two galaxies in particular leads to a correlated systematic effect on the SN Ia calibration. The analysis of Suntzeff et al. (1999) indicates that NGC 1365 is probably foreground to both NGC 1316 and NGC 1380 by mag. We have analyzed the SN Ia in both of these galaxies with MLCS and concur that NGC 1365 is closer than NGC 1316 by mag. Our result for NGC 1380 is slightly different, with the MLCS analysis suggesting NGC 1365 is closer than NGC 1380 by only mag. Nevertheless, this is exactly the sort of systematic error we wish to avoid, since the number of calibrators is small and systematic errors in any of them can significantly affect the mean.
6. Conclusion
We have presented extensive photometric and spectroscopic observations of SN 1998bu as well as an MLCS analysis to determine the intrinsic luminosity (relative to the fiducial) of the supernova and the extinction along the line of sight. Using the Cepheid distance to NGC 3368 and three other SN Ia host galaxies, we have calibrated the absolute magnitude of our fiducial SN Ia, and applied this calibration to a set of 42 distant SNe Ia to derive a Hubble constant, , including systematic uncertainties such as in the distance to the LMC. The statistical uncertainty in our estimate ( mag) arises from the fact that we have only 4 local calibrators; this uncertainty will be reduced by more SNe Ia occurring in galaxies with HST Cepheid distances, or more controllably by measuring more Cepheid distances to the host galaxies of well-observed SNe Ia (SN 1998aq in NGC 3982 is an excellent target, for example). Reducing the systematic uncertainty in the Hubble constant ( mag) will be more difficult as it will entail a better understanding of the Cepheid distance scale and most importantly, a definitive distance modulus for the LMC. Nevertheless, we are optimistic that these reductions are possible, and eagerly await the day in the not-too-distant future when the Hubble constant is known to better than 10%.
References
- (1)
- (2) Alcock, C., et al. 1997, ApJ, 482, 89
- (3)
- (4) Ardeberg, A., & de Groot, M. 1973, A&A, 28, 295
- (5)
- (6) Ayani, K., Nakatani, H., & Yamaoka, H. 1998, IAU Circ., 6905
- (7)
- (8) Barbon, R., Benetti, S., Cappellaro, E., Rosino, L., & Turatto, M. 1990, A&A, 237, 79
- (9)
- (10) Beaulieu, J. P., et al. 1997, A&A, 318, L47
- (11)
- (12) Bergeat, T. J., Knapik, A., & Rutily, B. 1998, A&A, 332, L53
- (13)
- (14) Bessell, M. S. 1990, PASP, 102, 1181
- (15)
- (16) Boisseau, J. R., & Wheeler, J. C. 1991, AJ, 101, 1281
- (17)
- (18) Bowers, E. J. C., Meikle, W. P. S., Geballe, T. R., Walton, N. A., Pinto, P. A., Dhillon, V. S., Howell, S. B., & Harrop-Allin, M. K. 1997, MNRAS, 290, 663
- (19)
- (20) Branch, D., Lacy, C. H., McCall, M. L., Uomoto, A., Wheeler, J. C., Wills, B. J., & Sutherland, P. G. 1983, ApJ, 270, 123
- (21)
- (22) Branch, D. 1998, ARA&A, 36, 17
- (23)
- (24) Branch, D., & Miller, D. L. 1993, ApJ, 405, L5
- (25)
- (26) Buta, R. J., & Turner, A. 1983, PASP, 95, 72
- (27)
- (28) Cardelli, J. A., Clayton, G. C., & Mathis, J. S. 1989, 345, 245
- (29)
- (30) Carter, B. S., & Meadows, V. S. 1995, MNRAS, 276, 734
- (31)
- (32) Centurion, M., Bonifacio, P., Walton, N., & King, D. 1998, IAU Circ., 6918
- (33)
- (34) Chaboyer, B. 1998, Physics Reports, in press (astro-ph/9808200)
- (35)
- (36) Chiosi, C., Wood, P. R., & Capitanio, N. 1993, ApJS, 86, 541
- (37)
- (38) Cole, A. A. 1998, ApJ, 500, L137
- (39)
- (40) de Vaucouleurs, G. 1968, Contrib. McDonald Obs., 426
- (41)
- (42) de Vaucouleurs, G., et al. 1991, in Third Reference Catalogue of Bright Galaxies, New York: Springer-Verlag
- (43)
- (44) Di Benedetto, G. P. 1997, ApJ, 486, 60
- (45)
- (46) Efstathiou, G., Bridle, S. L., Lasenby, A. N., Hobson, M. P., & Ellis, R. S. 1999, MNRAS, submitted (astro-ph/9812226)
- (47)
- (48) Elias, J. H., Frogel, J. A., Hackwell, J. A., & Persson, S. E. 1981, ApJ, 251, L13
- (49)
- (50) Elias, J. H., Frogel, J. A., Matthews, K., & Neugebauer, G. 1982, AJ, 87, 1029
- (51)
- (52) Elias, J. H., Matthews, K., Neugebauer, G., & Persson, S. E. 1985, ApJ, 296, 379
- (53)
- (54) Fabricant, D., Cheimets, P., Caldwell, N., & Geary, J. 1998, PASP, 110, 79
- (55)
- (56) Feast, M. W., & Catchpole, R. M. 1997, MNRAS, 286, L1
- (57)
- (58) Fernley, J., Barnes, T. G., Skillen, I., Hawley, S. L., Hanley, C. J., Evans, D. W., Solano, E., & Garrido, R. 1998, A&A, 330, 515
- (59)
- (60) Filippenko, A. V. 1982, PASP, 94, 715
- (61)
- (62) Filippenko, A. V. 1997, ARA&A, 35, 309
- (63)
- (64) Filippenko, A. V., Porter, A. C., Sargent, W. L. W., & Schneider, D. P. 1986, AJ, 92, 1341
- (65)
- (66) Filippenko, A. V., et al. 1992a, ApJ, 384, L15
- (67)
- (68) Filippenko, A. V., Richmond, M. W., Branch, D., Gaskell, M., Herbst, W., Ford, C. H., Treffers, R. R., Matheson, T., Ho, L. C., Dey, A., Sargent, W. L. W., Small, T. A., & Van Breugel, W. J. M. 1992b, AJ, 104, 1543
- (69)
- (70) Freedman, W. L., & Madore, B. F. 1990, ApJ, 365, 186
- (71)
- (72) Freedman, W. L., et al. 1994, Nature, 371, 757
- (73)
- (74) Freedman, W. L., Mould, J. R., Kennicutt, R. C., & Madore, B. F. 1998, to appear in “Cosmological Parameters and the Evolution of the Universe”, IAU Symposium 183 (astro-ph/9801080)
- (75)
- (76) Frogel, J. A., Gregory, B., Kawara, K., Laney, D., Phillips, M. M., Terndrup, D., Vrba, F., & Whitford, A. E. 1987, ApJ, 315, L129
- (77)
- (78) Garnavich, P. M., et al. 1998a, ApJ, 493, L53
- (79)
- (80) Garnavich, P. M., et al. 1998b, ApJ, in press (astro-ph/9806396)
- (81)
- (82) Gibson, B. K., et al. 1999, in preparation
- (83)
- (84) Gieren, W. P., Fouqué, P., & Gómez, M. 1998, ApJ, 496, 17
- (85)
- (86) Giovanelli, R., Haynes, M. P., Freudling, W., da Costa, L. N., Salzer, J. J., & Wegner, G. 1998, ApJ, 505, L91
- (87)
- (88) Goldhaber, G., et al. 1997, in Thermonuclear Supernovae, eds. Ruiz-Lapuente, P., Canal, R., & Isern, J., Netherlands: Kluwer Academic Publishers, 777
- (89)
- (90) Gould, A. 1994, ApJ, 426, 542
- (91)
- (92) Gould, A., & Uza, O. 1998, ApJ, 494, 118
- (93)
- (94) Graham, J. A., et al. 1997, ApJ, 477, 535
- (95)
- (96) Gratton, R. G., Fusi Pecci, F., Carretta, F., Clementini, G., Corsi, C. E., & Lattanzi, M. 1997, ApJ, 491, 749
- (97)
- (98) Guinan, E. F., Fitzpatrick, E. L., DeWarf, L. E., Maloney, F. P., & Maurone, P. A. 1998, ApJ, 509, L21
- (99)
- (100) Hamuy, M., Phillips, M. M., Maza, J., Wischnjewsky, M., Uomoto, A., Landolt, A. U., & Khatwani, R. 1991, AJ, 102, 208
- (101)
- (102) Hamuy, M., et al. 1993, AJ, 106, 2392
- (103)
- (104) Hamuy, M., Phillips, M. M., Maza, J., Suntzeff, N. B., Schommer, R. A., & Avilés, R. 1995, AJ, 109, 1
- (105)
- (106) Hamuy, M., Phillips, M. M., Suntzeff, N. B., Schommer, R. A., Maza, J., & Avilés, R. 1996a, AJ, 112, 2391
- (107)
- (108) Hamuy, M., Phillips, M. M., Suntzeff, N. B., Schommer, R. A., Maza, J., & Avilés, R. 1996b, AJ, 112, 2398
- (109)
- (110) Hamuy, M., et al. 1996c, AJ, 112, 2408
- (111)
- (112) Hamuy, M., Phillips, M. M., Suntzeff, N. B., Schommer, R. A., Maza, J., Smith, R. C., Lira, P., & Avilés, R. 1996d, AJ, 112, 2438
- (113)
- (114) Hamuy, M., & Pinto, P. 1999, AJ, to appear in Harmonizing Cosmic Distance Scales in a Post-Hipparcos Era (astro-ph/9812084)
- (115)
- (116) Harris, W. E., Fitzgerald, M. P., & Reed, B. C. 1981, PASP, 93, 507
- (117)
- (118) Hatano, K., Branch, D., & Deaton, J. 1998, ApJ, 502, 177
- (119)
- (120) Hatano, K., Branch, D., Fisher, A., Baron, E., & Filippenko, A. V. 1999, in preparation
- (121)
- (122) Hill, R. J., et al. 1998, ApJ, 496, 648
- (123)
- (124) Hunt, L. K., Mannucci, F., Testi, L., Migliorini, S., Stanga, R. M., Baffa, C., Lisi, F., & Vanzi, L. 1998, AJ, 115, 2594
- (125)
- (126) Jerjen, H., & Tammann, G. A. 1993, A&A, 276, 1
- (127)
- (128) Johnson, H. L., MacArthur, J. W., & Mitchell, R. I. 1968, ApJ, 152, 465
- (129)
- (130) Kennicutt, R. C., et al. 1998, ApJ, 498, 181
- (131)
- (132) Kim, A., Goobar, A., & Perlmutter, S. 1996, PASP, 108, 190
- (133)
- (134) Kirshner, R. P., Oke, J. B., Penston, M. V., & Searle, L. 1973, ApJ, 185, 303
- (135)
- (136) Kirshner, R. P., & Oke, J. B. 1975, ApJ, 200, 574
- (137)
- (138) Kirshner, R. P., et al. 1993, ApJ, 415, 589
- (139)
- (140) Kochanek, C. S. 1997, ApJ, 491, 13
- (141)
- (142) Kowal, C. T. 1968, AJ, 73, 1021
- (143)
- (144) Landolt, A. U. 1992, AJ, 104, 340
- (145)
- (146) Lauer, T. R., & Postman, M. 1994, ApJ, 425, 418
- (147)
- (148) Leibundgut, B. 1989, PhD thesis, University of Basel
- (149)
- (150) Leibundgut, B., Kirshner, R. P, Filippenko, A. V., Shields, J. C., Foltz, C. B., Phillips, M. M., & Sonneborn, G. 1991a, ApJ, 371, L23
- (151)
- (152) Leibundgut, B., Tammann, G. A., Cadonau, R., & Cerrito, D. 1991b, A&AS, 89, 537
- (153)
- (154) Leibundgut, B., et al. 1993, AJ, 105, 301
- (155)
- (156) Leibundgut, B., et al. 1996, ApJ, 466, L21
- (157)
- (158) Lineweaver, C. H. 1998, ApJ, 505, L69
- (159)
- (160) Lira, P. 1995, Master’s Thesis, University of Chile
- (161)
- (162) Lira, P., et al. 1998, AJ, 115, 234
- (163)
- (164) Luri, X., Gómez, A. E., Torra, J., Figueras, F., & Mennessier, M. O. 1998, A&A, 335, L81
- (165)
- (166) Luri, X., Torra, J., Figueras, F., Gómez, A. E., Goupil, M. J., & Beaulieu, J. P. 1998, in press (astro-ph/9812098)
- (167)
- (168) Lynden-Bell, D., & Lahav, O. 1988, in Large-Scale Motions in the Universe, eds. V. C. Rubin, & G. V. Coyle, Princeton: Princeton University Press
- (169)
- (170) Madore, B. F., & Freedman, W. L. 1991, PASP, 103, 933
- (171)
- (172) Madore, B. F., & Freedman, W. L. 1998, ApJ, 492, 110
- (173)
- (174) Madore, B. F., et al. 1999, ApJ, in press (astro-ph/9812157)
- (175)
- (176) Massey, P., Strobel, K., Barnes, J. V., & Anderson, E. 1988, ApJ, 328, 315
- (177)
- (178) Meikle, P., Hernandez, M., Fassia, A., & Iglesias, J. 1998, IAU Circ., 6905
- (179)
- (180) Meikle, P., & Hernandez, M. 1999, Journal of the Italian Astronomical Society, in press (astro-ph/9902056)
- (181)
- (182) Miller, D. L., & Branch, D. 1992, AJ, 103, 379
- (183)
- (184) Mould, J. R., et al. 1999, in preparation
- (185)
- (186) Munari, U., & Zwitter, T. 1997, A&A, 318, 269
- (187)
- (188) Munari, U., Barbon, R., Tomasella, L., & Rejkuba, M. 1998, IAU Circ., 6902
- (189)
- (190) Nakano, S., & Aoki, M. 1998, IAU Circ., 6899
- (191)
- (192) Nevalainen, J., & Roos, M. 1998, A&A, 339, 7
- (193)
- (194) Nrgaard-Nielsen, H. U., Hansen, L., Jrgensen, H. E., Aragón Salamanca, A., Ellis, R. S., & Couch, W. J. 1989, Nature, 339, 523
- (195)
- (196) Nugent, P., Phillips, M., Baron, E., Branch, D., & Hauschildt, P. 1995, ApJ, 455, L147
- (197)
- (198) Nugent, P., Kim, A., & Perlmutter, S. 1999, in preparation
- (199)
- (200) Oudmaijer, R. D., Groenewegen, M. A. T., & Schrijver, H. 1998, MNRAS, 294, L41
- (201)
- (202) Panagia, N., et al. 1997, BAAS, 191, 1909
- (203)
- (204) Patat, F., Benetti, S., Cappellaro, E., Danziger, I. J., Della Valle, M., Mazzali, P. A., & Turatto, M. 1996, MNRAS, 278, 111
- (205)
- (206) Perlmutter, S., et al. 1995, ApJ, 440, L41
- (207)
- (208) Perlmutter, S., et al. 1998, Nature, 391, 51
- (209)
- (210) Perlmutter, S., et al. 1999, ApJ, in press (astro-ph/9812133)
- (211)
- (212) Perlmutter, S., Turner, M. S., & White, M. 1999, Phys. Rev. Lett., submitted (astro-ph/9901052)
- (213)
- (214) Persson, S. E., Murphy, D. C., Krzeminski, W., Roth, M., & Rieke, M. J. 1998, AJ, 116, 2475
- (215)
- (216) Phillips, M. M., Wells, L. A., Suntzeff, N. B., Hamuy, M., Leibundgut, B., Kirshner, R. P., & Foltz, C. B. 1992, AJ, 103, 1632
- (217)
- (218) Phillips, M. M. 1993, ApJ, 413, L105
- (219)
- (220) Phillips, M. M., Lira, P., Suntzeff, N. B., Schommer, R. A., Hamuy, M., & Maza, J. 1999, in preparation
- (221)
- (222) Pierce, M. J., & Jacoby, G. H. 1995, AJ, 110, 2885
- (223)
- (224) Press, W. H. 1997, in Unsolved Problems in Astrophysics, eds. J. N. Bahcall and J. P. Ostriker, Princeton: Princeton University Press, 49
- (225)
- (226) Reid, I. N. 1998, AJ, 115, 204
- (227)
- (228) Riess, A. G., Davis, M., Baker, J., & Kirshner, R. P. 1997a, ApJ, 488, L1
- (229)
- (230) Riess, A. G., et al. 1997b, AJ, 114, 722
- (231)
- (232) Riess, A. G., Press, W. H., & Kirshner, R. P. 1995a, ApJ, 438, L17
- (233)
- (234) Riess, A. G., Press, W. H., & Kirshner, R. P. 1995b, ApJ, 445, L91
- (235)
- (236) Riess, A. G., Press, W. H., & Kirshner, R. P. 1996a, ApJ, 473, 88
- (237)
- (238) Riess, A. G., Press, W. H., & Kirshner, R. P. 1996b, ApJ, 473, 588
- (239)
- (240) Riess, A. G., et al. 1998a, AJ, 116, 1009
- (241)
- (242) Riess, A. G., Nugent, P., Filippenko, A. V., Kirshner, R. P., & Perlmutter, S. 1998b, ApJ, 504, 935
- (243)
- (244) Riess, A. G., et al. 1999, AJ, 117, 707
- (245)
- (246) Roos, M., & Harun-or-Rashid, S. M. 1999, A&A, submitted (astro-ph/9901234)
- (247)
- (248) Saha, A., Sandage, A., Labhardt, L., Schwengeler, H., Tammann, G. A., Panagia, N., & Macchetto, F. D. 1995, ApJ, 438, 8
- (249)
- (250) Saha, A., Sandage, A., Labhardt, L., Tammann, G. A., Macchetto, F. D., & Panagia, N. 1996, ApJ, 466, 55
- (251)
- (252) Saha, A., Sandage, A., Labhardt, L., Tammann, G. A., Macchetto, F. D., & Panagia, N. 1997, ApJ, 486, 1
- (253)
- (254) Saha, A., Sandage, A., Tammann, G. A., Labhardt, L., Macchetto, F. D., & Panagia, N. 1999, ApJ, in press (astro-ph/9904389)
- (255)
- (256) Sandage, A., & Tammann, G. A. 1993, ApJ, 415, 1
- (257)
- (258) Sandage, A., Saha, A., Tammann, G. A., Panagia, N., & Macchetto, F. D. 1992, ApJ, 401, L7
- (259)
- (260) Sasselov, D. D., et al. 1997, A&A, 324, 471
- (261)
- (262) Savage, B., & Mathis, J. 1979, ARA&A, 17, 73
- (263)
- (264) Schaefer, B. 1995, ApJ, 450, L5
- (265)
- (266) Schaefer, B. E. 1998, ApJ, 509, 80
- (267)
- (268) Schlegel, D. J., Finkbeiner, D. P., & Davis, M. 1998, ApJ, 500, 525
- (269)
- (270) Schmidt, B. P., et al. 1998, ApJ, 507, 46
- (271)
- (272) Silbermann, N. A., et al. 1999, ApJ, in press (astro-ph/9806017)
- (273)
- (274) Smoot, G. F., et al. 1992, ApJ, 396, L1
- (275)
- (276) Stanek, K. Z. 1998, ApJ, submitted (astro-ph/9802307)
- (277)
- (278) Stanek, K. Z., Zaritsky, D., & Harris, J. 1998, ApJ, 500, L41
- (279)
- (280) Stift, M. J. 1995, A&A, 301, 776
- (281)
- (282) Suntzeff, N. B., et al. 1999, AJ, 117, 1175
- (283)
- (284) Szentgyorgyi, A. H., et al. 1999, in preparation
- (285)
- (286) Tammann, G. A. 1998, to be published in “General Relativity”, 8th Marcel Grossmann Symposium, ed. T. Piran, Singapore: World Scientific (astro-ph/9805013)
- (287)
- (288) Tammann, G. A., & Leibundgut, B. 1990, A&A, 236, 9
- (289)
- (290) Tanvir, N. R., Shanks, T., Ferguson, H. C., & Robinson, D. R. T. 1995, Nature, 377, 27
- (291)
- (292) Tanvir, N. R. 1996, in The Extragalactic Distance Scale, eds. Livio, M., Donahue, M., & Panagia, N., United Kingdom: Cambridge University Press, 91 (astro-ph/9611027)
- (293)
- (294) Tegmark, M. 1999, ApJ, submitted (astro-ph/9809201)
- (295)
- (296) Tollestrup, E., et al. 1999, in preparation
- (297)
- (298) Tripp, R. 1998, A&A, 331, 815
- (299)
- (300) Turner, A., et al. 1998, ApJ, 505, 207
- (301)
- (302) Udalski, A. 1998, Acta Astronomia, 48, 383
- (303)
- (304) van Leeuwen, F., Feast, M. W., Whitelock, P. A., & Yudin, B. 1997, MNRAS, 287, 955
- (305)
- (306) Villi, M. 1998, IAU Circ., 6899
- (307)
- (308) Wells, L. A., et al. 1994, AJ, 108, 2233
- (309)
- (310) Wheeler, J. C., Höflich, P., Harkness, R. P., & Spyromilio, J. 1998, ApJ, 496, 908
- (311)
- (312) Whitelock, P. A., van Leeuwen, F., & Feast, M. W. 1997, in Hipparcos Venice ’97, ed. Battrick, B., Netherlands: ESA Publications Division, 213 (astro-ph/9706096)
- (313)
- (314) White, M. 1998, ApJ, 506, 495
- (315)
- (316) Zehavi, I., Riess, A. G., Kirshner, R. P, & Dekel, A. 1998, ApJ, 503, 483
- (317)