Reddening of microlensed LMC stars vs. the location of the lenses
Abstract
We propose an observational test that can break the degeneracy of two main classes of microlensing models to the Magellanic Clouds: (a) the lenses are located in the Galactic halo, and (b) the lenses are located in the LMC disk. The source stars in the latter (self-lensing) models tend to be at the far side or behind the LMC disk, thus experience more reddening and extinction by dust in the LMC disk than ordinary stars in a nearby line of sight. Clearly such bias would not occur in the macho halo lensing models. We show that this reddening effect is at a level readily observable for the present 30 or so microlensing alerts fields, either with multi-band photometry from a good seeing site, or more definitively with ultra-violet (UV) spectroscopy with Space Telescope Imaging Spectrograph (STIS). Stars behind the LMC dust layer should stand out as UV-faint objects (by more than 1 mag than average stars in the LMC). HST can also resolve numerous faint neighbouring stars within a few arcsecs of a lensed source, hence remove blending in these crowded regions and build a reddening map to control the patchiness of dust.
1 Introduction
One of the main puzzles of Galactic microlensing surveys is the poorly determined location of the lens population of the events towards the Magellanic Clouds. Currently there are two popular views on the issue: (a) the lenses are located in the halo, hence are likely baryonic dark matter candidates (Alcock et al. 1997); (b) both the lenses and sources are part of the Magellanic Clouds, hence are stars orbiting in the potential well of the Clouds (Sahu 1994, Wu 1994, Zhao 1998a,b, 1999a,b, Weinberg 1999). The amount of star-star lensing is sensitive to assumptions of the structure and equilibrium of the Magellanic Clouds (Gould 1995, Zhao 1998a, Aubourg et al. 1999, Salati et al. 1999, Gyuk & Gates 1999, Gyuk, Dalal & Griest 1999, Evans & Kerins 1999). For star-star self-lensing in the LMC to be efficient, the LMC should be fairly thick in the line of sight. To break the degeneracy of the models, we should design observations which are sensitive to the location of the lens and the thickness of the LMC. Several lines of attack have been proposed in Zhao (1999a). For example, a direct signature of self-lensing of a dense, but extended stellar component, is that the lensed stars should be at the far side of the component, hence somewhat fainter than the unlensed ones. There are tantalizing evidences for this distance effect playing a role both in the events towards the Galactic bulge/bar, particular two clump giant events OGLE-BLG-3 and OGLE-BLG-10 (Stanek 1995), and in the events towards the LMC, particularly the clump giant event MACHO-LMC-1 (cf. Zhao et al. 1999). Unlike the end-on cigar-shaped Galactic bar, the LMC is an irregular disk galaxy and it is close to face-on, so its front-to-back thickness is hard to resolve with photometric or trigonometric parallax if the LMC is indeed thin: a pc spread in the line of sight translates to mag in distance modulus, or micro arcsec in parallax.
Here we propose a more practical test for the above two popular models of the location of the lenses. We propose to measure the distribution of the reddening of individual LMC stars in small patchs of sky centered on the microlensed stars. Basicly some kind of “reddening parallaxes” can be derived for these stars from the line of sight depth effect, i.e., the dust layer in the LMC makes stars behind the layer systematicly redder than those in front of the layer. This is a variation of the well-known technique of differentiating the near/far side and the trailing/leading of a spiral arm with the dust lane that runs across a close-to-edge-on spiral galaxy. Our method involves obtaining multi-band photometry and/or spectroscopy of fairly faint (mag) stars during or well after microlensing.
After a brief account of reddening in the LMC §2, we describe our basic argument about the excess reddening of microlensed sources in §3. We discuss several complications of the method (e.g. patchiness of dust) in §4. We model the dependence on the thickness of the dust layer in §5. We summarize the results and the observational strategy in §6.
2 Dust layer of the LMC and the Galactic foreground
The internal extinction in the LMC is fairly small because of its close to face-on geometry and it is patchy. Hence it is a subtle effect that we propose to measure. Internal extinction of the LMC has been studied many times in the past (e.g., Hill et al. 1994, Oestreicher & Schmidt-Kaler 1996). Harris et al. (1997) select a sample of a few thousand OB stars from their LMC UBVI multi-band photometric survey, and they map out dust patches in the LMC. They find that extinction largely follows a thin disk with a FWHM of about pc, and mag., averaged over the whole LMC including the extinction by the Galactic foreground. The internal extinction (discounting Galactic foreground) in the optical U band
| (1) |
Stronger absorption is expected in the ultra-violet.
While dust distribution in the LMC and the Galactic foreground is known to be very clumpy and extinction is patchy, there is surprisingly little variation on sub-pc scale. Harris et al. find strong variations of reddenings among members of OB associations within a few arcmins of each other in the LMC (their Figure 13). About 5% of the lines of sight have low-extinction “holes”. Typical size of the dust patches is between to ; is about pc at the LMC’s distance.
The Galactic foreground extinction towards the LMC has also been mapped out by Oestreicher et al. (1995) with foreground stars. They find reddening varies from 0 to mag. across the surface of the LMC with a mean at mag.. Nevertheless the dust patches appear mostly larger than 30’, which translates to about 2pc for a line of sight path of 200pc in the thin layer of Galactic dust.
Extinction has also been studied in great detail towards the Baade’s window (, ), a relatively clear field near the Galactic center. Stanek (1996) uses red clump giants in the Galactic bulge from the OGLE microlensing survey to map out the extinction, which is due to dust patches within about kpc of the Sun (Arp 1965). The extinction varies from about mag to mag (99% confidence interval) across a field. While dust patches of are clearly visible, we find (cf. Fig. 1) that the variation of of neighbouring patches of to is rarely more than 20%-30%. The only modest variation on these scales in this line of sight means few clouds of size pc to pc.
3 Basic signal
Consider the effects of placing a thin layer of dust in the mid-plane of a relatively thicker stellar disk of the LMC (cf. Fig. 2); thin stellar disk models are less interesting because they do not provide enough microlensing events (Gould 1995). Here we assume a uniform stellar disk of the LMC, much thicker than the clumpy dust layer; the thickness is pc and pc respectively. Now nearly 50% of the LMC stars are in front of the dust layer, hence free from reddening (always discounting reddening by the Galactic dust layer in the solar neighbourhood unless otherwise specified). Another nearly 50% of the LMC stars are at the back the dust layer, hence reddened by some measurable amount. In between there is a negligible fraction of the stars reddened by an intermediate amount.
Now suppose that all current 30 microlensing events towards the LMC are due to machos, the we observe about lensed sources in front of the dust layer with negligible reddening, and sources behind with some measurable amount of reddening.
In comparison, if the lenses were in the LMC disk, then there would be a higher probability, say , of finding sources behind the dust layer than the probability, , of finding sources in front. It is a simple calculation to show that for a uniform slab model of the stellar disk of the LMC, and for a -disk. So star-star self-lensing models would predict only about stars out of the 30 stars to be in front of the dust layer with only the Galactic foreground reddening (cf. Fig. 2).
That self-lensing models grossly under-predict the number of microlensed stars with the Galactic foreground reddening is the main signal that differentiate them with macho-lensing models. A difference at about level is expected for the current 30 or so microlensing events. It appears that a long-term study of the reddening distribution of microlensed stars towards the Magellanic Clouds can set firm limit on self-lensing and the fraction of machos in the halo; a quantitative analysis is given in Zhao (1999c).
4 Practical issues and solutions
The above arguments are robust. The key condition is that any measurement error of the reddening is small enough to separate stars with only Galactic foreground reddening from those with Galactic plus LMC reddening confidently (cf. Fig. 2). The arguments apply to a variety of star and patchy extinction distributions with a few conditions.
-
•
They are insensitive to the thickness and vertical profile of the stellar disk as long as it is much thicker than the dust layer. This is to be examined in detail in §5.
-
•
They are insensitive to the patchiness of the dust layer of the LMC as long as the LMC dust layer has very few “holes”; a star behind such a hole can be confused with one in front of the hole as far as reddening is concerned; this happens perhaps about 5% of the time (Harris et al.).
-
•
They are insensitive to the patchiness of the dust layer of the Galaxy as long as the Galactic foreground reddening is indeed smooth on scale (Oestreicher et al. 1995).
-
•
They are insensitive to self-extinction in a very localized dusty cocoon as long as we avoid mass-losing AGB stars and early-type stars in star-forming regions; better choices might be Red Giant Branch and Clump stars and late type bright main sequence stars since they are generally old enough to drift away from the dusty cocoons at their birth place.
To check the validity of these conditions, we can use random unlensed stars in the immediate neighbourhood of the lensed stars to map out the dust patches in the LMC and Galactic foreground. Polarization maps or existing HI and CO maps of the LMC would also be helpful for this purpose. This way we can identify and stay away from regions with unmeasurably low extinction. We should exclude microlensing candidates which happen to fall in low-extinction holes with unmeasurable difference between stars in front and stars behind the LMC dust layer. We can then apply the Galactic foreground subtraction to individual stars in the remaining sample. The reddening distribution of microlensed stars can then be analyzed for signs of deficiency of “reddening-free” stars, an indication of self-lensing.
Existing photometry of the microlensing survey fields are typically in one or two broad passbands. This is generally not enough for accurate determination of reddening. Reddening can be determined by constructing reddening-free indices with photometry of three to seven broad bands, or with low resolution spectroscopy; e.g., Terndrup et al. (1995) show that reddening towards the Baade’s window of the Galactic bulge can be derived from the index. Typical accuracy is about mag. in with these methods.
A practical definition of low-extinction holes might be regions with LMC internal extinction mag.; these regions cover perhaps on the order 10% of the surface of the LMC. Harris et al. show that the reddening of individual OB stars can be determined with UBVI photometry to about mag., or about 30% of the average internal extinction of the LMC disk mag.
A way to reduce variation is to select random unlensed stars as close to the microlensing line of sight as possible. This way they are likely to share the same dust patch. The dust maps of Oestreicher et al. (1995) suggest that Galactic foreground extinction is likely smooth on scale or smaller, and can be subtracted out accurately. For the dust in the LMC, it appears safe to work within small patches of the sky of scale, which corresponds to about pc in the LMC, and less than pc in the solar neighbourhood. At these scales variations of reddening are likely at 10%-20% level among stars behind the dust layer (cf. Fig. 1). Such low-level variations would hardly affect our results since there would be little chance of mis-classifying a star at the back of the LMC dust layer as a star in front of the layer, even after allowing for measurement errors at 30% level (cf. Fig. 2). It is challenging to find enough bright unblended LMC stars from the ground in such a tiny patch of the sky, though.
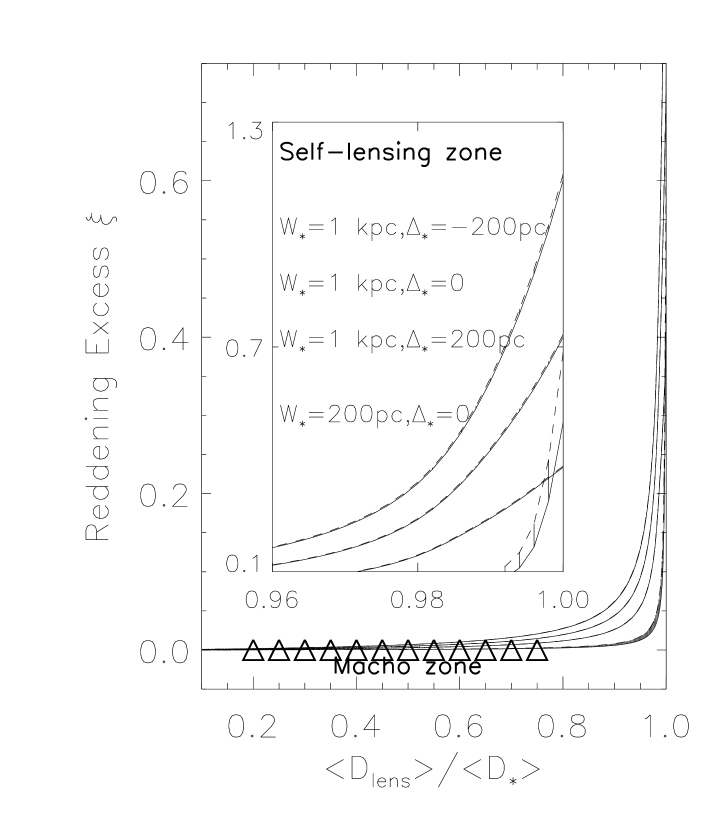
5 Reddening vs. lens location
For the clarity of the argument we adopt a set of simple models for the density distributions of the dust , the lenses and the stars : they are distributed in three uniform layers with a width , and and a mean distance , , . We compute the excess reddening of the microlensed star
| (2) |
where
| (3) | |||||
| (4) |
are the average dust absorptions to the unlensed LMC stars and to the microlensed LMC source stars respectively, and
| (5) |
is the absorption to a star at distance , and
| (6) |
is the probability of locating a star at distance to , and
| (7) |
is the optical depth to a source star at distance .
Fig. 3 shows the excess reddening as a function of the location of the lenses, here the renormalized typical lens distance . Varying the thickness of the dust layer between barely makes any difference as long as the dust layer is thinner than the stellar disk; the effect is marginally visible only for the thin disk model. The excess reddening is a constant 70% for purely self-lensing models () insensitive to the exact values of and as long as . The prediction is somewhat sensitive to a plausible small offset between an unviralized stellar disk and the dust layer ; the excess reddening becomes even stronger if the stellar population of the LMC disk is shifted slightly closer to us than the dust layer. In general, the excess reddening is at 1% level if the lens population is in the halo (the macho zone), and above 40% if the lens population coincides with the stellar disk of the LMC. So the two scenarios are distinguishable if we can control patchiness of reddening and measurement error to better than 20% level.
6 Conclusion and strategy for observations
In summary, we have studied effects of dust layer in the LMC on the microlensing events. We find that self-lensing models of the LMC draw preferentially sources behind the dust layer of the LMC, and hence can be distinguished from the macho-lensing models once the reddening by dust is measured. The effect is insensitive to the exact thickness of the dust layer and the stellar disk (cf. Fig. 3). The deficiency of reddening-free microlensed stars is likely a robust discriminator of the two types of lensing scenarios.
The clumpiness of the dust, together with the fairly large error of reddening vector derived from broad-band photometry, can lead to a large scatter in the relation between reddening and line of sight depth. The finer structure of the patchy extinction in the LMC remains to be studied as well since previous reddening maps of the LMC, e.g., Harris et al.’s map from the sparsely distributed luminous OB stars, are limitted to a spatial sampling of the order (or 10 pc). The trick here is to work only in small patches of the sky of scale, so that stars likely share the same patch of dust cloud (cf. Fig. 1). For example, the amounts of extinction by the Galactic foreground and the LMC change wildly from one microlensing line of sight to another (cf. Fig. 2), but within each small patches the extinction is well-correlated with the line of sight distance, and there is little ambiguity to classify a star as in front of or behind the dust layer if we can measure the reddening. Another trick is to obtain as many lines of sight as possible to beat down all variations (20%-100% due to patchy extinction, and 30%-100% due to measurement error) by a factor , where is the number of microlensing lines of sight. We can differentiate the halo-lensing models from self-lensing models at level with the reddening distribution of current 30 microlensed stars and their neighbours.
It would take about a few nights with a 2.5m telescope at a good seeing site to obtain accurate (1%) photometry in several broad or narrow bands for the present sample of microlensed stars and neighbouring stars in the mag range. Seeing is critical to reach fainter stars. Nevertheless, there are two general problems of ground studies. From the ground the fainter (mag.) LMC stars are often blended in the seeing disk, which results in spurious colors, hence unphysical reddening. A patch of the LMC might show only a handful of mag stars but contain hundreds of fainter objects at the resolution limit of the Hubble Space Telescope (HST). Second it is difficult to access the ultra-violet band from the ground, which is the most sensitive band for measuring dust absorption. For these reasons, photometry or spectroscopy in the ultra-violet from HST is desirable for getting an unambiguous answer.
The author thanks Paul Hodge, Puraga Guhathakurta, David Spergel, Tim de Zeeuw for encouragements, Walter Jaffe and Frank Israel for enlightening discussions and Bryan Miller specially for many helpful comments on the presentation.
References
- (1) Alcock C. et al. 1997, ApJ, 486, 697 (astro-ph/9606165)
- (2) Arp, H. 1965, ApJ, 141, 43
- (3) Aubourg E., Palanque-Delabrouille N., Salati P., Spiro M., Taillet R. 1999, A&A, 347, 850
- (4) Evans W. & Kerins E. 1999, ApJ, 529, 000
- (5) Gould, A. 1995, ApJ, 441, 77
- (6) Gyuk G., Dalal N. & Griest K. 1999, ApJ, submitted
- (7) Gyuk G. & Gates E. 1999, MNRAS, 304, 281
- (8) Harris, J., Zaritsky, D. & Thompson, I., 1997, AJ, 114, 1933
- (9) Hill, R. Madore, B. & Freedman, W. 1994, ApJ, 429, 192
- (10) Oestreicher, M. O., Gochermann, J. & Schmidt-Kaler, T. 1995, A&AS, 112, 495
- (11) Oestreicher, M. O. & Schmidt-Kaler, T. 1996, A&AS, 117, 303
- (12) Sahu A. 1994, Nature, 370, 275
- (13) Salati P., Taillet R., Aubourg E., Palanque-Delabrouille N & Spiro M. 1999, A&A Letters, in press (astro-ph/9904400)
- (14) Stanek, K.Z. 1995, ApJ, 441, L29
- (15) Stanek, K.Z. 1996, ApJ, 460, L37
- (16) Terndrup D., Sadler, E., Rich, R.M. 1995, AJ, 110, 1774
- (17) Weinberg M. 1999, astro-ph/9811204 and astro-ph/9905305
- (18) Wu X.P. 1994, ApJ, 435, 66
- (19) Zhao, H.S. 1998a, MNRAS, 294, 139
- (20) Zhao, H.S. 1998b, ApJ, 500, L49
- (21) Zhao, H.S. 1999a, astro-ph/9902179
- (22) Zhao, H.S. 1999b, ApJ, 526, 000
- (23) Zhao, H.S. 1999c, ApJ, 530, 000
- (24) Zhao, H.S., Graff, D., Guhathakurta, P. 1999, ApJL, submitted