OU-TAP 100
What determines the slope of the colour–magnitude relation of
elliptical galaxies in the hierarchical clustering scenario?
Abstract
We examined the physical origin of the colour–magnitude relation of elliptical galaxies in clusters of galaxies in the hierarchical clustering scenario by using a semi-analytic model of galaxy formation. The semi-analytic model includes some physical processes connected with the galaxy formation, such as merging histories of dark haloes, gas cooling, star formation, supernova feedback, mergers of galaxies, and so on. Therefore it is easier to investigate how the galaxy formation and evolution depend on these physical processes by using the semi-analytic model rather than other numerical methods such as N-body and hydrodynamical simulations. Since the galaxy formation process is very complicated, analysis by using the semi-analytic model is effective. We particularly investigate the effects of the star formation process, the supernova feedback and the UV background on the formation and evolution of elliptical galaxies.
It is suggested by observation that the colour–magnitude relation reflects the metallicity–luminosity relation of galaxies, and that for reproducing the colour–magnitude relation it is important to suppress the chemical enrichment of stars in faint galaxies. For suppressing the chemical enrichment, we propose some solutions. One is assuming a strong supernova feedback. Another is introducing the effect of the UV background radiation. These solutions degenerate, but they may be distinguished by studying other properties of galaxies, like the luminosity function, colour distribution, etc.
Moreover, we find that the supernova feedback model in the starburst which make the bulge component is important when the star formation time-scale in disc is longer than the age of the Universe. On the other hand, when the star formation time-scale is short, the resulting colour–magnitude relation does not depend on such a starburst model because most of stars are formed not by the burst but by the ordinary star formation process in disc.
keywords:
galaxies: elliptical and lenticular, cD – galaxies: evolution – galaxies: formation – large-scale structure of the universe1 INTRODUCTION
It is well known that elliptical galaxies in clusters of galaxies have the tight correlation between their colours and magnitudes (so-called ‘colour–magnitude relation’; hereafter CMR). For example, the rms scatter about the mean CMR is typically 0.04 mag in Virgo and Coma clusters of galaxies. It is a comparable size to observational errors (Bower, Lucey & Ellis 1992). Because it is believed that this tight relation reflects the formation and evolution processes of elliptical galaxies, many people have studied this relationship in order to understand the galaxy formation process.
The traditional scenario of the formation of ellipticals is that a monolithic protogalactic cloud collapses and then forms stars for a short time-scale until blowing the galactic wind (Larson 1974; Arimoto & Yoshii 1986, 1987). In this framework, the conventional interpretation of the CMR of ellipticals is considered as follows. Colour of each galaxy reflects its mean stellar age and metallicity, while luminosity of each galaxy reflects its mass. Therefore, there are two scenarios to make the difference of colours as follows. One is that redder luminous galaxies are formed at earlier stages of cosmological structure formation, and bluer faint galaxies are formed recently. Another scenario is that elapsed time of redder galaxies between the beginning of star formation and the epoch of galactic wind is longer than that of bluer faint galaxies, then more metal-rich stars are formed in luminous galaxies. Therefore the luminous galaxies have redder colour. These two effects, age and metallicity, for reddening the luminous galaxies degenerate (so-called ‘age–metallicity degeneracy’; Worthey 1996 and Arimoto 1996). This degeneracy is solved in the collapse/wind model by Kodama & Arimoto (1997) by comparing the CMRs of high redshift cluster galaxies with those of theoretical models. If the CMR reflects the age sequence, young faint galaxies should be very blue at high redshift, and the slope of the CMRs evolves rapidly. However, the difference between the slopes of the CMRs at the present epoch and those at high redshift is small compared to the theoretical prediction in the age sequence. This small difference is in agreement with the prediction in the metallicity sequence. Moreover, they suggested that age of ellipticals is longer than Gyr. Thus, they found that the CMR reflects the metallicity sequence.
In contrast to such a collapse/wind model, recent developments on both theory and observation of the cosmological structure formation are revealing that objects such as galaxies and clusters of galaxies are formed through hierarchical clustering of smaller objects. Kauffmann & Charlot (1998; hereafter KC) applied their semi-analytic model to the problem of the CMR, and reproduced the observational properties of the CMRs, when the model includes the chemical evolution process and strong feedback to interstellar media by supernovae. Moreover, they found a tight luminosity–metallicity relation.
KC interpreted why the CMR is reproduced when the feedback process is strong as follows. They considered that bright ellipticals must be formed by mergers of larger spiral galaxies but not from progenitors of faint ellipticals. Because the feedback strength depends on the mass of galaxies, the metallicity of stars in more massive progenitors becomes higher than that in small progenitors. Therefore massive ellipticals become redder than small ellipticals. However, in the hierarchical clustering scenario, larger objects are formed by mergers of smaller objects. So such massive progenitors are formed by mergers of smaller galaxies. Thus the above conclusion may be insufficient for accounting to make the CMR, and it is needed to investigate how the metal abundance evolves in galaxies. The aim of this paper is, therefore, exploring what process, such as feedback and star formation, affects the CMR and the evolution of metallicity. Especially we focus on the slope of the CMR.
In Section 2, we describe the semi-analytic model used here briefly. In Section 3, we show the colour–magnitude relation in almost the same model as that of KC, and show evolutions of mean stellar metallicities of galaxies. In Section 4, we investigate the parameter dependence and some effects on the CMR. Section 5 is devoted to conclusions and discussion.
2 MODEL
In this section, the semi-analytic model which we use is described. Since the semi-analytic model includes some physical processes connected with the galaxy formation, it is easy to understand the galaxy formation process, in contrast to N-body and hydrodynamical simulations. Therefore we must include the following ingredients in our models at least: merging history of dark haloes, cooling and heating processes of baryonic gas, star formation and feedback by supernovae, mergers of galaxies, and stellar population synthesis model. The following procedure is mainly based on Kauffmann, White & Guiderdoni (1993), Cole et al. (1994) and Somerville & Primack (1998).
The outline of the procedure is as follows. At first, the merging paths of dark haloes are realized by the extension of the PS formalism. Next, in each merging path, evolution of the baryonic component, namely, gas cooling, star formation, and supernova feedback, are calculated. We recognize a system consisting of the stars and cooled gas as a galaxy. When two or more dark haloes merge together, there is a possibility that galaxies contained in progenitor haloes merge together. The judgment whether the galaxies merge together or not is based on the dynamical friction time-scale. Here we define the lifetime of haloes as the elapsed time between the formation time of the halo and the time at which the halo is subsumed into a larger halo. If the dynamical friction time-scale is shorter than the lifetime, the galaxies will merge. If not, the galaxies will not merge and the common dark halo has two or more galaxies. Finally, we calculate the colour and luminosity of each galaxy from the star formation history of each galaxy. Through the above procedures, we obtain a colour–magnitude diagram of galaxies.
2.1 Merging history of dark haloes
The merging histories of dark haloes are realized by using the method developed by Somerville & Kolatt (1999). They improved the model by Kauffmann & White (1993), based on the extension of the Press–Schechter formalism (Press & Schechter 1974) by Bower (1991), Bond et al. (1991) and Lacey & Cole (1993), for satisfying the mass conservation of haloes.
Their algorithm is simple and can be quickly performed as follows.
First, we consider two density fluctuation fields with two different smoothing scales, which corresponds to mass scales and (). The variances of the density fluctuation fields are and , respectively. The variance corresponds to mass scale uniquely if we fix a power spectrum of the density fluctuation field. The linear density contrast collapsing just at is obtained as by the spherically symmetric collapse approximation (Tomita 1969; Gunn & Gott 1972).
Next we consider the probability distribution function of , , where . When the density fluctuation fields are Gaussian random fields, this probability is simply
| (1) |
This function is a simple Gaussian distribution, if we change the variable to . After this, we interpret the variance as the mass .
The following procedure is based on a Monte Carlo method. First we set a mass , or , as a mass of a finally collapsing halo, e.g., a cluster scale or the ‘Milky Way’ scale, and ‘time-step’ . By using eq.(1), we pick out randomly. From this , , that is, , is determined. This is interpreted as a mass of a progenitor halo of the halo with mass , collapsing at estimated by . If , where is a minimum mass for an object identified as an isolated halo at a corresponding redshift, the mass is added to a diffuse ‘accretion mass’.
The above process is repeated until the rest of mass of the halo becomes less than . In the same way, merging paths are recursively realized by regarding the halo with mass as a starting point halo such as the halo with mass .
Mass functions at various redshifts obtained by using the above procedure reproduce the Press–Schechter mass function well. Of course, the Press–Schechter formalism itself has some problems, e.g., this formula does not include the spatial correlation of density fluctuations (Yano, Nagashima & Gouda 1996; Nagashima & Gouda 1997). Porciani et al. (1998) consider the effect of the spatial correlation in their method for realizing merging paths approximately. However, in spite of many theoretical uncertainties, the difference between the Press–Schechter mass function and the mass functions given by N-body simulations is only a few factor in the number of haloes. This curiosity is reviewed by Monaco (1998). Therefore, for simplicity, we use the extension of the PS formalism in this paper.
In this paper, we realize merging paths of progenitors of haloes with mass M⊙, which corresponds to the circular velocity km s-1. This is a typical size of clusters of galaxies. The time-steps are fixed to . The minimum mass for identifying as an isolated halo is M⊙. Smaller objects than may not be able to collapse because the mass of such objects are smaller than the Jeans mass (M⊙) after the reionization of intergalactic medium by the UV background radiation at (Ostriker & Gnedin 1996), and because galaxies are formed actively at . We find that results presented in this paper does not depend on the choice of M⊙. The power spectrum of density fluctuations given by Bardeen et al. (1986) is adopted,
| (2) | |||||
| (3) | |||||
| (4) | |||||
where is the cosmic density parameter and is the Hubble parameter, km s-1 Mpc-1. We adopt the standard CDM model, and , in this paper.
2.2 Gas cooling
In each realized merging path, we evaluate the amount of cooled gas through the radiative cooling, that is a direct material for forming stars.
When a dark halo under consideration collapses, we estimate the mass of hot diffuse gas contained in the halo. The sources of the diffuse gas are hot gas contained in its progenitor haloes and in the accreting matter. The baryon fraction of the accreting matter is defined as , where is the cosmic mean baryon density. The density distribution of this hot gas in the halo is assumed as the isothermal distribution, . The absolute value of the density profile is determined by mass and collapsing redshift of haloes under the spherical collapse model.
The cooling time-scale is obtained as a function of the radius from the hot gas density profile, the temperature of the hot gas, and the cooling function as follows,
| (5) |
where is the mean molecular weight, is the electron number density at the radius , and is the Boltzmann constant. The cooling function depends on the metallicity of the hot gas. We adopt the both cooling functions of zero-metallicity and solar-metallicity given by Sutherland & Dopita (1991), and determine the cooling efficiency depending on the metallicity of the gas from the two cooling functions by interpolation and extrapolation.
When a halo merges with another halo of comparable size (when the mass ratio of these haloes is larger than ), the diffuse hot gas contained in the halo is shock heated to the virial temperature of the halo. In this case, the hot gas within the cooling radius cools and the cooled gas mass is simply added to the cold gas reservoir of the galaxy. The cooling radius is a radius at which the cooling time-scale equals to the time-step of the merging histories of dark haloes. On the other hand, when the halo merges with small haloes whose mass ratio to the halo is less than , the hot gas is not shock heated and preserves its temperature, and the density profile is not disturbed. This parameter is introduced by Somerville & Primack (1998) firstly. In such a case, gas contained in the smaller haloes may remain in outer region of the new halo. Therefore, we introduce the following process when the mass ratio of the merging haloes is less than . Now we define as the elapsed time since the last shock heated epoch of the halo and as a radius at which the cooling time-scale equals to the elapsed time. In this case, because the density profile is maintained and the gas within has already cooled, the cooled gas mass is estimated as
| (6) |
This procedure is adopted only when . When , the hot gas may fall into the centre of haloes and cool because most of hot gas has already cooled at the previous time-step. So the gas density profile is recalculated and is estimated by as in the case of the major merger of haloes, while the density profile of the dark halo will be preserved.
We can avoid the dependence of the amount of the cooled gas mass on the artificial time-step of calculation by using the above procedure. In this paper, we use . Of course, if we use the block model which was used by the Durham group (Cole & Kaiser 1988; Cole et al. 1994), this parameter is not required. In the extension of the PS formalism, masses of haloes are given by randomly and the time-step is fixed. On the other hand, in the block model, density contrasts which determine the time-step are given randomly, while masses of haloes are divided by a factor of 2. So mass of a new collapsing halo is always twice of a maximum progenitor. Thus the mass ratio of the merging haloes are usually larger than .
In the case that the circular velocity of haloes exceeds 500 km s-1, we prevent the cooling process by hand to suppress the formation of extremely big monster galaxies. If we consider only the mean density of the hot gas, the maximum mass of galaxies is M⊙ (Rees & Ostriker 1977). In our calculation, since we adopt the isothermal distribution , the cooling process becomes efficient in the central region of haloes. Actually this phenomenon is suggested observationally (e.g., Fabian 1994). However the number density of bright galaxies is much larger than the observed one, unless we prevent the cooling process in such large haloes. Thus we adopt the same unsatisfactory solution as Kauffmann et al. (1993). Somerville & Primack (1998) also adopt the same solution but for km s-1 of the cut-off circular velocity. A detailed study is needed in order to understand this effect physically.
2.3 Star formation
In Kauffmann et al. (1993), the star formation in disc is described by the following simple law,
| (7) | |||||
| (8) |
where eq.(7) denotes the rate of stars newly formed. This form is the same as the one adopted by Kauffmann et al. (1993), and referred as the ‘Munich model’ by Somerville & Primack (1998). The redshift dependence on the star formation time-scale is obtained as follows. We adopt the simple star formation interpretation, , that is, is proportional to the dynamical time-scale. From this, the virial theorem and the spherical collapse model, we obtain that . The value of the star formation time-scale at , , is a free parameter. This parameter describes the star formation with a long time-scale in a disc of spiral galaxies. Moreover we need to fit the amount of the cold gas in the ‘Milky Way’-like spiral galaxies, which have the same circular velocity as our Galaxy (Milky Way), km s-1, to the amount of the cold gas in our Galaxy. If is small, almost all of the cold gas is transformed into the stars until the present epoch. So is larger than a few Gyr.
Stars formed by the above process constitute a disc of galaxies. Star formation in a bulge occurs when two or more galaxies with comparable masses merge together (see Section 2.5). In this merging process, since the system is dynamically disturbed, starburst may occur. Then both stars formed in the burst and disc stars may fall into the central region of the galaxy and constitute the bulge. We describe this event by adopting very short star formation time-scale.
Of course, the above star formation laws are oversimplified. In the present situation, stars are considered to be formed as follows. The star formation process may be determined by the local properties, such as density and temperature. If we consider only atomic cooling in our calculation, the gas cools until K. So we identify such gas cooled until K as the cold gas. However, the pressure of the gas is still too high to form stars. The cooling by molecules is needed to cool the gas lower than K. Then the gas cools until a few K by the molecular cooling, and fragments into small clumps. These clumps evolve to stars. These processes are performed in molecular clouds, whose mass is about M⊙. Therefore we should consider the processes of the molecular cooling and the fragmentation of the ‘cold’ gas ( K). It is studied by considering the ensemble of molecular clouds to connect the star formation in molecular clouds with the global star formation properties in galaxies (Fujita 1998; Fujita & Nagashima 1999). These processes are very complicated, so we do not adopt them in our semi-analytic model, since the simplicity which is an important merit of this model will be lost.
2.4 Supernova feedback
When stars form, massive stars with short lifetime explode and heat up the surrounding cold gas. The number of supernovae per solar mass of stars formed is M for the Salpeter IMF (Salpeter 1955). The kinetic energy from a supernova, , is about erg. When a fraction of the released energy is used to heat up surrounding cold gas, the amount of this reheated gas is evaluated as
| (9) |
This feedback process has many uncertainties actually, and therefore we adopt a simple description (Cole et al. 1994),
| (10) |
where and are free parameters. Eq.(9), which is adopted by Kauffman et al. (1993) corresponds to , and Cole et al. (1994) used in their fiducial model.
It is the conclusion of KC that this feedback process is a key parameter to determine the slope of the CMR. Therefore we also investigate the dependence of CMR on the feedback process.
2.5 Mergers of galaxies
When two or more haloes merge together, the new common halo may have two or more galaxies. In that case, the galaxies will lose their energy due to dynamical friction, and then fall into a centre of the new common halo. Finally they may merge together as the case may be.
When a halo collapses, a central galaxy contained in the largest progenitor is identified as the central galaxy of the new common halo. The cooled gas described in Section 2.2 accretes to this central galaxy. Other galaxies are identified as satellite galaxies.
We calculate the elapsed time from the epoch at which each satellite galaxy was identified as satellite, namely, it was contained in a common halo not as a central galaxy but as a satellite galaxy. It should be noted that this elapsed time is reset to 0 when the ‘major merger’ of dark haloes occurs (see Section 2.2) because orbits of satellite galaxies may be violently disturbed by the major merger of haloes. When this elapsed time exceeds the dynamical friction time-scale for the galaxies in the new common halo, the satellite merges with the central galaxy. The dynamical friction time-scale is (Binney & Tremaine 1987)
| (11) |
where and are the virial radius and circular velocity of the new common halo, respectively, is the total mass of a halo to which the satellite belonged as central galaxy, and is the Coulomb logarithm, which is approximated as ( is the mass of the common halo) (Somerville & Primack 1998).
In this paper, we do not treat mergers between satellite galaxies for simplicity, which is described in Somerville & Primack (1998). There is a possibility that this effect changes the resulting CMRs. This effect will be considered in future work.
When a satellite galaxy merges with a central galaxy, and moreover the mass ratio of the galaxies is larger than , all stars of the satellite galaxy and disc stars of the central galaxy are incorporated with the bulge of the central galaxy. Then cold gases of both galaxies turn to stars in the bulge with a very short time-scale (‘starburst’). In this paper, we use the following two burst model on the feedback process. One is that the strength of the feedback is the same as that in the disc, according to eq.(10) (model sbA). Another is that there is no feedback effect during the burst, that is, all cold gas turns to stars through the ‘closed-box’ process (model sbB). In order to decide which model is correct, detailed simulations of merging process will be needed. On the other hand, if the mass ratio of the galaxies is smaller than , all stars of the satellite galaxy are incorporated with the disc of the central galaxy and the cold gas reservoir of the satellite merges with that of the central galaxy, and then disc stars are formed from the cold gas with the star formation time-scale obtained from eq.(8). In this paper, we adopt . This value is the same as that in Somerville & Primack (1998). They adopt this value for reproducing observational fractions of the number of galaxies of each morphology.
2.6 Chemical evolution
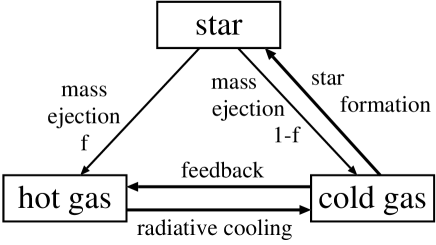
Chemical evolution is treated in almost the same way as described in KC. The instantaneous recycling approximation is adopted (Tinsley 1980). We show the gas and metal exchange in Fig.1 schematically. Metals ejected from supernovae are recycled as follows.
When two or more haloes merge together, metals contained in the hot gas is joined together. If two or more galaxies merge together, metals contained in the cold gas reservoirs of galaxies are joined together. When the hot gas cools, metals contained in the cooled gas are also joined to the cold component. Here we assume that metals in cold and hot components are well mixed in each component. Stars formed from the cold gas have initially the same metallicity as the cold gas. This metallicity affects colours of galaxies directly.
The amount of metals ejected from supernovae is characterized by , which is heavy element yield for each generation of stars. The fraction of the ejecta is ejected directly into the hot gas, and the rest, , is incorporated with the cold gas. We adopt , which is the same value as in KC. The gas fraction returned by evolved stars is 0.75 in this paper. Simultaneously, the supernovae heat up the surrounding cold gas, therefore metals contained in the cold gas are also returned to the hot gas.
2.7 Stellar population synthesis and identification of morphologies
In order to compare our results with observations such as CMRs directly, stellar population synthesis model must be considered. We adopt a model by Kodama & Arimoto (1997) as such a population synthesis model. Luminosity and colour of stars cannot be theoretically estimated without uncertainties because the stellar evolution models themselves include the uncertainties. For example, as for the convection of stellar gas, we have only a phenomenological theory (‘mixing length theory’). However, their model is adequate for our purpose of investigating the slope of the CMR. Once we understand the properties of galaxies such as the CMR physically and qualitatively, even if the stellar population model is changed, we fit immediately our results with observations by changing parameters mentioned above.
The IMF which we adopt is the Salpeter type with a slope of 1.35, and the mass range is MM⊙. The range of stellar metallicity of simple stellar populations is .
In Section 2.3, we divide the stellar component into disc and bulge components. Morphology of each galaxy is determined by the -band bulge-to-disc luminosity ratio (). Simien & de Vaucouleurs (1986) showed that the Hubble type of galaxies correlates with the -band luminosity . In this paper, galaxies with are identified as ellipticals, as S0s, and as spirals, according to their results. It is shown that this method for classification reproduces observations well by Kauffmann et al. (1993) and Baugh, Cole & Frenk (1996).
3 Origin of colour–magnitude relation
In this section, we explore the origin of the CMR. In this paper, because we investigate how the CMR depends on the physical processes such as star formation, supernova feedback, and so on, we fix the cosmological parameters to the standard CDM model, that is, km s-1 Mpc-1, , and . We refer to the models considered by the models A, B, C and D as shown in Table 1. In this table, we also show models from E to J, which are adopted in the next section. The fifth column, UV, is explained in Section 4.3. The sixth column, burst, is shown in Section 2.5. The yield is equal to in all the models. In KC, in the low feedback model. However, in order to see the effects of the feedback and so on, we fix the value of the yield in all models.
In the following sections, we take notice of only the slopes of CMRs, because the luminosity of galaxies can be translated by considering the following reason. Stars are formed according to the IMF. Mass of luminous stars is larger than M⊙, which is determined by the criterion of nuclear burning. However, there is a possibility that invisible stars with mass smaller than M⊙ are formed. If there are many invisible stars in galaxies, the galaxies become faint compared to the case that all stars are luminous. The ratio of the invisible stars to the luminous stars is treated as a free parameter in the previous work. Therefore the absolute value of luminosity can be adjusted by this parameter. The suitable value of this parameter will be determined by considering other observational quantities. Thus this parameter does not affect the slope of the CMR.
| Model | (km s-1) | (Gyr) | UV | burst | |
| A | 280 | 2 | 20 | off | sbA |
| B | 100 | 2 | 20 | off | sbA |
| C | 280 | 2 | 20 | off | sbB |
| D | 100 | 2 | 20 | off | sbB |
| E | 280 | 2 | 2 | off | sbB |
| F | 100 | 2 | 2 | off | sbB |
| G | 240 | 5.5 | 2 | off | sbB |
| H | 100 | 5.5 | 2 | off | sbB |
| I | 400 | 2 | 2 | off | sbB |
| J | 280 | 2 | 2 | on | sbB |
3.1 Colour–magnitude relations
In Fig.2, we show the CMRs in the models A and B with which is the value adopted by KC. The dots denote galaxies identified as ellipticals, and the solid lines show the observational CMRs (Bower et al. 1992). The criterion to pick out ellipticals among all galaxies is shown in Section 2.7.
As in KC, in the model A with high feedback efficiency, the slopes of the CMRs are in roughly agreement with the observations, but the dispersion is larger than that of observations, mag. This is due to the recent star formation owing to long star formation time-scale, Gyr. On the other hand, in the model B with low feedback efficiency, the slopes of the CMRs are nearly flat. At the bright-end, the colour becomes redder about 0.1-0.2 mag, and at the faint-end (), about 0.2-0.3 mag, compared to that in the model A. In order to see the physical relation between the reddening and the feedback intensity, we investigate the age- and metallicity-luminosity relations.

We define the V-luminosity weighted mean stellar age and metallicity as follows,
| (12) | |||||
| (13) |
where is the metallicity of cold gas, is the star formation rate at , and is the luminosity of stars at present, , with age and metallicity . In both models, the distributions of mean stellar age are alike (upper panels of Fig.3), and the mean stellar ages spread about Gyr. On the other hand, there are tight relations between the V-luminosity and the mean stellar metallicity. The slopes of the relations in the models A and B are almost the same, but the value of the metallicity in the model B is higher than that in the model A. In the model B, because ages of most of dwarf ellipticals are old and because the metallicity is high, the CMRs are flatter than those in the model A.

Next we show the CMRs in the models C and D, in which the all cold gas is transformed to stars in the starburst process (Fig.4). In both models, the slopes of CMRs are flat, as well as in the model B, while the number of galaxies in the model C is less than that in the model D, owing to the high feedback efficiency in the model C. The difference between the models A and C is only in the feedback model. This difference will cause the difference in the metallicity of galaxies (see Section 3.3). In Fig.5, We show the same figure as Fig.3 but for the model C and D. The age distributions of the models C and D are almost the same as those of the models A and B. On the other hand, the metallicity distributions are different. The mean metallicities of dwarf ellipticals increase by and the distributions are flat in both models C and D, while at in the model A. Therefore the difference of the feedback models mainly affects the metallicity of dwarf ellipticals. Thus we can say that the feedback model is essential to determine the properties of the CMR, when Gyr (see Section 3.3).


From these figures, we conclude that the CMR results from the metallicity-luminosity relation as KC concluded. The conclusion of the origin of the metallicity-luminosity relation in KC is that ellipticals are formed by mergers of gas-rich spirals, and that massive ellipticals are formed from massive spirals because the feedback efficiency of such massive galaxies is small, and so more metal-rich stars are formed (Fig.2 in KC). We will show the evolutions of mean stellar metallicity and age of each galaxy in order to investigate this process in detail.
3.2 Evolution of mean stellar metallicity
In this subsection, we show the evolutions of the mean stellar metallicity , which are weighted by stellar mass for simplicity.
In the upper panels of Fig.6, we show the evolutions of stellar metallicity of luminous ellipticals picked out in the models A and B. Their final magnitudes and colours are and , respectively. The open circles denote the mean stellar metallicities of progenitors in the elliptical state, which is defined as the bulge-to-disc stellar mass ratio , and the dots show those in the spiral state, . These two luminous galaxies are identified as galaxies experiencing the same merging path of dark haloes. Because the merging histories of dark haloes of these galaxies are the same, the difference between results in different models is caused from only parameters shown in Table 1. These galaxies rapidly grow in mass and the feedback effect becomes weak at early times. So the mean stellar metallicities also exceeds at early times. Therefore, the difference between these galaxies is small. The final metallicity of elliptical galaxy in the model A (Fig.6a) is smaller than the yield . The reason for this is considered as follows. One is that the feedback effect remains a little because of the shallower dependence of feedback on circular velocity, . Second is that the star formation time-scale is very long, Gyr. On the other hand, the difference between faint ellipticals is large (lower panels of Fig.6). The ratio of the final metallicities is more than a factor of two. These faint ellipticals are also picked out in the same merging path. Their final magnitudes and colours are and , respectively. In the high feedback efficiency model A, the growth of the mean stellar metallicity is slow and the final metallicity is very small, . On the other hand, the growth in the low feedback efficiency model B is rapid and then the final metallicity is high, . This shows that in the low feedback model even small galaxies can evolve chemically.
In this figure, some progenitors have periods of decrease of their metallicities. This is because gas with low metallicity accretes a galaxy with high mean metallicity and stars are newly formed from the gas. Therefore such stars have low metallicity and the mean metallicity of the galaxy decreases.
In Fig.7, we show the same figures but for the models C and D with the starburst model sbB. The final magnitudes and colours of picked out luminous ellipticals are and , in the models C and D, respectively. Those of faint ellipticals are and , respectively. In all four panels, the evolutions of metallicities of galaxies in the spiral state are the same as those in the model A and B because the difference between the models A and B and the models C and D is only the starburst model. In contrast, the metallicities of galaxies in the elliptical state are different, especially in the high feedback model and in the dwarf ellipticals (upper- and lower-left panels and lower-right panel in Fig.7). Moreover, the final metallicities of these four galaxies are almost the same, . This value is nearly equal to the value of the yield . This shows that the starburst increases the metallicity to the yield, when all cold gas turns to stars with very short time-scale. We will explained this increase of metallicity in the starburst in the next Section.
From the above results, we conclude that the colour of luminous galaxies reflects the yield strongly because the effect of the feedback on such luminous galaxies is very weaker than that on faint galaxies. On the other hand, in faint ellipticals, their colour reflects the feedback efficiency, [, see eq.(10)], directly, when the feedback is effective even in the starburst process. In other words, when the value of is fixed, the evolution of stellar metallicity in faint galaxies is suppressed in the case of high feedback models, and the metallicity of luminous galaxies is almost determined by the yield, , because the feedback effect becomes negligible in such luminous galaxies. Therefore, a suppression of growth of stellar metallicity is required in small galaxies for making the slope of CMRs. The relationship between the metallicity and the feedback is discussed in the next section.


3.3 Roles of feedback and yield
In a chemical evolution of a simple monolithic cloud collapse model, the evolution of metallicity of cold gas for a constant star formation time-scale, , is described as
| (14) |
where is a locked-up mass fraction, ( is the gas fraction returned by evolved stars), and is an initial metallicity of cold gas at . The rate of increase of stellar mass is
| (15) |
where we use the instantaneous recycling approximation. From these two equations, the mass-weighted mean stellar metallicity is obtained as
| (16) | |||||
where
| (17) |
When the star formation time-scale is enough smaller than the Hubble time or when the starburst occurs, the final metallicity is determined by (). The form of shows that when the feedback is strong the final mean stellar metallicity becomes small, as . Moreover, increasing is corresponding to decreasing the feedback strength . This effect determines the absolute value of final mean stellar metallicity, especially for faint galaxies. On the other hand, when the feedback is negligible (), the factor is determined by only . So the effect of is remarkable in luminous galaxies rather than in faint galaxies when the starburst model sbA is adopted, which is the model that the supernova feedback strength remains even in the starburst. On the other hand, when the starburst model sbB is adopted, which is the model that all the cold gas turns to stars with very short time-scale, the final metallicity of ellipticals does not depend on their mass, because in the starburst. In this case, we find that the final metallicity when . This value is almost the same as the final metallicities of ellipticals in Fig.7. Thus the results in the previous section are mostly explained by eqs.(16) and (17).
4 PARAMETER DEPENDENCE
In this section, we investigate the parameter dependence of the CMR on the star formation time-scale and the circular velocity dependence of the feedback. In Section 4.3, we also investigate the effect of the UV background radiation.
4.1 Star formation time-scale
In the previous section, the star formation time-scale, Gyr, is longer than the Hubble time. Next we investigate how the CMR changes in the case of a short star formation time-scale. We adopt Gyr in this section.
4.1.1 CMR and starburst model
We show the CMRs in the models E and F (Fig.8). The starburst model sbB is adopted in these models.
In the left panels (the model E), the dispersion becomes small compared to the models A and C and the CMR reproduces the observations well. The colours of ellipticals become redder compared to those of the model A (Fig.2) and those of bright ellipticals of the model C (Fig.4), and become bluer than those of dwarf ellipticals of the model C. Because the starburst model of the model E is the same as that of the model C, these figures show that the star formation time-scale is one of the essential parameters for the slope of the CMR when we adopt the starburst model sbB.
In the right panels (the model F), luminous ellipticals are very red and the CMR is flat at . The colour of the giant ellipticals nearly corresponds to the colour when and the age of galaxies is nearly equal to 10 Gyr.
Moreover, we find that the dependence of CMRs on the starburst model becomes negligible. The above results do not change when the starburst model sbA is adopted (not shown).
These properties are discussed in Section 4.1.2. In the same way as Section 3, we investigate the metallicity and age of ellipticals next.

4.1.2 Metallicity and age of ellipticals
In order to understand the properties mentioned above, we show the metallicity- and the age-luminosity diagrams in Fig.9. Ages of ellipticals become older about 1-2 Gyr than those in the case of Gyr on average. However, this difference corresponds to less than 0.1 mag in colour. We cannot explain the origin of the difference between the CMRs in the models from A to D and the models E and F only by the age difference.
The metallicity in the model E [Fig.9(c)] increases in all range of magnitude compared to the model A [Fig.3(c)], and at and at . The reason of the metallicity increase is considered as follows. In eq.(16) it is only the case of that the final metallicity is determined by only . This is correct when the star formation time-scale is quite shorter than the Hubble time. However, the value Gyr is longer than the Hubble time and does not satisfy the above condition. The mass-weighted mean stellar metallicity is a monotonously increasing function about in the description in the Section 3.3. So the actual final mean stellar metallicity is lower than . Therefore when we adopt a short star formation time-scale, mean stellar metallicities of galaxies increase totally and colours become redder, compared to the model A.
In contrast to the model A, in the model C with the same starburst model sbB as the model E, the metallicity is higher than that in the model E. The difference between the metallicities in the models C and E is emphasized at dwarf elliptical scale. The reason that the metallicity of dwarf ellipticals is low in the model E is considered as follows. In the spiral state, the cold gas turns to stars in very short time-scale, Gyr. In this star formation mode, supernova feedback can reheat the cold gas, and most stars are formed in the spiral state owing to the short star formation time-scale. Therefore, when the major merger occurs, the number of stars formed through the starburst is small. Note that when stars are formed with the feedback, the stellar metallicity becomes lower than that in the case of the starburst without the feedback, (see Section 3.3). Thus the metallicity becomes small compared to that in the model C, in which most of stars are formed during the starburst without the supernova feedback. Besides the difference between the feedback models during the starburst does not affect the metallicity because of the small number of stars formed during the starburst.
Thus the metallicities of ellipticals in the model E are higher than those in the model A and lower than those in the model C, and the results do not depend on the feedback model.

4.1.3 Evolution of mean metallicity
Next we investigate the evolution of metallicities of some sample galaxies in order to show the time-scale of the metallicity increase and that most of stars are formed in disc in the models E and F.
We explicitly show the evolution of the mean metallicity of four ellipticals in Fig.10. The magnitudes and colours of the picked out luminous ellipticals are and in the models E and F, respectively. Those of the faint ellipticals are and , respectively. This figure resembles Fig.6 of the models A and B with the starburst model sbA rather than Fig.7 of the models C and D with the starburst model sbB. Note that the starburst model in the models E and F is the same as that of the models C and D. In the models A and B, there are many cases that the starburst occurs in the middle of the metallicity increase, while in the end of the metallicity increase in the models E and F. This shows that the star formation time-scale is short enough and that most of stars are formed in disc, where the supernova feedback is effective. In the models C and D, many stars are formed during the starburst without the feedback, so that the mean stellar metallicity becomes very high (see Section 3.3). On the other hand, in the models A and B, the feedback is effective even during the starburst. So the resulting CMRs of the models E and F resemble those of the models A and B, while the mean metallicities of the models E and F are higher than that of the models A and B because of the short star formation time-scale.
Thus most of stars are formed in disc and the difference between the CMRs with the starburst models sbA and sbB is negligible when the star formation time-scale is short enough.

4.2 Slope of colour–magnitude relation
In this subsection we investigate how the CMR depends on the parameter . We adopt in the models G and H. This value of has been adopted by Durham group (e.g., Cole et al. 1994). In the model G, km s-1. In this case, the feedback strength has the same value as that in the case at the Milky Way scale, km s-1.
The CMRs in these models are shown in Fig.11. The results for the model H with low feedback efficiency (right panels of Fig.11) are almost the same as those for the model F (right panels of Fig.8). So does not affect the CMR when the feedback efficiency is low. On the other hand, in the model G with high feedback efficiency, the CMR is different from that in the model E (left panels of Figs.11 and 8, respectively). The slope of the CMR is flat at and steeper than that of observations at .
In the case , the feedback strength changes drastically at . So galaxies are divided into two classes at . Probably this magnitude is given by km s-1 because it is almost the same circular velocity as that of the Milky Way galaxy, km s-1, with . We find that the metallicity of the luminous class with is nearly equal to 0.03, while that of the faint class with is nearly equal to 0.015. Moreover, because the star formation in dwarf-scale galaxies is strongly suppressed, the age of galaxies becomes younger than that in the case of . Therefore the colours of dwarf ellipticals are bluer than the observations, while those of giant ellipticals are almost the same colour as the observations. Thus the slope of the CMR in the model G seems to be steeper than that of the observations.

4.3 Effect of the UV background radiation
In this subsection, we evaluate the effect of the Ultraviolet (UV) background radiation on the CMR. Now we obtain some evidences that the UV background radiation has existed via the Gunn-Peterson test, the proximity effect, etc. The effect of the UV background on galaxy formation has been evaluated by Nagashima, Gouda & Sugiura (1999).
The UV photons penetrate galactic gas clouds and ionizing the envelopes of the clouds. We assume that absorption of the UV photons begins at the cooling radius and the UV photons are perfectly absorbed at a radius . It is assumed that the hot gas which cannot cool does not affect the UV photons. The radius is obtained by the inverse Strömgren sphere approximation,
| (18) | |||||
where and are the proton and electron number densities respectively, is the recombination coefficient to all excited levels at a temperature , and is the normalized intensity of the UV radiation, erg cm-2 s-1 sr-1 Hz-1. We solve this equation assuming the isothermal sphere distribution of gas in the clouds. The amount of newly cooled gas from hot gas is estimated as the amount of hot gas within .
We have many uncertainties about the evolution of the UV background, but at low redshift, it is suggested and (Pei 1995). At high redshift, there are too many uncertainties. So we approximate the UV background as , at , at , and at . Nagashima, Gouda & Sugiura (1999) showed that it is reasonable to adopt this type evolution of the UV background by comparing the luminosity function and the colour distribution of galaxies given by their semi-analytic model with those given by observation.
This effect on luminosity function of galaxies is similar to increasing feedback efficiency (see Cole et al. 1994; Nagashima et al. 1999). Therefore, we introduce the effect of the UV background in our model instead of strengthening the feedback efficiency.
In Fig.12, we show the CMRs in the models I and J, with short star formation time-scale, Gyr. The feedback strengths are and the effect of the UV background is not introduced in the model I, and km s-1 and the effect of the UV background is included in the model J. The observed slopes of the CMR are reproduced well as well as the previous high feedback models.
In both models, the slopes of the CMRs remain in the observational slope, while the colours becomes bluer. These show that the epoch of star formation delays by the strong feedback or the UV background because the star formation occurs in more massive galaxies by the effects. In these cases, we also confirmed that the metallicity-luminosity relations shows almost the same trend as the previous models.
The virtue of the model J is that the amount of cold gas in ‘Milky Way’-like galaxies, which belongs to a halo with circular velocity of 220 km s-1, is M⊙. This value is nearly equal to that in our Galaxy. On the other hand, the model I ( km s-1 and Gyr), the amount of the cold gas M⊙ is less than that in our Galaxy.
Of course, such a degeneracy will be solved by observing other quantities, such as luminosity function, cold gas content, and so on, because the dependences of these quantities on the feedback process, the star formation time-scale, and the UV background are different. This will be done in future work.

5 CONCLUSIONS AND DISCUSSION
We investigate the physical mechanisms determining the properties of the CMRs. We show that the feedback efficiency, the star formation time-scale, and the yield are the key parameters to determine the properties of the CMRs. Moreover, we find that the feedback process in the starburst strongly affects the slope of the CMR when the star formation time-scale is long.
The metallicity-luminosity relations, which are directly reflected to the CMRs, are formed as follows. At high luminosity, massive galaxies are dominated, whose feedback strength is weak. Because the feedback strength decreases as growing the mass of galaxies, the number of high metallicity stars increases. In this case, the mean stellar metallicity is determined by the yield mainly.
On the other hand, at low luminosity, we must consider some mechanisms for suppressing the stellar metallicity. The following three parameters determine the mean stellar metallicity of the low luminosity ellipticals: the star formation time-scale, the feedback strength, and the intensity of the UV background [see eq.(16)]. The final mean stellar metallicity increases when the star formation time-scale decreases, because the time-scale of metal enrichment is given by the star formation time-scale and because the mean stellar metallicity increases as time passes monotonously in the case that a monolithic cloud forms stars. When the feedback and UV background strength increase, the final mean stellar metallicity decreases. The reason for this is that the star formation is suppressed and then the amount of metals ejected into the gas decreases.
Therefore one of the solutions to form the metallicity-luminosity relation is to increase the feedback strength when the star formation time-scale decreases. Another solution is to consider the effect of the UV background radiation. We find that the effect of increasing the feedback efficiency is the same effect as increasing the intensity of the UV background.
The above conclusion suggests that the main reason for reproducing the CMR in the hierarchical clustering scenario is similar with that in the wind/collapse model (see Section 3.3). That is, the feedback process of star formation is essential for making the metallicity-sequence and then, as a result, reproducing the slope of the CMR. Then from this point of view, we can say that the collapse/wind model succeeds in showing the essential process for reproducing the CMR. However, in the traditional models such as the collapse/wind model, the formation epoch of elliptical galaxies is given by hand. In real, we should consider the clustering process of dark haloes, cooling of baryonic gas, merging process of galaxies, etc. In fact, the age of elliptical galaxies is not unique. In the semi-analytic model, we can pursue such formation processes of galaxies in the standard scenario based on the hierarchical clustering which is strongly supported by the present observations of the large-scale structure of the Universe. Moreover, in the hierarchical clustering scenario, processes of suppressing star formation are not only the supernova feedback but also the UV background radiation. The former depends on the star formation time-scale, while the latter affects all galaxies coeval. On the other hand, only the wind is the process of suppressing star formation in the collapse/wind model. In this paper, we can show how such effects of suppression of star formation determine the slope of the CMR in the standard cosmological galaxy formation scenario.
We also find that the feedback process in the starburst is important to make the CMR when the star formation time-scale is long enough, Gyr. When all of the cold gas and the metals do not escape from a galaxy but used to form stars in the starburst, this process is the same as the closed-box chemical enrichment model. If the star formation time-scale is long, the amount of the cold gas is large when the starburst occurs. Therefore the fraction of metal rich stars becomes large even in dwarf ellipticals. When the star formation time-scale is short enough ( Gyr), the feedback model in the starburst does not affect the CMR because almost all of the stars are formed in disc where the feedback is always effective. Such a value of star formation time-scale is often used for describing star formation in early-type disc galaxies (e.g., Arimoto, Yoshii & Takahara 1991).
In our model based on the hierarchical clustering scenario, the metals released to hot gas return to cold gas later. We must evaluate whether this metal recycling affects the luminosity-metallicity relation. When , the reheated gas mass and newly formed stellar mass fractions are
| (19) | |||||
| (20) |
When considering small galaxies, which have a strong feedback efficiency (), most of cold gas are transformed to hot gas. So it is difficult for such small galaxies to form high metallicity stars. It means that the amount of metals formed in the galaxies is small. Therefore the hot gas does not evolve chemically. Thus the effect of metal recycling from hot gas to cold gas is slight. In order to confirm this, we calculate the CMR by using the model in which the metals returned from hot gas to cold gas are removed by hand. We find that the difference between the results of considering such metals and removing metals is small, about 0.2 mag lower in in all range of magnitude, and that the difference between the slopes is negligible. Therefore the effect of the metal recycling is negligible with regard to the slope of the CMR.
In this paper, we show the physical mechanisms forming the CMRs and discuss the possible effects on the CMRs. We find a kind of ‘degeneracy’ among the star formation, the feedback, and the UV background for making the slope of the CMRs. This degeneracy will be solved by comparing other statistical properties of galaxies such as luminosity function and colour distribution in future work. Moreover, we should consider the tightness of CMRs. The tightness may reflect the dispersion of the mean stellar ages. However the colour of each galaxy is not simply estimated through its mean stellar metallicity and age. This is probably because a recent star formation by merging with small galaxies affects the colour. This effect is more emphasized in U-V rather than V-K, and the dispersions of the U-V CMRs are larger than those of the V-K CMRs especially in the case of Gyr. We will investigate the origin of the tightness minutely in future work.
ACKNOWLEDGMENTS
We wish to thank F. Takahara, Y. Fujita, T. Yano, M. Sasaki, T. Kodama and N. Arimoto for useful suggestions. This work was supported in part by Research Fellowships of the Japan Society for the Promotion of Science for Young Scientists (No. 2265), and in part by the Grant-in-Aid for Scientific Research (No. 10640229) from the Ministry of Education, Science, Sports and Culture of Japan.
References
- [1] Arimoto N., 1996, in From Stars to Galaxies, eds. C. Leitherer, U. Fritz-von Alvensleben, J. Huchra (ASP Conf. Ser. Vol. 98), p.287
- [2] Arimoto N., Yoshii Y., 1986, A&A, 164, 260
- [3] Arimoto N., Yoshii Y., 1987, A&A, 173, 23
- [4] Arimoto N., Yoshii Y., Takahara F., 1991, A&A, 253, 21
- [5] Bardeen J.M., Bond J.R., Kaiser N., Szalay A.S., 1986, ApJ, 304, 15
- [6] Baugh C.M., Cole S., Frenk C.S., 1996, MNRAS, 283, 1361
- [7] Binney J., Tremaine S., 1987, Galactic Dynamics, Princeton Univ. Press, Princeton, NJ
- [8] Bond J.R., Cole S., Efstathiou G., Kaiser N., 1991, ApJ, 379, 440
- [9] Bower R., 1991, MNRAS, 248, 332
- [10] Bower R., Lucey J.R., Ellis R.S., 1992, MNRAS, 254, 601
- [11] Cole S., Kaiser N., 1988, MNRAS, 233, 637
- [12] Cole S., Aragon-Salamanca A., Frenk C.S., Navarro J.F., Zepf S.E., 1994, MNRAS, 271, 781
- [13] Fabian A.C., 1994, ARA&A, 32, 227
- [14] Fujita Y., 1998, ApJ, 509, 587
- [15] Fujita Y., Nagashima M., 1999, ApJ, in press
- [16] Gunn J.E., Gott J.R., 1972, ApJ, 176, 1
- [17] Kauffmann G., White S.D.M., 1993, MNRAS, 261, 921
- [18] Kauffmann G., White S.D.M., Guiderdoni, 1993, MNRAS, 264, 201
- [19] Kauffmann G., Charlot S., 1998, MNRAS, 294, 705 (KC)
- [20] Kodama T., Arimoto N., 1997, A&A, 320, 41
- [21] Lacey C.G., Cole S., 1993, MNRAS, 262, 627
- [22] Larson R.B., 1974, MNRAS, 166, 585
- [23] Monaco P., 1998, Fund. Cosm. Phys., 19, 153
- [24] Nagashima M., Gouda N., 1997, MNRAS, 287, 515
- [25] Nagashima M., Gouda N., Sugiura N., 1999, MNRAS, 305, 449
- [26] Pei Y.C., 1995, ApJ, 438, 623
- [27] Porciani C., Matarrese S., Lucchin F., Catelan P., 1998, MNRAS, 298, 1097
- [28] Press W., Schechter P., 1974, ApJ, 187, 425
- [29] Rees M.J., Ostriker J.P., 1977, MNRAS, 267, 1020
- [30] Salpeter E.E., 1955, ApJ, 121,161
- [31] Simien F., de Vaucouleurs G., 1986, ApJ, 302, 564
- [32] Somerville R.S., Kolatt T., 1999, MNRAS, 305, 1
- [33] Somerville R.S., Primack J.R., preprint, astro-ph/9802268
- [34] Sutherland R., Dopita M.A., 1993, ApJS, 88, 253
- [35] Tinsley B.M., 1980, Fundam. Cosmic Phys., 5, 287
- [36] Tomita K., 1969, PTP, 42, 9
- [37] Worthey G., 1996, in Fresh Views of Elliptical Glaxies, eds. A. Buzzoni, A. Renzini, A. Serrano (ASP Conf. Ser. Vol. 86), p.203
- [38] Yano T., Nagashima M., Gouda N., 1996, ApJ, 466, 1