Broad Band X–ray Spectra of M31 Sources with BeppoSAX
Abstract
We present the first spectral study of the X–ray emitting stellar sources in M31 in the energy band from 0.1 to 10 keV. We find that the globular cluster sources have spectral characteristics consistent with those of the Milky Way object, namely that the spectrum can be described by a thermal model with keV from 2 to 10 keV. Evidence of high absorption in some of these sources is most likely an indication that they lie in or behind the HI ring in the disk of the galaxy. We also find one peculiar globular cluster source, with spectral characteristics more typically associated with either High Mass X–ray Binaries or black hole candidates. We therefore suggest that either the source has been wrongly identified with a globular cluster or that the system contains a Black Hole.
We confirm earlier report that the spectrum of the bulge of M31 is consistent with the superposition of many LMXB spectra. It is likely that a large fraction of the keV detection obtained from the PDS instrument is associated with the bulge, thus extending the spectral data for this complex of sources up to keV. The high energy part of the spectrum can be parameterized with typical LMXB spectra, while at low energies an additional component is required.
No significant variability is observed within the BeppoSAX observation, while a few sources appear to have varied (brightened) since ROSAT and observations.
Key Words.:
Extragalactic astronomy; Galaxies: individual: M31; Galaxies: spiral; X-rays: galaxies1 Introduction


At the distance of kpc, M31 is the normal, bright spiral galaxy closest to us. Moreover, it is also similar to the Milky Way in size, metallicity and morphological type, and therefore can be used for the dual purpose of investigating the properties of our own and of more distant intermediate type spiral galaxies. The close proximity enables us to obtain very detailed observations in the X–ray band also with current missions, and we can therefore study the properties of its X–ray emitting evolved stellar population. This gives us the opportunity of better understanding analogous sources in our own Galaxy. There are several advantages of a detailed study of M31 over our own Galaxy, in spite of the fact that sources are more distant than Galactic objects, and therefore require higher sensitivity and better spatial resolution: the distance to M31 is well known, so that the luminosities of its sources can be accurately calculated; the location of individual sources, whether in the bulge or in the disk of the galaxy, can be more easily assessed so that the association with the stellar population is more reliable; the much lower line–of–sight column density (NH 7 cm-2 in our Galaxy) allows a more comprehensive investigation of the spectral properties over a larger energy range than it is possible in objects in the plane of our own Galaxy. Moreover, due to its relatively favorable orientation, absorption internal to the M31 disk is also reduced relative to that affecting sources in the Milky Way disk.
| Name | R.A. | Dec. | begin–end | Obs.Time (ks)1 | ||
|---|---|---|---|---|---|---|
| (J2000) | LECS | MECS | PDS | |||
| Field # 3 | 0 42 29.45 | 41 26 04 | 22/12/97-24/12/97 | 38 | 88 | 39 |
| Field # 6 | 0 40 13.05 | 40 50 10 | 17/12/97-18/12/97 | 16 | 41 | 18 |
1 Exposure times of LECS and PDS are shorter that those of MECS due to the different observing modes of the three instruments. MECS and PDS operate for all the useful observing time (with the exception of m. each orbit when the PDS instrument gain is calibrated and the data are not used in scientific analysis). However, because of the collimator rocking, at any one moment only 2 out of 4 PDS units are looking at the source, while the other two are used to estimate the background, therefore giving of the time on the source. LECS is operated only during satellite dark time, to prevent contamination of the background by UV light entering the thin organic window, significantly reducing the observing time.

M31 has been the target of deep and detailed observations with all previous and current X–ray missions. Detailed maps have been obtained in the soft energy band by first and ROSAT more recently. Over 100 sources were already detected with the Observatory in the 0.2-4 keV energy band, down to a luminosity of 1036 erg s-1 (Trinchieri & Fabbiano 1991; TF hereafter). ROSAT HRI and PSPC observations in the 0.1-2 keV band have more than tripled this number and have lowered the minimum detectable luminosity to a few 1035 erg s-1 (Supper et al. 1997, S97 hereafter; Primini et al. 1993, P93 hereafter).
Several sources were detected in globular clusters and a few were found associated with SNRs. A large fraction of the total emission detected from M31 is concentrated in the bulge region, where 50 sources have been individually detected (TF; P93). Some unresolved emission is also detected in the bulge. P93 discuss that this is only in part explainable with the integrated emission of faint unresolved sources, while TF had attributed all of the emission to fainter unresolved sources. The overall integrated X–ray emission was well fitted by a thermal bremsstrahlung model with kT6–13 keV testifying to the presence of very hard X–ray sources (Fabbiano, Trinchieri and Van Speybroeck 1987).
A detailed analysis of the spectral characteristics of single sources has however remained largely unexplored so far. IPC spectra were obtained for a handful of them. However, the limited statistical significance of the detection, coupled with the limited spectral capabilities of the instrument have given only tentative, and in some cases puzzling results: for example a higher value of the low energy cut–off than expected on the basis of the total line-of-sight NH column density was observed in some of the sources identified with globular clusters. The uncertainties on the characteristic temperatures were however so large as to prevent any reliable conclusion on their spectral characteristics.
ASCA has also obtained several pointings of M31 at higher energies, but there are to date no reports in the literature of the results obtained. PSPC spectra of several globular clusters have been derived, however in the limited and much softer ( 2 keV) energy range provided by ROSAT (Irwin & Bregman 1999). We report here for the first time a study of the spectral properties of the most luminous sources in M31 obtained with data from the BeppoSAX instruments, in the much wider keV band. We also analyze briefly the ASCA data for the bulge of M31, to be compared with the BeppoSAX results.
2 Analysis of the BeppoSAX data
MECS2 for Field # 3 in detector coordinates MECS3 for Field # 3 in detector coordinates
The X-ray astronomy satellite BeppoSAX (Satellite per Astronomia X, named “Beppo” in honor of Giuseppe Occhialini) is a Italian/Dutch satellite developed, built and tested by a consortium of Italian and Dutch Institutions, the Space Science Department of ESA and the Max Planck Institut für extraterrestrische Physik. The satellite and the related instrumentation are presented in Butler & Scarsi (1990), Boella et al. (1997a) and references therein. We present here the observations of M31 obtained in December 1997 with 3 of the co-aligned narrow field instruments: the Low Energy Concentrator Spectrometer (LECS), sensitive between energies of 0.1 and 10 keV, with a circular Field of View (FoV) of radius (Parmar et al. 1997); the Medium Energy Concentrator Spectrometer (MECS), consisting of 2 identical active units sensitive between 1.3-10 keV and with a FoV of radius (Boella et al 1997b; a third unit was no longer active at the time of our observations); and the Phoswich Detector System (PDS), which is a non-imaging instruments composed of 4 independent units arranged in pairs (for on- and off-source observations) sensitive in the keV band and with an hexagonal FoV with FWHM (Frontera et al. 1997 and references therein).
In AO1 we obtained two pointings in the direction of M31: one (Field # 3) is centered north of the nucleus and contains the bulge, and a second (Field # 6) covers the SE region of the disk. Table 1 summarizes the parameters of the BeppoSAX observations.
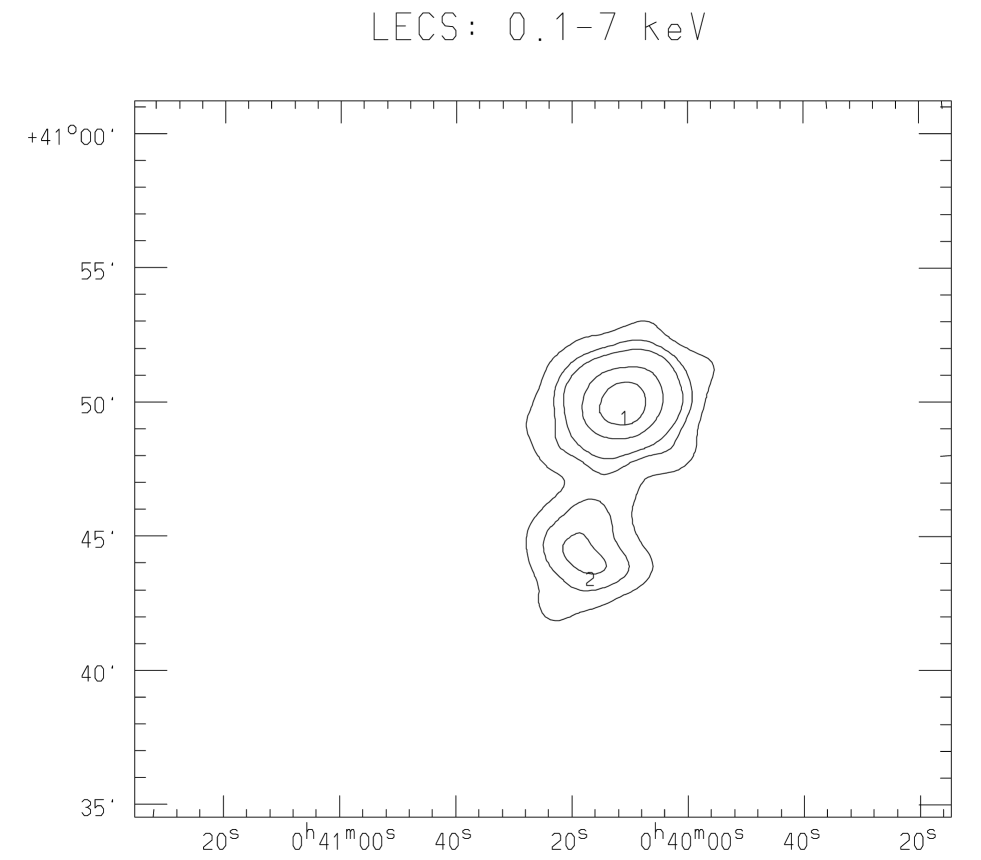
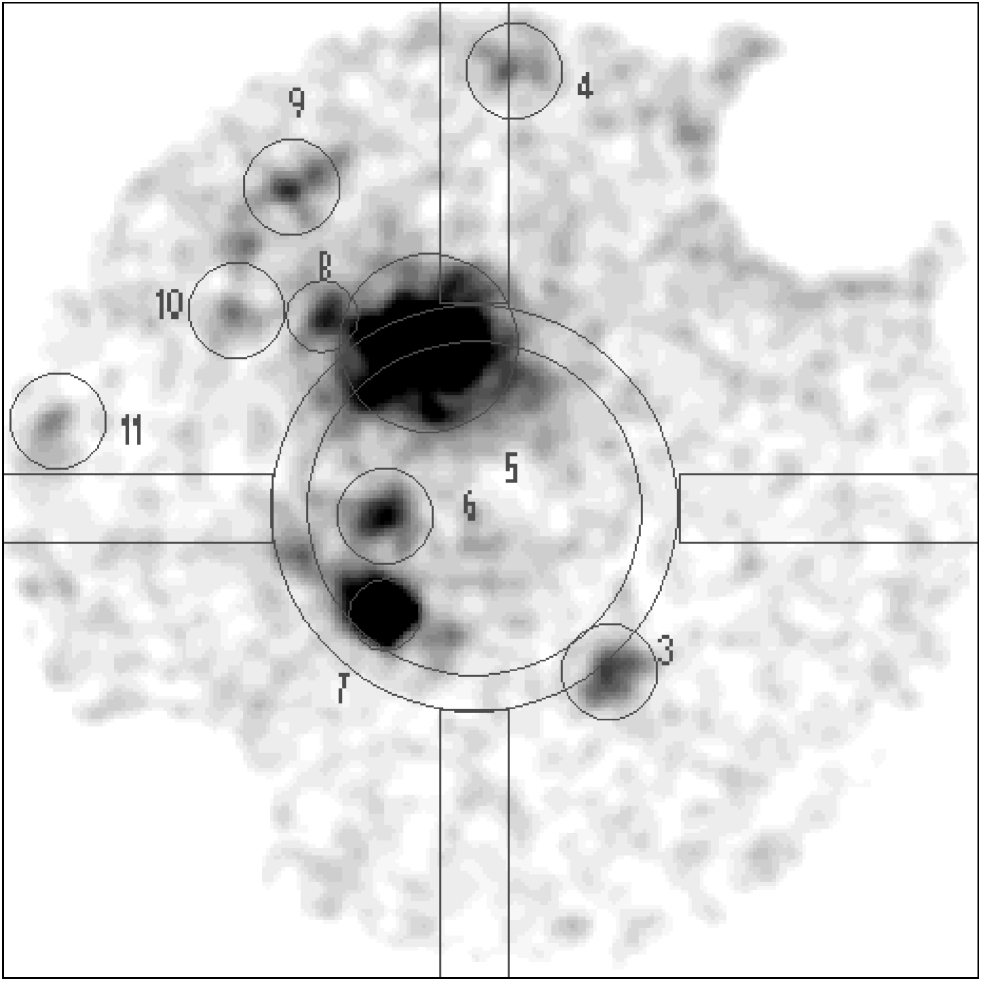
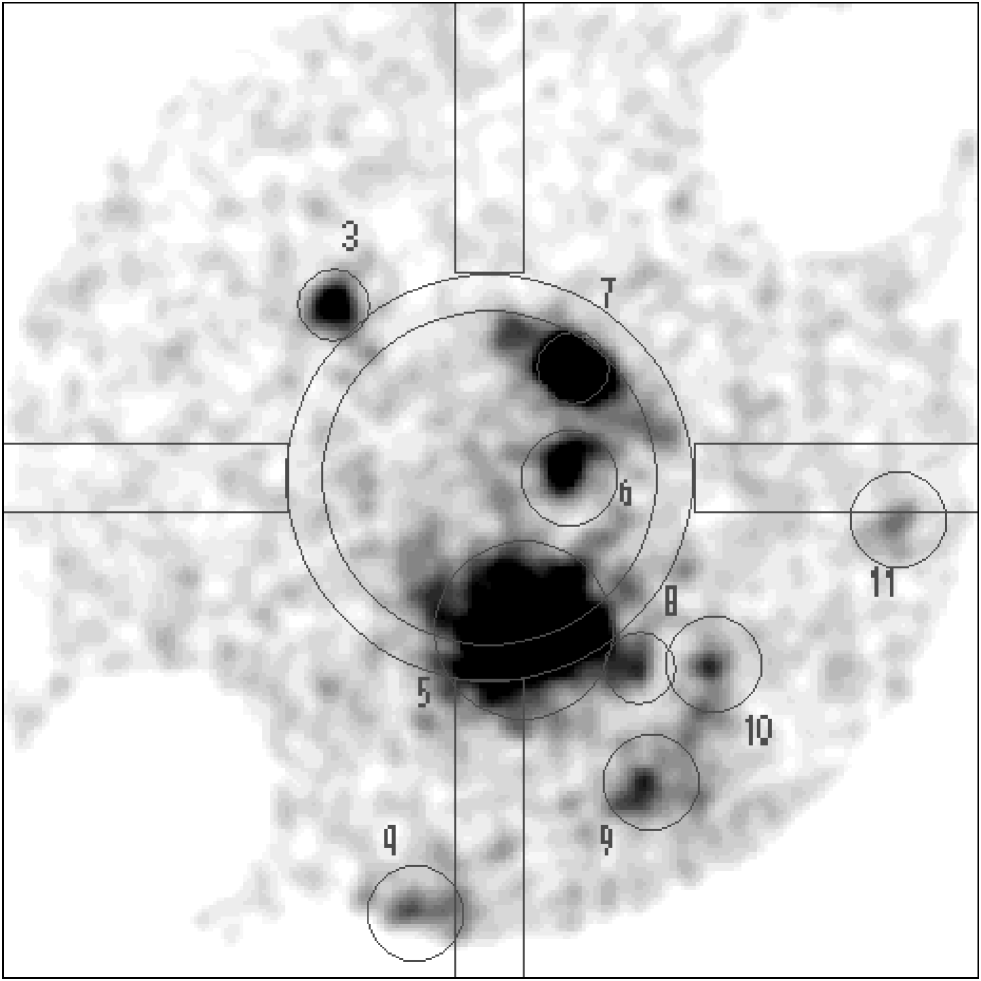
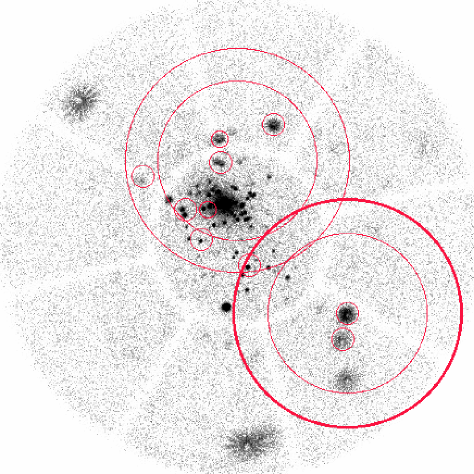
Figure 1 and Fig. 2 show the X-ray images obtained with BeppoSAX (with the 2 MECS summed together and with the LECS) in different energy bands. As can be seen from the figures, several sources are detected in the field. Unfortunately, due to the configuration of the MECS instruments, and considering that most of them are at large off-axis angles, several sources are contaminated by the support structure ( the “strongback”, see Boella et al. 1997b). Moreover, they fall onto different locations of the detectors, as illustrated schematically by Fig. 3 for Field # 3, so both the background and the contamination of the support structure could be different in different instruments (the individual MECS units are aligned differently with the satellite axes).
For a proper handling of the data, each individual detector was analyzed separately, therefore the spectral distribution of each source and the light curve were derived separately, and then analyzed together, as explained below. The pre-processed data provided by the Science Data Center (SDC), which distributes cleaned and linearized event files in standard FITS OGIP format, and the background files and response matrices (RMF) also distributed by the SDC, have been used for the analysis.
2.1 Sources in the BeppoSAX fields and comparison with , ROSAT and ASCA sources.
Nine sources are detected in Field # 3 and 3 in Field # 6 (for a total of 11 source, since one is common to both fields) with the MECS detectors of BeppoSAX , as summarized in Table 2. Due to the much smaller observing time, lower sensitivity and smaller field of view, only sources # 1,2,3,5,6,7 have also been detected with the LECS. No additional source is detected with LECS in either fields. Source # 5 coincides with the bulge of M31 and is clearly extended/complex in the BeppoSAX image, in agreement with the clear detection of many sources with higher resolution images from [TF] or ROSAT [P93]). All others are consistent with being single sources in BeppoSAX , although more than one source could be present in the circle used to determine fluxes and spectral parameters of these sources (see Table 2).
| Name | R.A. | DEC | R.A. | DEC | ROSAT | ident. | ||
|---|---|---|---|---|---|---|---|---|
| corrected | PSPC | HRI | ||||||
| (2000) | Source # | |||||||
| Field # 6: | ||||||||
| Source 1 | 00:40:11.6 | 40:49:22.0 | 3 | 67 | RS | |||
| Source 2 | 00:40:17.6 | 40:43:22.2 | 4 | 73 | G | |||
| Field # 3: | ||||||||
| Source 3 | 00:41:42.4 | 41:33:39.4 | 00:41:43.54 | 41:34:25.29 | 9 | 122 | G | |
| Source 4 | (00:42:12.5 | 41:00:51.9) | 0:42:11.34 | 41:01:28.00 | (16) | (138-139-150) | (13) | (G-No) |
| Source 5 | 00:42:35.8 | 41:15:40.0 | 00:42:36.57 | 41:16:13.80 | Bulge | |||
| Source 6 | 00:42:48.8 | 41:24:51.9 | 0:42:50.67 | 41:25:24.59 | 62 | 201-203 | 53-59-61 | No-SNR |
| Source 7 | 00:42:50.1 | 41:30:19.9 | 00:42:52.51 | 41:30:53.07 | 67 | 205-207 | 56 | G-No |
| Source 8 | 00:43:04.9 | 41:13:47.7 | 00:43:06.15 | 41:14:15.93 | 74-79-83 | 214-220-225-228 | 65-68-70-74-76 | G-No |
| Source 9 | 00:43:13.1 | 41:06:53.9 | 00:43:13.93 | 41:07:19.73 | 85 | 229 | 77 | G |
| Source 10 | 00:43:31.9 | 41:13:47.0 | 00:43:33.72 | 41:14:10.29 | 91-92 | 244-247 | 82-83 | For-G |
| Source 11 | 00:44:25.4 | 41:21:28.4 | 00:44:29.22 | 41:21:42.90 | 97 | 282 | G | |
NOTES:
The corrected positions in Field # 3 result from the plate solution using the
ROSAT positions (see text).
Source numbers are from Table 2 from TF, Table 5 from S97, and Table 1 from
P93 (note that the P93 list only covers sources #4 to #10).
Optical identifications are also from Crampton et. al. (1984).
G = globular cluster; RS = radio sources; SNR =
Supernova remnant;
For = foreground; No = no id
Source # 4 is too close to the edge of the field for a reliable
determination of its position. It is also in Field # 6,
at the very edge of the field and
close to the calibration source. The position determined in the two
observations differ by in and 2′ in .
The or ROSAT sources indicated could fall in the 2
() circle used for the spectral analysis.
ROSAT sources # 150 nd # 205 are the more likely candidates for
sources # 4 and # 7 respectively (see text)
As already discussed, most of the sources are at large off-axis angles in the detector, and in several cases fall near or under the support structure of the instruments, which obscures photons at low energies ( keV). This is particularly true for the bulge, but also sources # 3,# 4, # 7 and # 11 could be affected by it, although at different degrees of importance (see Fig. 3). This poses a problem for determining both the spectrum and flux of these sources, and their position. In particular, for source # 5, the centroid determined in the 2-10 keV band is =0:42:32.7 =+41:16:04.0, while in the 4-10 keV band (where absorption from the strongback should be negligible) this is =0:42:35.8 and =+41:15:40. We have therefore determined centroids in the 4-10 keV band, where contamination from the strongback should be negligible (LECS positions do not appear to change significantly with energy). This is also the band recommended by the SAX-SDC team, and it has been shown to be reliable in comparison with the ROSAT data of the Marano field (Giommi et al. 1998).
A further concern about source positions comes from the comparison of LECS and MECS positions for the sources in common. We find that the absolute positions are not the same, but have a off-sets in the range and . We estimate that is probably a reasonable assessment of the average uncertainty in the determination of the peak position of sources in the MECS (larger for very off-axis sources, also due to the asymmetry of the PSF at large off-axis angles). A similar uncertainty in the measure of the aspect and misalignments between instruments and satellite axes, however, could approximately double the overall error. We could therefore explain most of the discrepancies with a rigid shift of the absolute coordinates.
| Name | MECS2 | MECS3 | /kT | 90% err | (DoF) | Unabs. Flux | Model/ |
|---|---|---|---|---|---|---|---|
| cnt ks-1 | (cgs) | Notes | |||||
| Source 1 | 26.590.82 | 26.700.82 | 1.94 | 1.86-2.03 | 1.1 (62) | 4.7 | P |
| 6.3 | 5.6-7.3 | 1.0 (62) | 4.6 | B | |||
| Source 2 | 10.690.53 | 10.020.53 | 1.76 | 1.62-1.90 | 1.3 (26) | 2.2 | P |
| 8.7 | 6.5-12 | 1.1 (26) | 2.2 | B | |||
| Source 3 | 3.040.20 | 3.490.22 | 1.41 | 1.23-1.60 | 0.8 (19) | 1.3 | P |
| 28.9 | 13-160 | 0.8 (19) | 1.3 | B | |||
| Source 4 | 2.410.20 | — | 0.80 | 0.43-1.12 | 1.0 (7) | 2.5 | P b |
| 200 | 1.7 (7) | 2.0 | B b,c | ||||
| Source 5 | 61.000.86 | 50.690.79 | d | ||||
| 28.110.59 | 25.460.57 | 2.24 | 2.12-2.35 | 1.6 (41) | 1.8 | P | |
| 6.1 | 5.4-6.2 | 1.3 (41) | 1.7 | B | |||
| Source 6 | 5.720.29 | 5.600.28 | 1.74 | 1.59-1.88 | 0.7 (34) | 1.2 | P |
| 9.7 | 7-15 | 0.8 (34) | 1.2 | B | |||
| Source 7 | 11.290.37 | 13.750.41 | 1.70 | 1.61-1.77 | 1.2 (64) | 3.7 | Pa |
| 10.0 | 8-12 | 1.0 (64) | 3.6 | B | |||
| Source 8 | 4.090.24 | 3.700.23 | 1.82 | 1.66-2.00 | 1.3 (22) | 1.4 | P |
| 7.7 | 5.6-12 | 1.3 (22) | 1.4 | B | |||
| Source 9 | 3.380.22 | 3.560.23 | 1.05 | 0.83-1.21 | 1.2 (22) | 2.4 | P |
| 200 | 60 | 1.3 (22) | 2.2 | Bc | |||
| Source 10 | 2.790.22 | 3.330.23 | 1.86 | 1.66-2.07 | 1.2 (20) | 1.4 | Pa |
| 6.3 | 4.5-9.7 | 1.0 (20) | 1.3 | B | |||
| Source 11 | 1.760.17 | 2.150.20 | 1.87 | 1.55-2.2 | 0.8 (13) | 1.3 | P |
| 7.6 | 4.3-20 | 1.0 (13) | 1.2 | B | |||
NOTES: sources 1 and 2 are in field # 6, sources 3 to 11 in field # 3. P stands for Power Law model, and B for Bremsstrahlung. kT is in keV. is the photon index. Net observing times are 87906 s. for MECS2 and 87777 s. for MECS3 in field # 3, and 41609 (MECS2) and 41424 (MECS3) in field # 6. Fluxes are the average value between the two MECS in the 2-10 keV range.
-
a A broken power law provides a better fit to these data. Best fit parameters are: = 1.5 , EB = 5.4, = 2.8 ( = 1 for 62 DoF) for source 7, with a F-test probability of ; = 1.5 , EB = 4, = 2.9 ( = 1 for 18 DoF) for source 10 (F-test probability ).
-
b Source 4 is at the border in MECS3.
-
c Best fit value is hard pegged at the maximum allowed value in the fit.
-
d No reasonable fit can be obtained using the full energy range. Energies above 3.5 keV only are considered in the next two lines.
For the purpose of the cross identification of sources, we have used MECS positions, that are available for all sources, and we have compared them with published source lists (TF; S97; P93). We have first identified the BeppoSAX sources with the closest and ROSAT source(s) to the positions in Table 2. We find that all BeppoSAX sources have both an and a ROSAT counterpart. For 5 sources, confusion is not an issue: there is only one and one ROSAT source as the possible identification of the BeppoSAX sources. Moreover, the position of source #7 is very close to that of the ROSAT PSPC source # 205. We have then compared the BeppoSAX and ROSAT PSPC positions and found a systematic negative shift in declination, of an amplitude in the range 35 for most sources, and a less clear pattern in R.A. (mostly a negative shift of 1-2 sec) with the closest identification. Using the 4 sources in Field # 3 with unique ROSAT PSPC counterparts as reference celestial coordinates, we could indeed find a different set of coordinates for the BeppoSAX sources, with a RMS astrometric error of . The newly determined coordinates differ by an average 1.5s in R.A. and in declination from the old ones, although not by a constant shift equal for all sources. This is consistent with a possible systematic offset in the absolute BeppoSAX positions.
We have checked again the cross-identifications between the BeppoSAX sources and published lists, either using the newly determined coordinates (however valid only for Field #3) or equivalently applying the average shift to the coordinates in Table 2, that can be done for all sources. Table 2 lists as possible identification all sources that would be included in the circle used for the spectral analysis (see next section), in spite of the fact that they might not be the most likely identification, either because they are farther from the expected position (for example, the position of BeppoSAX sources # 7 would be at from ROSAT source # 207) and/or because much fainter than other candidates. Sources # 1, # 2, # 3, # 9 and # 11 are identified with one source only. PSPC ROSAT sources # 150 and # 205 are the most likely candidates of BeppoSAX sources #4 and # 7 respectively. Sources #6 and # 10 have more than 1 ROSAT counterpart (2 sources for # 10) that could contribute equally to the BeppoSAX fluxes. The spectral results should therefore be treated with caution, since they could be the superposition of intrinsically different spectra. Source #8 is very close to the confused bulge area.


When identified, the proposed counterparts of the X-ray sources are for the vast majority globular clusters (Crampton et al. 1984, S97, P93). Source # 1 (and possibly also source# 10) could be unrelated to the galaxy (see identification list in Crampton et al. 1984).
2.2 Spectra of individual sources: MECS data
Since most sources are expected to be point like, the determination of the spectral distribution of the source photons should be relatively straightforward. However, as discussed above, contamination from the support structure is heavy (see Fig. 3); moreover, the field is crowded, so we cannot use the standard detection cells for these sources either because of overlap or because of their vicinity to the strongback. We have therefore resolved to use a fixed detection cell of 26 radius for all sources except # 5 (the bulge) and # 7 and # 8, for which the radii were 5′, 2′ and 2′ respectively, and to center the cells in each instrument using the 4-10 keV image so as to minimize the influence caused by differential absorption due to the support structure. The “Area Response file” (ARF) for the chosen cell size at the appropriate off-axis and azimuthal angles was obtained for each source in each detector using the program in the XAS software environment distributed by the SDC, which also includes a correction for the presence of the “strongback”. The resulting ARF computes the fraction of PSF included within the source extraction radius using the numeric model of the on-axis PSF, which is calibrated within 6′, but that has been verified to be valid out to off-axis angles of 10′ (Molendi, private communication). Moreover, the spectral analysis of two well known sources (4U0142+61 and RX J0146.9+6121) at different off-axis angles further testifies to the reliability of the matrixes produced even outside of the “official” calibration region (Israel et al. 1999; Mereghetti et al., in prep.).
Table 3 summarizes the count rates, and best fit parameters for each source obtained with XSPEC. To produce these numbers we have first selected the regions around the sources (plotted on Fig. 3). Given the different positions of the sources in the 2 detectors, we have analyzed each MECS separately, in order to properly assess the expected background at the detector position and possibly deal with different covering fractions from the “strongback”. Although small, the chosen cell size should be large enough that small variations in the centering of the cells in the two detectors do not introduce significant differences in the count rate of each source. The relative normalization, which is a free parameter in the fit to ensure that small residual differences in the efficiencies of the two detectors are taken into account, should also correct for errors that might arise from the possibly different covering of the total flux from each source (see also Fiore et al. 1999). The spectral distribution of each source has been extracted with XSELECT, and the data have then been rebinned to improve on the signal-to-noise, typically to have a minimum of 30 total counts in each channel. Channels at energies below keV and above 10 keV are not considered. The background is estimated from the same detector position from the corresponding background event files.
For the spectral fits, we have assumed either a power law or a bremsstrahlung spectrum with the line-of-sight column density fixed at 7 cm-2. More sophisticated spectra are not required, since in most cases one or either of the two models we used approximates well the spectral distribution of the photons. Moreover, the limited statistics of the detection does not allow us to properly test models with more parameters. In a few cases where the minimum reduced () value prefers one model over the other, we have also tried different fits (namely a broken power law, see Table 3). We have imposed the same or kT for both instruments, but let the normalization between the two instruments as a free parameter. The relative normalization is typically 10%, but it becomes 10% for sources # 7 and # 8, which could be an indication of different degrees of contamination from the support structure or the neighboring source, and/or of a different centering precision in the two instruments. For source # 5 the relative normalizations differ by as much as factors 2, become closer to 40% for energies above 3.5 keV and to 12% above 5 keV.


As shown by Table 3, in most cases either model is adequate, and the best fit parameters are or kT keV. The is smaller for the B model for sources # 2, # 7 and # 10. This could indicate a preference over the P model, as also suggested by the fact that a broken power law indeed lowers the minimum value (see Table 3), indicating that a model with curvature is preferable. The relatively high values of the minimum for sources # 8 and # 9 are mostly due to a couple of bins that strongly deviate from the model prediction. However, they are most likely statistical fluctuations, since the residuals do not show systematic deviations from the mean (they are seen in one instrument only, or there are large positive residuals balanced by similar negative ones), so they should not be used as a strong indication of a poor fit (see Fig. 5).


Three sources (# 3, # 4, # 9) have significantly different best fit parameters from the others. The results for source # 4, which is at the edge of the field, should probably not be regarded as significant, since calibration at such extreme off-axis angles is not reliable. Sources # 3 and # 9 are significantly harder than the others. We have tried to understand whether their different spectrum could be due to spurious effects. Source # 3 could be influenced by the support structure, although the effective area file should have taken this into account. We have nonetheless excluded photons below 4 keV from the fit and found very similar best fit values, although with clearly much larger errors. Source # 9 should not be affected by the strongback, and in this case too a fit to high energy photons only reproduces the best fit parameters listed in Table 3. We have also tried the standard 4′ detection cell, which is possible since there are no neighboring sources nor the support structure, to investigate whether we have assumed too small a detection cell for the instrument PSF (although this should have affected other sources as well, and should be taken into accounts by the ARF), and once again found consistent best fit parameters. The release of the constrain on NH does not alter significantly the best fit values either. We therefore believe that these two sources are significantly harder than the other sources in M31.
The bulge of M31 (source # 5) cannot be fitted with either of the models considered above, when the full range of energies are considered. In Table 3 we include the bulge results for completeness, but we give the spectral parameters derived from the data at high energies only, for which a fit could be obtained with the models used for all other sources. Given the heavy obscuration from the strongback, discarding all low energy photons is a safe procedure. A more detailed treatment of the spectral data for the bulge is given in § 2.4.
2.3 Spectra of individual sources: LECS+MECS data
The significantly smaller observing time obtained with the LECS causes a much poorer detection efficiency in this instrument. Moreover, we have used only a fraction of the detected counts for each source, since the field is crowded and we cannot adopt the standard detection cell of 8′ radius that would ensure that 95% of 0.28 keV photons are included within the selected area. We have used detection cells of the same size as those used for the MECS, centered at the peak position as seen by the LECS. We have produced effective area files with the program in the SAXDAS software environment distributed by the SDC. The mirror response and strongback obscuration are modeled by means of ray-tracing (see Parmar et al. 1997).
| Name | LECS | /kT | 90% err | NH | 90% err | (DoF) | Unabsorbed Flux (cgs) | Model/ | ||
|---|---|---|---|---|---|---|---|---|---|---|
| counts | 2-10 keV | 0.1-2 keV | 0.2-4 keV | Notes | ||||||
| Source 1 | 542 | 2.08 | 1.92-2.20 | 50 | 38-67 | 1.0 (79) | 3.4 | 7.1 | 6.9 | P |
| 5.8 | 5.0-7.0 | 26 | 18-40 | 1.0 (79) | 3.4 | 3.0 | 4.4 | B | ||
| Source 2 | 186 | 1.78 | 1.60-2.00 | 30 | 13-60 | 1.5 (31) | 1.7 | 1.9 | 2.2 | P a |
| 10.2 | 7.6-15 | 7 | – | 1.3 (32) | 1.6 | 1.0 | 1.5 | B a | ||
| Source 3 | 198 | 1.50 | 1.33-1.63 | 7 | – | 0.8 (27) | 1.1 | 6.8 | 9.7 | P |
| 20.0 | 11-50 | 7 | – | 0.8 (27) | 1.6 | 5.6 | 9.0 | B | ||
| Source 6 | 274 | 1.68 | 1.56-1.81 | 7 | – | 0.8 (45) | 7.9 | 7.4 | 9.2 | P |
| 10 | 7-15 | 7 | – | 0.9 (45) | 8.2 | 5.3 | 8.2 | B | ||
| Source 7 | 468 | 1.87 | 1.76-2.00 | 60 | 42-90 | 1.0 (79) | 2.3 | 3.0 | 3.3 | P |
| 8.0 | 7-10 | 40 | 25-50 | 0.9 (79) | 2.2 | 1.6 | 2.4 | B | ||
NOTES: Fluxes are from the LECS data only and are calculated for the
best fit parameters given. P stands for Power Law model,
and B for Bremsstrahlung. NH is in units of 1 cm-2.
a fit to LECS data only gives =1.20 [0.96-1.44]
and kT=187 [17], for
NH=7 and =1.4
We have fitted the LECS data jointly with the MECS data. The addition of LECS data will not give a significant contribution in the overlapping energy region (2 keV), given their lower statistical weight, but they should add crucial information at low energies. The spectral parameters are forced to be the same for all 3 instruments, while the relative normalizations are free to vary (see Fiore et al. 1999). This also takes into account the fact that a different fraction of the photons are included in the source area. The low energy absorption is at first fixed at the Galactic line-of-sight value, and let free to vary if required by the quality of the fit. The bulge is treated separately (see § 2.4).
Table 4 gives the results of the joint fits for the 6 sources detected with the LECS. In all cases (but source # 2) LECS data are consistent with the MECS. For source # 2, LECS data alone would suggest a higher temperature spectrum (see Table 4) and no intrinsic absorption, while a significant absorption is suggested in the power law model fit. This is also the only source for which the P and B models give significantly different low energy absorption values. The absorption parameter measured with LECS data is consistent with the line-of-sight values of 7 cm-2 for sources # 3 and # 6. Sources # 1 and # 7 are clearly absorbed: a fit with absorption fixed at the Galactic value gives a clear depression at low energies (and significantly worse ) that disappears with a column density of higher (see Fig. 6). This is consistent with the sources being embedded or behind the HI ring in M31, from which column density of cm-2 is expected. It is also consistent with the results from the data (TF).
2.4 The case of the bulge
Since a single temperature or a single power law model cannot be used to represent the MECS data for the bulge over the full energy range (see Table 3), we have tried a different approach. In particular, since we expect that the strongback modifies the spectral distribution of the photons, we have also untied the spectral parameters, to account for possible differences in the response of the two instruments. With a broken power law, we could fit the full energy range and obtain a minimum value of 1. To obtain a reasonable value of the , however, the spectral parameters must be significantly different in the two instruments: for the MECS2 data we could fit the full range with a single, steep power law of , similar to what we found for both sets of data at higher energies (or a cut-off energy of 9.4 keV), but the MECS3 data do require a flatter power law at lower energies, with , and a break (cutoff) energy at keV. A single power law is never a good fit to the MECS3 data. In the assumption of a bremsstrahlung spectrum, we also can properly fit each set of data, but with very different temperatures: keV in MECS2 and keV in MECS3. The two temperature converge to a value around 5-7 keV if only data above 4 keV are considered.
Given the large disparity between the two sets of best fit values, we cannot interpret this in view of residual faulty calibration between the two instruments (in agreement to within a few per cent) and therefore we have to interpret this result as an indication that there are some more fundamental technical problems, most likely in the calibration of the instrument in the vicinity of the strongback and in the determination of the ARF in cases of such heavy obscuration and complex morphology (the program assumes a point source distribution of the photons, for example). We have tried to understand the origin of this discrepancy, as briefly explained in A. We conclude that MECS data cannot be reliably used to derive the spectral properties of the bulge, except at high ( 4 keV) energies, where the effect of the strongback is negligible.
In spite of the much shorter observing time, and smaller sensitivity, LECS data on the bulge provide high enough statistics to be analyzed separately from the MECS data, with the added advantage of fewer technical problems. The source position, at off-axis, should make it clear from the strongback in the LECS, thus giving us cleaner and independent information on its spectral properties. As for other LECS sources, we have built the appropriate ARF for the area used to extract the source photons in the point source approximation. Table 5 summarizes the relevant results of the spectral fits to the full spectral range of the LECS ( 0.1-9 keV). We find that a single power law, a single temperature bremsstrahlung or a broken power law are inadequate to fit the data, as shown by the large values, since they all leave positive residuals around 0.8 keV (see Fig. 7 top). To account for this soft excess, we have added a component to the B spectrum. We have considered a Black Body, which, at a temperature of keV, reduces significantly the excess and the minimum value (see Table 5), although it requires a higher than line-of-sight value for the low energy absorption. Fixing the low energy absorption at the line-of-sight value however does not change significantly the best fit parameters (see Table 5). The residual at keV involves only one bin, although it appears significant (Fig. 7).
While this is a good fit to the data, it is not unique. In fact, a model (in place of the BB) with solar abundances and a best fit kT0.3 keV also reduces both the minimum to an acceptable value and the systematics in the residuals. As in the BB+B model, there is a residual positive excess at keV that could be significant (Fig. 7).
We therefore conclude that the LECS spectra of the bulge can be well represented with a two component model, either BB+B or R+B. We have further checked whether a power law could be used to parameterize the high energy component, and found that a B model is preferred (see Table 5), suggesting a curvature in the photon distribution at high energies. The addition of MECS data, at energies above 5 keV only, confirms the results of the LECS data alone. Given the potential problems related to the presence of the strongback, MECS data have not been explicitly added to the fits of Table 5.
Although not formally required by the fits, we have nonetheless attempted more sophisticated model, to further understand the characteristics of the low energy emission from this region. We have released the constrain of solar abundance in the R model. A better fit is found for extremely low (%) abundances, but at the expenses of a very high column density ( cm-2). A much less dramatic improvement is found if the column density is fixed at the Galactic value. However a significant decrease in the value ( for 1 DoF less) and improved residual distribution is obtained if one of the elements like N, Ar, or S is allowed to vary, while all others are kept at the solar value, or if a very narrow line at keV is added to the R+B model ( for 3 fewer DoF). In either case, the F-test probability is %. Alternatively, the addition of a narrow keV Gaussian line to the BB+B model has the effect of reducing the requirement of higher-than-line-of-sight absorption, and improving the (111The F-test probability is %. Although the improvement is not as dramatic as in the equivalent case with R+B model, this is due to the lower minimum value in the BB+B model. The final value is the same for both sets of models for 3 DoF less). While these component might be physically meaningless, they are nevertheless reminiscent of the more sophisticated models, such as those used in the data of Her X-1 or 4U1626-67 observed with the LECS (Owens et al. 1997; Oosterbroeck et al. 1997), that include also line emission at low energies, over the black-body model, and might be an indication that more sophisticated models than those of Table 5 should be attempted, when improved quality spectral data will become available.
| Model(s) | NH | kTs | 90% err | 90% err | kTh | 90% err | (DoF) | Notes | |
|---|---|---|---|---|---|---|---|---|---|
| BeppoSAX LECS data | |||||||||
| P | 10 | – | 1.9 | — | 2.0 (33) | ||||
| B | 5.8 | – | 5 | — | 2.7 (33) | ||||
| BB+B | 12 | 0.13 | 0.11-0.15 | 6.0 | 4.7-6.8 | 1.0 (31) | (1) | ||
| BB+B | 7 | 0.15 | 0.13-0.17 | 6.4 | 5.7-7.3 | 1.2 (32) | (2) | ||
| R+B | 7.5 | 0.33 | 0.25-0.56 | 5.9 | 5.3-6.6 | 1.1 (31) | |||
| BB+P+BB | 10 | 0.15 | 0.11-0.18 | 1.9 | 1.5-2.2 | 0.89 | 0.72-1.12 | 0.9 (29) | (1) |
| R+P+BB | 11 | 0.51 | 0.29-0.70 | 2.2 | 1.9-2.5 | 1.07 | 0.91-1.20 | 0.9 (29) | (1) |
| BeppoSAX LECS+PDS data | |||||||||
| BB+P+BB | 12 | 0.15 | 0.11-0.18 | 1.9 | 1.6-2.3 | 0.92 | 0.75-1.15 | 0.9 (35) | (3) |
| BB+P+BB | 11 | 0.15 | 0.11-0.18 | 1.8 | 1.6-2 | 0.84 | 0.75-0.95 | 0.9 (36) | (4) |
| R+P+BB | 10 | 0.50 | 0.3-0.7 | 2.1 | 1.9-2.5 | 1.06 | 0.94-1.2 | 0.9 (35) | (3) |
| R+P+BB | 9.3 | 0.48 | 0.3-0.7 | 1.9 | 1.8-2.0 | 0.93 | 0.82-1.09 | 1.0 (36) | (4) |
| ASCA SIS bright data | |||||||||
| P | 2 | - | 1.73 | 1.69-1.77 | 1.2 (276) | (5) | |||
| B | 1 | – | 5.6 | 5.2-6 | 1.2 (276) | (5) | |||
| BB+B | 14 | 0.11 | 0.12 | 5 | 4.8-5.2 | 1.1 (274) | (6) | ||
| R+B | 7 | 0.65 | 0.2-0.8 | 5.7 | 5-6.6 | 1.1 (274) | |||
NOTES:
Models are: B=Bremsstrahlung; BB = Black Body;
P=Power law; R=Raymond, with fixed
abundances at 100% cosmic value. The low energy absorption is
free to vary in the 0.1 -30 cm-2 range.
kT is in keV; is the P photon index.
Total counts used in the analysis:
5038 73 counts in the keV range (LECS)
5640 898 counts in the keV range (PDS)
32790 190 counts in the keV range (SIS)
(1) The Galactic NH value is marginally consistent at the 90% level
(2) The NH is fixed.
(3) The relative normalization between the LECS and the PDS is a free
parameter, and is 2.2 for R+P+BB and 1.4 for BB+P+BB.
(4) The relative normalization between the LECS and the PDS is
fixed at 1.05
(5) The Galactic NH value is well outside the range of parameters
allowed by the fit. Upper boundary of NH is below 1
cm-2 for B, and 5 for P.
(6) The Galactic NH value is within the allowed range
2.4.1 PDS data
A significant detection in the keV range is obtained in the observation of Field 3 with the PDS detector. We have used the background-subtracted files provided by the SAX-SDC, which contains net counts.


The large field of view and lack of spatial resolution make it difficult to identify the PDS source. The field of M31 is clearly complex, so there could be one or more candidates from the MECS sources. It is also possible that a source unrelated to those detected by the MECS is responsible for the emission. However, there is only 1 bright hard X–ray source in a 1.5∘ radius around the center of field # 3 and it has been associated with M31 since the UHURU days (4U0037+39). All other sources detected with imaging missions (for example with the Slew Survey) are significantly fainter. We therefore suggest that the PDS detection is due either to a source (a combination of sources) in M31 or to an unknown, very absorbed, possibly variable background source. Since we cannot check on the second hypothesis, we have tried to further understand whether an association with one or more sources in M31 is feasible.
There are two kinds of sources in M31: for the most part they have a keV thermal spectrum, but one (possibly two) has a much harder power law. The strongest by far is the source associated with the bulge region, which can be regarded as a multitude of sources concentrated in the central part of M31. The hard source is significantly fainter than the bulge, but could give a larger contribution at very high energies. We expect that if the association is with a source in M31 it will be with sources in the center or NE part of the disk. No PDS detection is obtained from the observation of Field # 6, which is also in the PDS FoV of Field # 3. However, the upper limit is consistent with a count rate of that of Field # 3, which could be expected from a source in Field # 3, that is detected with reduced intensity due to the lower transmission of the instrument at large off-axis angles (of the order of 45% for a source at the center of Field # 3)
We have therefore tried a fit of PDS data together with either the LECS data for the bulge or the MECS data for source # 9.
We find that if we extrapolate the MECS or LECS results obtained above to the PDS range, we can account only for a fraction of the detected PDS counts, as shown in Fig. 8. The 6 keV spectrum that fits the bulge falls below the PDS detection (Fig. 8a). Since the bulge is significantly stronger than the other sources in the field, the superposition of all their contributions, if they have the same relatively steep spectrum as the bulge, will only increase the expectation by less than 30%, too little to reconcile the discrepancy (Fig. 8a). In Fig. 8b, the extrapolation of the fit of MECS data for the harder source # 9 indicates again a factor of discrepancy at the PDS energy range. Both these values are outside the expected cross-calibration uncertainties (good to 10 %, Cusumano et al. in prep.), and much higher than the relative normalization expected between instruments ( for MECS-PDS and for LECS-PDS, for sources at the field’s center). Furthermore, they do not take into account the lower transmission due to the off-axis position of the sources (that is reduced at at 10 respectively).


These results would argue against an association with one of the sources in the MECS FoV, although a combination of sources could account for a large fraction of it. However, we notice that if the bulge emission is due to the contribution of many LMXB, we can use a more appropriate model than a simple bremsstrahlung to represent the emission at high energies (White, Stella & Parmar 1988; Barret & Vedrenne 1994). We have therefore substituted the B with a P+BB model, and fitted the PDS data together with the LECS data. We find that with this model the relative normalization falls to a value of , that, while still higher than the maximum expected value, is very close to it. Moreover, as shown by Fig. 9, a value of (maximum expected value for a source 10′ off-axis) is in very good agreement with the data.
As shown in Table 5, this model is also perfectly adequate for the LECS data alone. However, when the P+BB is used for the high energy data, the BB model for the low energy excess might be preferable, since the whole BB+P+BB set requires a much lower relative normalization than the R+P+BB (although, a relative normalization of 1.2 is consistent with the data, see Table 5).
Therefore, while we cannot exclude that the PDS detection is the result of the added contribution of all sources (in particular if they have a spectrum as hard as the best fit value for source #9), it can also be explained as due mostly to the bulge, when the appropriate model for Galactic LMXB is used to describe the high energy portion of the spectrum.

2.5 Comparison with previous results
Finally, we have compared the BeppoSAX results with those of previous instruments. We expect that the bulge flux and spectrum are constant in time. While it is true that each individual source could vary, and in fact previous analysis on bulge sources have indeed shown variability (see FT, S97, P93), the spatial resolution of BeppoSAX prevents us from studying each source individually. On average therefore we expect that the global properties of the bulge do not change (a possible variability in the bulge within this observation is small, see § 2.6), and can therefore be used to cross-calibrate between different energy bands and different instruments at different times.
However, the comparison between these and previous results must be done with caution. Imaging instruments like IPC and ROSAT PSPC had a much poorer spectral resolution and much narrower energy band, so we can use them only partially to compare the spectral properties. Other missions with good spectral resolution and energy coverage were non-imaging, so that the results could apply to a larger area than discussed here. ASCA is the only mission for which we can be reasonably sure the results apply to the bulge only on a similar energy range. Since there are no reports in the literature on the observations of M31 with ASCA, we have obtained the ASCA data from the public NASA archive. One observation (sequence 63007000) is pointed almost exactly in the direction of Field 3, and contains the bulge as well as a few of the other sources in M31 reported in Table 5. We report the details of the analysis in B, limited to the bulge data. The results summarized in Table 5 indicate that the ASCA and BeppoSAX results are in excellent agreement, both for the single B or P model and the two component fit used for the BeppoSAX LECS results, although the improvement in fit quality is not as dramatic when a second component is added to the ASCA fits. This partly reflects the more limited extension of the SIS data at low energies.
We can also compare the present results with previous non-imaging hard X–ray missions, that should also be dominated by the bulge emission. Fabbiano, Trinchieri and Van Speybroeck (1987) have fitted the MPC data ( keV) with a B model with kT keV. Makishima et al. (1989) report that GINGA data instead are not well fit by simple models: both a cut-off power law or a bremsstrahlung require high absorbing column. Therefore they suggest a model also used to fit the data of the low mass binary population in our Galaxy, composed of disk-blackbody and a blackbody. A power law dominating at energies above 10 keV is also added to account for a possible pulsar contribution. As shown in the previous section, simpler models are adequate to represent the data; however, the GINGA parameters can also be used, provided that an additional component is added to account for the excess emission at low energies. The results from the bulge colors derived from ROSAT data also give support to the presence of the soft component (Irwin & Sarazin 1998).
The spectral results allow us to determine the flux of the source in different instruments. The emitted BeppoSAX LECS flux in the 2-10 keV band in a 5′ radius circle is f erg cm-2 s-1. This is insensitive to the exact model used (the B or the P+BB models of Table 5), indistinguishable in this energy range. To compare this with ASCA data we have both estimated the BeppoSAX flux in the same size region used for SIS, and we have also obtained the GIS flux in both the larger and smaller regions. For consistency, we have applied a 5.6 keV B model to the GIS data as well, in spite of the fact that this is a poor fit to the GIS data (however, the 2-10 keV flux does not change significantly if a temperature of 8 keV is assumed). We find that the total GIS and BeppoSAX flux are in excellent agreement, while BeppoSAX measures a higher flux than either of the ASCA instruments in the radius circle (LECS: ; SIS: ; GIS:).
To compare it with and ROSAT values, we have to extrapolate it to the softer passbands of those instruments. If we consider the single temperature spectrum that fits the data at high energies, we find f and f erg cm-2 s-1 with BeppoSAX , slightly smaller than reported by FT and S97, who use equivalent spectral models. On the other hand, the spectral fits indicate that a single temperature model fails to represent the data at low energies, and we find higher fluxes when we consider more complex models.
Non-imaging instruments give also a somewhat higher flux. Makishima et al. report a total flux of erg cm-2 s-1 in the 2-20 keV band from GINGA. However, if all of the emission measured by GINGA is due to M31 only, and the rough factor of 2 between bulge and total luminosity observed at softer energies holds also at higher energies, this would imply a flux of erg cm-2 s-1 in the 2-10 keV passband.
Given all of the uncertainties involved, we can probably safely assume consistency between all of these values. This ensures us that we can estimate the flux of the bulge, which we assume to be constant, in the BeppoSAX data, and use it to better evaluate the quality of the measured flux in other sources that could suffer from similar problems, to compare them with fluxes obtained with other missions and study flux variations at different epochs.
| Name | Cts | Long–term | Upper limits a | ||
|---|---|---|---|---|---|
| used | Variability | 104 s | 103–102 s | 10–5 s | |
| (#) | (b) | (%) | |||
| Source 1 | 1276 | 1.15 | 35 | 36–38 | 37–38 |
| Source 2 | 3150 | 1.30 | 24 | 24–23 | 23–25 |
| Source 3 | 1288 | 1.13 | 38 | 35–36 | 40–43 |
| Source 4 | 1049 | 0.85 | 38 | 40–42 | 45–49 |
| Source 5 | 8523 | 2.45 | 15 | 15–14 | 16–17 |
| Source 6 | 1431 | 1.05 | 33 | 34–33 | 38–42 |
| Source 7 | 3256 | 1.47 | 27 | 23–22 | 25–28 |
| Source 8 | 1481 | 1.21 | 32 | 34–33 | 37–40 |
| Source 9 | 1071 | 1.02 | 43 | 38–39 | 43–50 |
| Source 10 | 825 | 0.95 | 50 | 44–45 | 50–60 |
| Source 11 | 854 | 1.17 | 44 | 44–43 | 50–55 |
Notes:
-
a at the 99% confidence level
-
b DoF = 80 for sources 1 and 2, 170 for sources 3 to 11.
2.6 Source variability
Among the most luminous persistent X–ray sources in our Galaxy are the LMXBs. These sources often show a large flux variability on long timescales (from days up to years) and are characterized by relatively short orbital periods (of the order of hours), the modulation of which is also detected at X–ray energies (see White, Nagase and Parmar 1995). Similar objects are expected to be seen in M31 and a search for periodic and aperiodic variability was therefore carried out.
We extracted the photon arrival times for each source from a circular region corresponding to the 90% of the encircled energy of the merged data of MECS2 and MECS3. We performed a search for both periodic and aperiodic variability in the following way. We first accumulated 1000 s binned light curves for each source and searched for variations such as increases, decreases or impulsive variations within the time interval covered by the observation, through the comparison with a constant. All the sources but one are consistent with being constant (see Table 6 for details). Source # 5 is the only one showing a relatively high . However, this corresponds to a 10% flux variation, probably close to 5%, suggesting that at most 1-2 of the 50 bright sources detected in the high resolution images have varied within the observation. Caution should also be used in interpreting this flux variation, since the close proximity to the strongback might introduce some unknown low level effects related to the small scale motions of the satellite, although there is no evidence of a satellite drift during this observations.
After converting the arrival times to the Solar System barycenter, we searched for a sinusoidal modulation in the X–ray flux of the sources. We have accumulated light curves binned in 0.5 s and calculated a single power spectrum for each source over the whole observation. We adopt a recently developed technique (Israel & Stella 1996) aimed at the detection of coherent and quasi–coherent signals in the presence of additional non–Poissonian noise component in the power spectrum, while preserving the Fourier frequency resolution. In this technique, the continuum components of the spectrum at the j–th frequency are evaluated based on a logarithmic smoothing which involves averaging the spectral estimates adjacent to the j–th frequency over a given logarithmic interval excluding the j-th frequency itself. By dividing the sample spectrum by the smoothed one a white–noise like spectrum is obtained, the approximate probability distribution function of which is derived based on the characteristics of the sample spectrum. A search for coherent pulsations is then carried out by looking for peaks in the divided spectrum, for which the probability of chance occurrence is below a given detection level. If no significant peaks are found, an upper limit to the amplitude of a sinusoidal modulation is worked out for each searched frequency.
No significant periodicity was found in any of the power spectra above the 99% confidence threshold. In Table 6 the corresponding upper limits to the pulsed fraction for selected trial periods are shown.
| 2-10 keV flux | |||||
|---|---|---|---|---|---|
| Name | BeppoSAX | ROSAT | Notes | ||
| PSPC | HRI | ||||
| ( erg cm-2 s-1) | |||||
| Source 1 | 4.6 | 2.5 | 1.8 | ||
| Source 2 | 2.2 | 1.6 | 1.3 | ||
| Source 3 | 1.3 | 0.9 | 1.2 | 1 | |
| Source 4 | 2.5 | 0.4 | 1.0 | 0.6 | 2,3 |
| Source 6 | 1.2 | 0.3 | 0.7 | 0.5 | 2 |
| Source 7 | 3.6 | 1.2 | 2.3 | 1.5 | 2 |
| Source 8 | 1.6 | 1.2 | 1.7 | 1.8 | 1 |
| Source 9 | 3.4 | 0.4 | 0.3 | 0.4 | 4 |
| Source 10 | 1.3 | 1.0 | 1.0 | 1.0 | 1,2 |
| Source 11 | 1.2 | 0.9 | 0.8 | 1 | |
Notes:
-
1.
Near the strongback and/or at large off-axis (see text).
-
2.
Given the possible association with more than 1 ROSAT () source, the flux of all is reported for comparison with the BeppoSAX flux.
-
3.
Source at the edge of the field
-
4.
Flux of Source # 9 is in 4′ radius circle (see text).
To search for long term variability we compared the flux measured at different epochs by different instruments. Table 7 shows the comparison between MECS fluxes and the average fluxes obtained with and ROSAT for the different sources detected with BeppoSAX . We have converted the 0.2-4 keV fluxes given in FT, S97 and P93 to a 2-10 keV flux assuming a keV Bremsstrahlung model. When more than 1 ROSAT () source is included in the count extraction region, the sum of all fluxes is given in Table 7. The adopted count-to-flux conversion of Table 3 are expected to be reasonably accurate. However, the flux of sources at large off-axis angles or near the strongback could be under/overestimated, since the ARF (which properly models the expected spectral distribution of the photons, as already discussed) does not take into account distortions at large off-axis angles and does not properly correct for the strongback absorption. This could lead to an overestimate of the flux for sources near the strongback (although probably 40% in the worst case, and our sources are only partially affected by the strongback), and to an underestimate for very off-axis sources, in particular as a result of the small area that we had to use due to field crowdedness. In fact, the flux for source # 9 derived from a 4′ radius circle is higher by % than that obtained from the circle reported in Table 3. Unfortunately, this is the only source at large off-axis angles for which a larger area can be used to test this. All other sources (namely # 8, # 10 and # 11) are either close to the strongback or to other BeppoSAX sources.
The comparison in Table 7 indicate that BeppoSAX fluxes are systematically slightly higher than either ROSAT or fluxes. However, there appears to be a roughly constant factor of between BeppoSAX and fluxes, regardless of source position in the field, which would point to a further systematic off-set, rather than a flux increase for all sources. In fact, if we consider that most of the sources are close to or embedded in the HI disk, and that absorption effects are much more important in the softer energy bands of and even more of ROSAT, it is likely that neglect of the internal absorption in M31 in the counts-to-flux conversion in the softer enegy bands (both FT and S97 have assumed only absorption equivalent to the Galactic line-of-sight value) accounts for most of this off-set.
Three sources however deviate from this trend: source # 9 is much stronger in the BeppoSAX data of Dec. ’97 than in previous observations, and sources # 6 and (less drammatically) # 7 are stronger than measured by (ROSAT fluxes are consistent with a increase since then). Their location in M31 indicates that absorption could be severe if they are in or behind the HI ring. However, this would not be sufficient to reconcile the different fluxes. Moreover, only the spectrum of source 9 is significantly different from the one adopted in the flux-to-counts conversion, and again this is not enough to bring or ROSAT fluxes to the BeppoSAX level. It is therefore likely that these sources have varied in the years elapsed between observations. A better assessment of the amplitude variation will however require a more precise knowledge of the spectrum, which will be possible with future, broad band observations such as those available with the AXAF or XMM missions.
3 The Globular Cluster sources in M31
All M31 source detected with BeppoSAX have high X–ray luminosity (L erg s-1 in the 2-10 keV band), and have been identified mostly with globular clusters. This suggests that they are most likely Low Mass X-ray Binary sources. Although the quality of the data does not allow us a precise assessment of their spectral properties, we find that most of the high luminosity sources have a similar spectrum, that can be described with a single temperature component with kT keV. Two sources however have significantly different spectral properties: source # 3 and # 9, both identified with globular clusters, have a much harder spectrum, with .
Although detailed observations of high signal-to-noise Galactic sources might require more complex models, the spectrum of a LMXB, with a weak-field neutron star as the accreting object, is reasonably well approximated by a Bremsstrahlung model from a few to keV (see van Paradijs 1998 and references therein). In globular cluster sources, where LMXB are expected, a range in temperatures, from keV has been found from archival EXOSAT data (Callanan et al. 1995). This is the same range of temperatures we find for the globular cluster system in M31, with the possible exception of one source (# 9). Therefore it appears that the spectral properties of the globular clusters in M31 and in our Galaxy in the keV band do not differ significantly. To better model the low energy data, that cannot be reproduced simply by the effect of absorption, Callanan et al. also include a BlackBody component with kT keV. As shown by Table 4, BeppoSAX data do not require additional components, since a single P or B model plus absorption is adequate in most cases. The addition of a BlackBody component would in some cases reduce the requirement of high absorption, but without improving the quality of the spectral fit and without reconciling the NH to the line-of-sight value (for example, the absorption for source # 7 is reduced to 28 cm-2, if a keV BB is added to the P model, see Table 4).
The sample examined by Callanan et al. spans a rather large range in X–ray luminosities (from 5 to 5 erg s-1), while the globular cluster sources in M31 are all bright sources (L erg s-1). All of the sources studied by Callanan et al. have metallicities lower than 1/2 solar, while the BeppoSAX globular clusters have metallicities up to (Huchra et al. 1991). It has been recently proposed by Irwin & Bregman (1999) that the soft X–ray properties of the globular cluster systems in M31 depend on metallicity, in the sense that the spectra become softer with increasing metallicity. No such trend was found in the Galactic globular clusters, however Irwin & Bregman suggest this is due to the lower average metallicity considered. Like for the Galactic clusters, no trend is observed between the 2-10 keV spectra of our sources and metallicity: the same best fit temperature is derived for clusters at the opposite end of the metallicity range. Although the sample is limited (more so than the ROSAT sample studied by Irwin & Bregman) and spans a somewhat narrower range in metallicity (they have 1 object with higher metallicity), we cannot extend their suggestion to the harder energies. We have also considered the softer energy band, where however the sample is further reduced both in numbers (3 objects) and in metallicity (all metal poor). As discussed above, the BeppoSAX data do not require a second component in the fit. While this is probably due to the data quality, it could again be interpreted in the framework of metallicity: we have LECS data only for the lower metallicity objects, and if the requirement of a second component is not as stringent for these objects, our 1-component fits are consistent with the low metallicity globular cluster population of our Galaxy.
We have also compared the best fit spectral parameters derived from ROSAT and BeppoSAX data. The comparison is not straightforward, given the almost completely separate wavebands considered, also in view of the supposedly complex spectrum of these sources. Nontheless, we find that the results are in good, though loose, agreement. The higher than Galactic absorption required by the fit of sources 2 and 7 is also detected in the ROSAT data (ROSAT source 73 and 205 respectively have the highest values of NH in the Irwin & Bregman sample). There is a much looser agreement with the temperatures; however, the determination of temperatures such as those measured in these sources is very hard with ROSAT data. We notice however that the spectra of Irwin & Bregman can be divided in two classes: hard (kT 3 keV) and soft (kT ). While we do not have any evidence for the soft spectra, it is possible that they represent the soft component that we do not measure in our data, either for lack of LECS data (source # 8) or possibly because of confusion in the presence of high absorption (source # 2). Given the extremely limited size of the sample, and the limited quality of our data, we have to wait for future observations of M31 to really better measure the spectral properties of its globular cluster population in the entire keV band.
Source 9 has a much harder spectrum than all other sources in M31, and in particular it is harder than all other globular cluster sources. Hard spectra such as these are more typical of binary systems containing a strong-field neutron star, or black hole candidates. This is a rather unusual spectrum for a globular cluster source, as none are known in our own Galaxy. We therefore suggest two possible interpretations: either the surce has been incorrectly associated with a globular cluster, or this is the first evidence of black hole formation in a globular cluster. While this latter would be a more intriguing possibility, we cannot at the present time rule out a mis-identification. A precise determination of the X-ray position of this very hard source will be possible with future imaging telescopes and will allow us to confirm its identification with the optical counterpart.
4 The bulge of M31
We have measured the spectrum of the M31 bulge as a whole. We find that a single temperature thermal model can represent well the LECS data at high energies up to keV, but fails to account for excess emission at low energies. Moreover, if the detection at keV obtained with the PDS is associated with the bulge, a more complex model is needed also at high energies. Unfortunately, the data quality does not allow us to uniquely identify the different components required to fit the entire keV range of data.
High energy emission: Until imaging data at high energies are available, the association between the emission at keV and the bulge cannot be confirmed. When a combination of power law and Blackbody (also used for the Galactic LMXB) is fitted to the LECS data of the bulge, the PDS data appear as the extension at higher energies of the bulge emission, indicating that the association is at least likely. However, we cannot unambiguously determine the spectral models to describe the data: a power law plus black body is sufficient to model the LECS + PDS data, but the BB+DiskBB+P model, with the parameters used for GINGA data, could also describe BeppoSAX data.
Soft excess: Within the LECS data, we can model equally well the soft component with either a keV Black Body or a keV model. However, when the Power Law + Black Body is used at high energies, the Black Body might be slightly preferred.
We have tried to understand whether the model used for the bulge is consistent with that of Galactic sources. The much better quality spectra that can be obtained for these latter complicates the comparison, since more detailed complex models are needed to fit the data. On the other hand, the much higher typical line-of-sight column densities of LMXB in the disk of our Galaxy (with the exception of those nearby) prevent a proper study of their soft spectra. Two of the most nearby Galactic LMXB’s (Hercules X-1 and 4U 1626-67) have been recently observed both with ASCA and with BeppoSAX . Their spectrum needs at least two components; in either case a Black Body at low energies and a power law have been used. Residual excess emission around 1 keV has been modeled with Fe lines in Hercules X-1 (Oosterbroeck et al. 1997) and with O and Ne lines in 4U 1626-67 (Owens et al. 1997). The LMXB in globular clusters also require a two component model, composed of a Black Body and Bremsstrahlung or power law component (Callanan et al. 1995).
The requirement of two Black Bodies in the M31 data is due to the need of accounting for both excess at low energies and for the high energy emission, while retaining enough curvature in the spectral shape to be consistent with the energy distribution of the photons.
The temperature of the softer Black Body component ( 0.15 keV, see Table 5) is intermediate between Her X-1 and 4U 1626-67 (kT 0.1 and 0.3 keV respectively, Oosterbroeck et al. 1997; Owens et al. 1997), and represents a similar percentage of the total 0.1 - 10 keV flux. However, it gives a much smaller contribution if softer energy bands are considered (, in the ROSAT band, the unabsorbed flux due to the Black Body is 30% of the total flux, compared to 50% in Her X-1). The hard part of the spectrum is however significantly different, in particular it is much softer than in the two LMXB, and more reminescent of the spectra of the globular cluster sources. Line emission, that has been recently added to the spectra of disk LMXB, is not formally required by our data. However, this might only be a limit of the data quality, rather than an intrinsic difference between the two groups of sources.
It therefore appears that the spectral properties of the bulge reflect both the disk and the globular cluster LMXB properties (assuming that Her X-1 and 4U 1626-67 are typical of disk LMXB, which they could not be, since they are pulsating sources). This result is not surprising, since several sources contribute to the bulge emission, and a mixture of disk and globular cluster LMXB is to be expected, given the proposed identifications (TF; S97; P93).
From the normalizations of the Black Body models, we derive a similar luminosity L 4 erg s-1 in both components, and surface areas r2 and km2 for the soft and the hard components respectively. The parameters for this latter are quite reasonable, and suggest the presence of neutron stars in the area, consistent with the imaging data (TF, P93). The parameters of the soft Black Body are less clearly understood. The luminosity would suggest the presence of Her X-1 type sources (assuming a Black Body luminosity of 6 erg s-1, Dal Fiume et al. 1998), each with a radius of km (which is larger than the radius of the neutron star in the system as this component is thought to be due to reprocessing in the accretion disk). This is in contrast both with the number of neutron stars derived from the hard data, with the total luminosity and with the shape of the hard spectrum. However, until we can precisely assess the proper model for the soft component, we cannot reliably determine its intrinsic parameters.
Alternatively, we could consider whether the soft excess could be attributed to the diffuse emission apparent in the ROSAT bulge image, that P93 do not attribute to individual lower luminosity sources. P93 estimate that % of the total bulge luminosity could be attributed to either a new class of sources or to a hot interstellar medium. In this latter case, it would most likely have a plasma spectrum. In our analysis however we find that the component contributes 15% of the bulge luminosity in the ROSAT band, and would therefore only account for 1/2 of the residual emission. Furthermore, this interpretation poses limits to the presence of Her X-1 type sources from the bulge, since they also appear to contribute significantly to the soft band. Spatially resolved spectra of the bulge are needed to clarify the issue further.
Irwin & Sarazin have recently suggested that LMXB sources could be entirely responsible for the soft X–ray emission detected in the X–ray faintest early type galaxies. They suggest that the colors of LMXB and of the bulge of M31 determined within the ROSAT band are in excellent agreement with those of the low L objects, and that consequently the need to resort to additional components (stellar coronae, a hot interstellar medium) are significantly reduced. While the presence of at least 2 components in the bulge data has been established, with roughly the correct parameter values, which would support Irwin & Sarazin’s proposal, the relative contributions appear to be different from what is measured in low X–ray luminosity early type galaxies.
In early type galaxies, the soft and hard components contribute almost equal amounts in the 0.1-2 keV (ROSAT) band. In the harder band (0.2-4 keV) the hard-to-soft ratio is and becomes in broader, harder bands (Kim et al. 1996; Fabbiano, Kim & Trinchieri 1994). In the R+B model (used for the early type galaxy spectra), the hard component contributes the soft component in the three bands respectively (although similar ratios are found also in the ASCA results, this cannot be used as a strong support, since ASCA data do not formally require the soft component). This would suggest that while qualitatively similar, the spectrum of the M31 bulge cannot entirely reproduce the spectra of low X–ray luminosity early type galaxies, that require an additional component over the pure LMXB contribution. The positive detection of gas in one of the low L early type galaxies, NGC 1316 (Kim et al. 1998), further reinforces the need of more than just binaries in these objects. Clearly, the presence of a soft component in the spectral properties of LMXB will have to be properly taken into account to correctly measure the contribution from an additional soft component in early type galaxies. On the other hand, the present observation shows that the spectral analysis of sources as complex as the bulge of M31, in which the contribution of several different components and/or objects are expected, requires high signal to noise data over a large energy range, to properly assess the individual contributions, and correctly interprete the origin of each of them. It is to be expected that the forthcoming high throughput and high spatial resolution missions such as XMM and AXAF will give us the wealth of data necessary to properly address the study of complex sources such as galaxies.
5 Conclusions
We have measured the spectral characteristics of 10 individual sources and of the bulge region in M31.
Most of the sources we have detected are identified with globular cluster, and they appear to have spectral properties consistent with those of the Milky Way sources. One of them however appears to have a significantly harder spectrum, uncharacteristic of LMXB with a weak field neutron star as the accreting object. Since High Mass X–ray binaries are extremely unlikely in globular clusters, we propose that either this is a mis-identification, or that the LMXB is a black-hole candidate. This would be the first such object detected in globular clusters.
The bulge of M31 as a whole has a multicomponent spectrum. At high energies, it is well modeled with a LMXB spectrum, consistent with the high resolution images that suggest the dominant presence of many individual sources in the area. At low energies, however, an additional component is needed to model excess emission below keV, also possibly associated with the LMXB disk population of the bulge.
High energy emission is detected at keV with the PDS instrument. It is likely that a major fraction of this emission results from the M31 bulge, although a contribution from other M31 sources can also be expected.
Appendix A MECS data for the bulge
As already discussed, due to the configuration of the BeppoSAX satellite, the positions of the sources are different in the two MECS instruments. In particular, the peak of the bulge emission is located right under the circular structure of the strongback in MECS2, while it is at a smaller off-axis angle in MECS3. The correction applied to the two sets of data are therefore different. On the other hand, the customized ARF that we have produced takes into account the effects of the obscuration from the “strongback”, as shown by the shape of the spectral models folded through the instrument response. Moreover, the reliability of the ARF has been further confirmed also on the spectral analysis of a couple of pulsars that are located at different off-axis angles in different observations, as already discussed earlier.
The corrections included in the ARF assume that the photons are distributed as a point source and refer to the peak position. This would suggest that the effective area file produced for MECS2 simulates more accurately the effects of the obscuration from the strongback than that produced for MECS3, for which a more sophisticated model for the spatial distribution of the photon should be used, to take into account the fact that a larger fraction of photons than expected based on a PSF model are obscured at off-peak positions. We also noticed that, if this assumption is correct, the flattening observed at lower energies in MECS3 is consistent with a heavier absorption, not properly corrected.
On the other hand, data obtained in a region covering the bulge emission but small enough to be “free” from the strongback contamination, should provide a cleaner way of determining the spectral parameters of the bulge (if we choose to remain inside the strongback, where calibrations are better, we are in a situation analogous to source # 7 w.r.t. the strongback). In MECS3 we can define a circle centered on the peak position of the bulge emission, while in MECS2 we can define only regions at the outskirts of the bulge. However, if the spectral parameters are uniform across the entire region this should not introduce additional parameters. We find that the spectral results obtained from these smaller areas are consistent with those from the whole source in the same instrument. This suggests that there are residual calibration problems even in regions “free” of the strongback (caution however should be taken in defining a region as “free” of the strongback, since the boundaries of its effects are not sharp, and obscuration in its vicinities also also depend on the stability of the satellite during the observation). As already mentioned, the effects of the strongback on the spectral distribution of the photons from a point source are accounted for. We conclude that the extended and complex morphology of the source is responsible for the failure to reconcile the spectra from the two MECS, since it is likely that a very accurate and specific modeling not available at the present time is required to reproduce the effects of obscuration and scattering produced by the strongback.
We have further checked the above considerations with LECS data. As discusses in § 2.4, LECS should provide a cleaner set of data for the bulge region. For a direct comparison with the MECS data, we have used the LECS data in the keV range. A single power law model gives (intermediate between the two MECS), but it is not a good fit (minimum =1.5 for 14 Degrees of Freedom (DoF)). A broken power law or a bremsstrahlung model significantly improve the minimum value (), again with best fit parameters intermediate between the single MECS values: , , E, = 0.8 for 13 DoF; or kT keV, = 0.8 for 14 DoF.
Appendix B ASCA data
We retrieved the screened data files processed with REV2 from the archive. We have used data from all 4 instruments without further cleaning of the data, and selected the “bright” data mode for SIS0 and SIS1. This results in ks exposure for GIS, and 76 ks and 81 ks for SIS0 and SIS1 respectively. Spectral data have been extracted in circles, centered at the peak position of the X–ray source coincident with the bulge. For GIS data, we have selected a circle of 20 pixel radius (), while for SIS data we have used a smaller circle of 30 pixels () so that the source region is entirely contained in the CCD chip. This causes a problem in the flux determination, but should not affect the spectra if the characteristics are the same throughout the region. The background was obtained from a circle of the same dimension at the same detector position from the blank sky fields also available from the ASCA archive. ARF files have been obtained with the routine in and the appropriate RMF have been obtained from the archive for GIS and build with for SIS.
We have used the keV range for GIS and keV for SIS, to restrict ourselves to the best calibrated energies. We have then followed the same procedure as for the BeppoSAX data, first on the SIS and GIS separately. We have forced the spectral parameters to be the same in different instruments but let the normalization free. At high energies, the data can be fit by a thermal bremsstrahlung model, but the best fit temperatures of GIS and SIS are significantly different, higher for GIS than for SIS. An excess over a single temperature model is present at low energies. A discrepancy between GIS and SIS was already noticed in the spectral data of 3C 273, reported in the comparison of ASCA/XTE/BeppoSAX results (Yaqoob et al. 1997), although the discrepancy goes in the opposite sense than here. We checked that this result is not due to the different extraction regions (smaller for SIS) by extracting the GIS in the same size circle, and found almost identical best fit values. Since ASCA-SIS, BeppoSAX -MECS and XTE-PCA agree in the case of 3C 273, we have decided to use only SIS data in this comparison. The results of the spectral fits are reported in Table 5.
Acknowledgements.
This work has received partial financial support from the Italian Space Agency. GT thanks Prof. Trümper and the MPE for hospitality while part of this work was done. TB was supported by NWO Spinoza grant 08-0 to E.P.J.van den Heuvel. The SAX-SDC team has been extremely useful, cooperative and kind in leading us through the complexity of the BeppoSAX instruments. We thank the referee, Dr. J. Irwin, for useful comments that led to an improved version of the paper.References
- (1) Barret D, Vedrenne G. 1994, ApJS 92, 505,
- (2) Boella G., Butler R. C., Perola G. C., Piro L., Scarsi L., Bleeker J. A. M. 1997a, AAS 122, 299
- (3) Boella, G., Chiappetti, L., Conti, G., Cusumano, G., Del Sordo, S., La Rosa, G., Maccarone, M. C., Mineo, T., Molendi, S., Re, S., Sacco, B., Tripiciano, M. 1997b AAS, 122, 327
- (4) Butler R. C. & Scarsi L. 1990, SPIE 1344, 465
- (5) Callanan P. J., Penny A. J., Charles P. A. 1995, MNRAS 273, 201
- (6) Crampton D., Hutchings J. B., Cowley A. P., Schade D. J., Van Speybroeck L. P. 1984 ApJ 284..663
- (7) Dal Fiume D., Orlandini M., Cusumano G., Del SOrdo S., Feroci M., Frontera F., Oosterbroeck T., Palazzi E., Parmar A.N., Santangelo A., Segreto A., 1998 AA 329, L41
- (8) Fabbiano G., Trinchieri G. and Van Speybroeck L. 1987 ApJ 316 127
- (9) Fabbiano G., Kim D.-W. & Trinchieri G. 1994 ApJ 429, 94
- (10) Fiore F. et al 1999, Technical Report v1.2, BeppoSAX SDC, available online at ftp://www.sdc.asi.it/pub/sax/doc/software_docs/saxabc_v1.2.ps
- (11) Frontera F., Costa E. Dal Fiume D., Feroci M., Nicastro L., Orlandini M., Palazzi E., Zavattini G. 1997 AAS 122 357
- (12) Giommi P., Fiore F., Perri M. 1998, preprint
- (13) Huchra John P., Kent Stephen M., Brodie Jean P. 1991 ApJ 370, 495.
- (14) Israel G.L. & Stella L., 1996, ApJ 468, 369
- (15) Israel G.L. Oosterbroek T., et al 1999, AA, in press
- (16) Irwin J.A and Bregman J.N 1999 ApJL 510 L21
- (17) Irwin J.A. and Sarazin C. L. 1998 ApJ 499 650.
- (18) Kim D.-W., Fabbiano G., Matsumoto H., Koyama K., Trinchieri G. 1996 ApJ 468, 175
- (19) Kim D.-W., Fabbiano G., Mackie G. 1998, ApJ. 497, 699.
- (20) Makishima K., Ohashi T., Hayashida K., Inoue H., Koyama K., Takano S., Tanaka Y., Yoshida A., Turner M. J. L., Thomas H. D., Stewart G. C., Williams R. O., Awaki H., Tawara Y. 1989 PASJ 41, 697
- (21) Oosterbroek T., Parmar A.N., Martin D.D.E., Lammers U. 1997 AA 327 215
- (22) Owens A., Oosterbroek T., Parmar A.N. 1997 AA 324 L9
- (23) Parmar A. N., Martin D. D. E., Bavdaz M., Favata F., Kuulkers E., Vacanti G., Lammers U., Peacock A., Taylor B. G. 1997, AAS 122 309
- (24) Primini F. et al 1993, ApJ 410 615 [P93]
- (25) Supper R., Hasinger G., Pietsch W., Truemper J., Jain A., Magnier E.A., Lewin W.H.G., Van Paradijs J. 1997, AA 317 328 [S97]
- (26) Trinchieri G. and Fabbiano G. 1991, ApJ 382, 82 [TF]
- (27) van Paradijs J. 1998, “The many faces of neutron stars”, R. Bucchieri, J. van Paradijs, M.A.Alpar (eds), Kluwer Academic Publishers.
- (28) White N.E., Nagase F., Parmar A.N. 1995 “X-ray binaries”, eds. Lewin W.H.G., van Paradijs J. & van den Heuvel E.P.J., Cambridge University Press, Cambridge, p.1
- (29) White N E, Stella L, Parmar A. 1988 ApJ 324, 363
- (30) Yaqoob T. and ASCA GOF 1998 available on line at ftp://rosserv.gsfc.nasa.gov/pub/yaqoob/3c273/asca/memo2