Detection of CO (2–1) and Radio Continuum Emission from the 4.4 QSO BRI 13350417
Abstract
We have detected redshifted CO (2–1) emission at 43 GHz and radio continuum emission at 1.47 and 4.86 GHz from the = 4.4 QSO BRI 13350417 using the Very Large Array. The CO data imply optically thick emission from warm ( K) molecular gas with a total mass, (H2), of 1.50.3 , using the standard Galactic gas mass-to-CO luminosity conversion factor. We set an upper limit to the CO source size of , and a lower limit of ), where is the gas excitation temperature. We derive an upper limit to the dynamical mass of 210sin , where is the disk inclination angle. To reconcile the gas mass with the dynamical mass requires either a nearly face-on disk ( 25∘), or a gas mass-to-CO luminosity conversion factor significantly lower than the Galactic value. The spectral energy distribution from the radio to the rest-frame infrared of BRI 13350417 is consistent with that expected from a nuclear starburst galaxy, with an implied massive star formation rate of 2300600 yr-1.
1 Introduction
By selecting for very red, point-like optical sources, McMahon (1991) has identified a large sample of QSOs from the APM survey (see Irwin, McMahon, & Hazard 1991; Storrie-Lombardi et al. 1996). Omont et al. (1996a) have made the remarkable discovery that a significant fraction of these high QSOs show thermal dust emission. Of their sample of 16 QSOs at , a total of 6 sources show dust emission at 230 GHz, with implied dust masses of 108 to 109 . Follow-up observations of three of these dust emitting QSOs have revealed CO emission with implied molecular gas masses 1011 (Ohta et al. 1996; Omont et al. 1996b; Guilloteau et al. 1997, 1999). Omont et al. (1996a) speculate that “such large amounts of dust [and gas] imply giant starbursts at , at least comparable to those found in the most hyperluminous IRAS galaxies”. However, the evidence for active star formation in these sources remains circumstantial, primarily based on the presence of large gas reservoirs. It remains possible that the dust is heated by the active galactic nucleus (AGN), rather than by a starburst.
The source BRI 13350417, which has an optical redshift of , is the second brightest source at millimeter wavelengths in the Omont et al. (1996a) sample. Its optical spectrum shows strong absorption by Ly and metal lines at the source redshift (Storrie-Lombardi et al. 1996). Guilloteau et al. (1997) have detected CO (5–4) line emission toward BRI 13350417 with an implied gas mass 1011 . The CO(5–4) line has a width of 420 60 km s-1 (FWHM) and is centered at .
In this paper we present detections of redshifted CO (2–1) emission at 43 GHz and radio continuum emission at 1.47 GHz and 4.86 GHz using the Very Large Array (VLA). These data constrain the temperature of the molecular gas to be fairly high ( 30 K). We find that the shape of the spectral energy distribution (SED) of BRI 13350417 from the radio into the rest frame infrared is similar to that of the nuclear starburst galaxy M82. Our data support the idea that the radio continuum and thermal dust emission are powered by a starburst that is concurrent with the AGN activity in BRI 13350417. We use = 75 km s-1 Mpc-1 and = 0.5.
2 Observations and Results
BRI 13350417 was observed with the 3 km (C) configuration of the NRAO111The National Radio Astronomy Observatory (NRAO) is operated by Associated Universities, Inc. under a cooperative agreement with the National Science Foundation. VLA at 4.860 GHz on 1999 Feb. 21 and 26 for a total of 4 hours and at 1.465 GHz on Nov. 5 and Dec. 26, 1999 for a total of 2 hours. Standard amplitude and phase calibration were applied, and the absolute flux density scale was set by observing 3C 286. Standard self-calibration and high dynamic range imaging procedures were employed (Perley 1999). The response of the “dirty” beam was deconvolved using the CLEAN algorithm to a minimum residual surface brightness level of 2 times the rms noise in the images. The 4.86 GHz image was restored with a Gaussian beam of size (FWHM) and a major axis position angle (PA) of 114∘, measured east of north. The restoring beam of the 1.47 GHz image was a 18 Gaussian of PA 44∘.
The source was detected at both 1.47 GHz and 4.86 GHz. It appears unresolved at both frequencies and its flux density, , is 22043 Jy and 7611 Jy at 1.47 and 4.86 GHz, respectively. The source position at 4.86 GHz is R.A.= , decl.= 04 (J2000) with an uncertainty of in both coordinates. This is consistent, within the errors, with the positions of BRI 13350417’s optical, mm continuum, and CO (5–4) line emission. The spectral index, , between 1.47 and 4.86 GHz is 0.820.17, where .
We observed BRI 13350417 with the 1 km (D) configuration of the VLA at 42.6 GHz on 1999 March 7 and 9 for a total of 16 hours. The absolute flux density scale was set using 3C 286 for which we assumed a flux density of 1.5 Jy corrected for atmospheric opacity to the top of the atmosphere. Fast switching phase calibration was employed (Carilli & Holdaway 1999). We switched with a total cycle time of 180 s between BRI 1335–0417 and the celestial calibration source 1334127. The rms phase variations after calibration were 15∘ on the longest (1 km) baselines. The spatial resolution is (FWHM, major axis oriented north-south).
A severe limitation at the VLA for observing broad lines at high frequencies is the maximum correlator bandwidth of 50 MHz, and the limited number of spectral channels (7) when using this bandwidth and dual polarization. The bandwidth of 50 MHz corresponds to a velocity coverage of only 350 km s-1 at 43 GHz, which is further reduced by bandpass roll-off at the band edges. While this is comparable to the CO (5–4) line FWHM of 420 60 km s-1, some emission in the line wings will be lost. Since these correlator limitations preclude a meaningful determination of the line profile, we chose to observe in continuum mode, using 2 IFs with 2 polarizations each. One of the IFs was centered on the emission line (42.635 GHz), while the second was centered 1400 km s-1 off the line (42.835 GHz). This observing set-up maximizes sensitivity to the integrated line intensity but does not yield information on the line profile, which was well-determined for the CO (5–4) line by the observations of Guilloteau et al. (1997). Assuming that the CO (2–1) and (5–4) line profiles are similar, and taking into account the limited width of the continuum band employed, we estimate that we are missing about 37 of the velocity-integrated line emission in BRI 13350417.
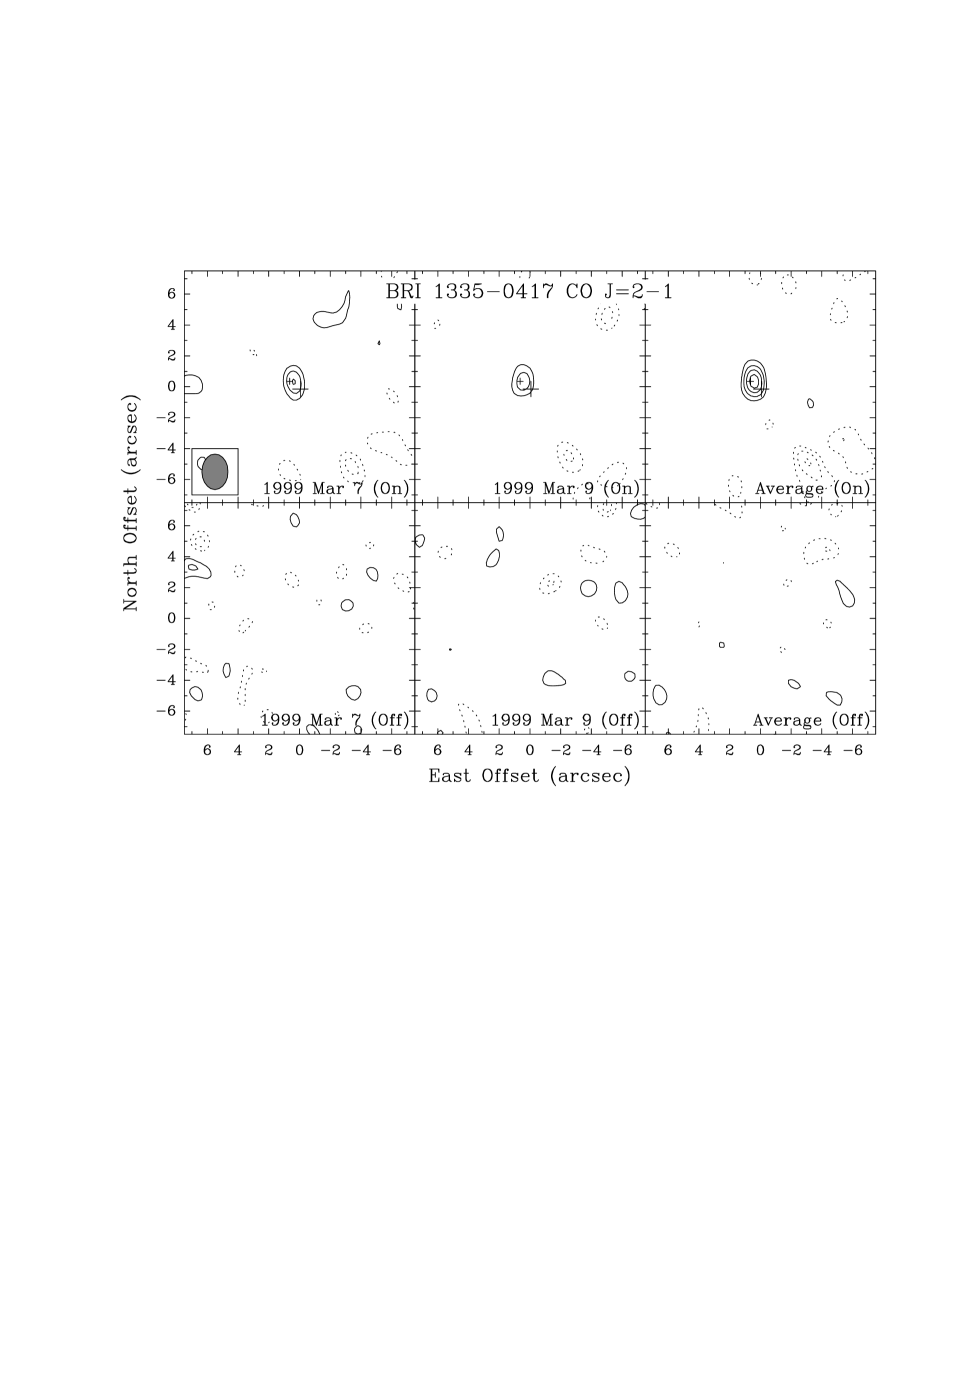
The VLA images (Fig. 1) show a clear detection of CO (2–1) emission from BRI 13350417 on both observing days. Fig. 1 shows the on-line and off-line images made from the data taken on each day separately, as well as from the averaged dataset. From the map made from the averaged data, we estimate a peak flux density of 0.74 0.12 mJy at R.A.= , decl.= 04 (J2000) with an uncertainty of in both coordinates. No emission is seen in the off image at the position of the quasar, to a 2 upper limit of 0.24 mJy. The CO source’s observed brightness temperature is 0.12 K. The CO emission region is spatially unresolved, with an upper limit to its size of determined from Gaussian model fitting.
The velocity-integrated line intensity for the CO (2–1) line from BRI 13350417 is 0.320.06 Jy km s-1, corrected for the 37 missing from the VLA bandpass. Using the CO (5–4) data of Guilloteau et al. (1997), we determine a velocity-integrated CO (2–1)-to-(5–4) line flux ratio of 8.71.9. This value is roughly consistent with the constant brightness temperature value of 6.25 (i.e. integrated line flux increasing as ) expected for optically thick emission in both lines, for a fixed source size.
Extrapolating the dust continuum spectrum from 230 GHz, where 8 mJy are observed (Guilloteau et al. 1997), to 43 GHz using a spectral index of +3.25, one calculates an expected continuum flux density of 34 Jy at the latter frequency, which is well below our noise level of 0.12 mJy in the off-line channel.
3 Discussion
The critical question concerning BRI 13350417 is whether the dust and radio continuum emission are powered by the AGN, or star formation, or both. Fig. 2 shows the integrated spectral energy distribution for BRI 13350417 for rest frame frequencies from 7.6 GHz up to 4600 GHz, normalized to the spectrum of the nuclear starburst galaxy M82. For demonstrative purposes we have quantified the spectrum of M82 using two accurate polynomial fits: one to the synchrotron emission which dominates at frequencies below 100 GHz, and a second to the thermal dust emission which dominates above 100 GHz. All the data points for BRI 13350417 fall within 2 of the M82 curve. The agreement between the SED of BRI 13350417 and M82 argues in favor of star formation playing the dominant role in heating the dust and powering the radio continuum emission from BRI 13350417, although we cannot preclude a contribution from the AGN.
It is important to note that, while the shapes of the SEDs are similar, the luminosity of BRI 13350417 is 1.2 ergs s-1 Hz-1 at 1.47 GHz in the rest frame of the source, assuming a radio spectral index of , while that of M82 is a factor 1400 lower (assuming a distance of 3 Mpc to M82). For comparison, the rest frame 1.47 GHz luminosity of BRI 13350417 is a factor 40 larger than that of Arp 220, and even a factor 2 larger than that of the nearby low luminosity radio galaxy M87. If the emission is powered by star formation, a very rough estimate of the massive star formation rate in BRI 13350417 can be derived from the radio and submm continuum emission using equations 1 and 2 in Carilli & Yun (1999). Both values are consistent with a star formation rate of 2300600 yr-1. We emphasize that this is at best an order-of-magnitude estimate.
That the CO (2–1) and (5–4) lines from BRI 13350417 have, within the uncertainties, equal brightness temperature implies that the molecular gas must be fairly warm, with a lower limit to the rotational temperature of 30 K set by the excitation of the CO (5–4) line, and that the line emission is optically thick. Our VLA imaging implies an upper limit to the CO source size of . A lower limit to the source size can be derived assuming a single, homogeneous, optically thick emitting region (Ohta et al. 1996). The beam filling factor is given by: = , where and are the source and beam solid angles, respectively, is the observed line brightness temperature (0.12 K), and the line excitation temperature, , is assumed to be equal to the intrinsic (rest frame) source brightness temperature. This calculation leads to a minimum source diameter of .
An interesting problem that has arisen in the study of extreme nuclear starburst galaxies is that the implied gas mass is comparable to, or sometimes greater than, the dynamical mass (Tacconi et al. 1999; Bryant & Scoville 1996; Ohta et al. 1996; Scoville, Bryant, & Yun 1997; Downes & Solomon 1998). BRI 1335–0417 is an extreme example of this “excess mass” problem. From the CO(2-1) luminosity we estimate a molecular gas mass, (H2), of 1.50.3 , using equation 5 in Solomon, Radford, and Downes (1992), which assumes the standard Galactic gas mass-to-CO luminosity conversion factor. We have also included an upward correction to the mass of 30 arising from the fact that the line brightness temperature is measured relative to that of the microwave background radiation. This correction factor is 30 for a gas at 50 K at z = 4.4. Using the upper limit to the source radius of or 2.25 kpc, and assuming a rotational velocity of 200 sin km s-1, where is the disk inclination angle with respect to the sky plane, leads to an upper limit to the dynamical mass of sin. Comparing this to the gas mass leads to an upper limit to the inclination angle of . The fact that the source is a broad line QSO is consistent with a disk rotation axis oriented within of our line of sight (Barthel & Miley 1989). However, the persistence of this mass problem for a number of sources is becoming difficult to reconcile with all the sources being close to face-on.
For high redshift sources, gravitational lensing could act to magnify the CO emission, leading to an overestimate of the gas mass. However, for BRI 1335–0417 there is thus far no evidence for multiple imaging due strong gravitational lensing. Another way to mitigate the excess mass problem is to adjust the cosmological parameters. However this would require a decrease in the luminosity distance, i.e. an increase in or , which would be contrary to current observational evidence (Peebles 1999; Turner 1999).
Perhaps the most likely cause for the excess mass problem is that applying the Galactic gas mass-to-CO luminosity conversion factor causes an overestimate of the gas mass for extreme objects such as BRI 1335–0417. In particular, it has been shown that assumptions underlying the standard Galactic conversion factor involving CO emission from a conglomeration of many small, highly optically thick clouds lead to overestimates of the gas mass by a factor 3 or more relative to a single homogeneous disk model (Combes, Maoli, & Omont 1999; Downes & Solomon 1998; Solomon et al. 1997). Assuming a factor 3 decrease in the gas mass leads to an upper limit to the inclination angle, , of . Overall, a combination of small inclination angle plus a lower gas mass-to-CO luminosity conversion factor may be sufficient to solve the excess mass problem for BRI 1335–0417. Nevertheless, it appears likely that in this source the dynamical mass is dominated by the molecular gas mass on scales of a few kpc.
BRI 13350417 has similar properties to the well-studied QSO BR 12020725 at , including (i) similarity of the SED with that of the starburst galaxy M82 (Kawabe et al. 1999; Yun et al. 1999), (ii) similar dust and gas masses (Ohta et al. 1996; Omont et al. 1996b), (iii) a similar massive star formation rate as derived from the radio continuum and dust emission (Kawabe et al. 1999), (iv) a constant brightness temperature for the CO emission, at least up to the (5–4) transition (Kawabe et al. 1999), and (v) similar optical spectra, in particular, strong associated absorption lines suggesting a gas-rich environment (Storrie-Lombardi et al. 1996). Kawabe et al. (1999) have made a detailed comparison between the CO emission from BR 12020725 and that from the starburst nucleus in M82. The nucleus of M82 also shows constant brightness temperature up to CO (5–4) (Güsten et al. 1993). From this comparison, Kawabe et al. conclude that at least half of the molecular gas mass has a temperature between 50 K and 70 K and a density between 104 cm-3 and 105 cm-3. The pressure in the molecular gas is then a few times dyn cm-2. Such high pressures have been proposed for massive nuclear starburst regions in nearby ultraluminous infrared galaxies (Condon et al. 1991).
A significant difference between BRI 13350417 and BR 12020725 is that the latter is a double source with a separation of 4′′ in the cm and mm continuum as well as in CO line emission (Omont et al. 1996b; Yun et al. 1999), while BRI 13350417 appears unresolved at arcsecond resolution. It has been argued that the double structure of BR 12020725 is caused by gravitational lensing, which might lead to an overestimate of this source’s intrinsic dust and gas masses and star formation rate by an order of magnitude (Omont et al. 1996b). However, the lensing hypothesis is complicated by the fact that the optical QSO is a single source (Hu, McMahon, & Egami 1996). If BRI 13350417 is gravitationally lensed, the multiple images must be separated by less than 1′′.
Tan, Silk, & Blanard (1999) have presented a model of the star formation history of the universe which may explain the faint source counts from the optical through the radio regimes. They hypothesize that star formation occurs in two phases. At high redshift (), very active star formation occurs in merger events leading to the formation of the spheroidal components of galaxies (spiral bulges and ellipticals). At lower redshift (), the stellar disks of galaxies are formed over longer periods at lower star formation rates. The high starbursts are dusty systems and are revealed primarily as constituents of the faint submm, IR, and radio source populations. In contrast, the faint optical source counts are dominated by the lower disk-forming systems. Tan et al. state that the early spheriods may act as “seeds” for disk formation as gas falls in, and that the present-day stellar mass in bulges and halos is comparable to that in disks. Our observations of BRI 13350417 are consistent with this source being a member of the high starburst population. These data support the speculation by Omont et al. (1996b) that: “…the emergence of quasars at very high redshift is connected with the onset of galaxy formation, possibly with the formation of the cores of elliptical galaxies”.
Overall, the cm and mm continuum observations, as well as the CO line data, argue in favor of a very massive starburst concurrent with the AGN activity in BRI 13350417 at . The gas depletion timescale is short, 109 years, in which time a significant fraction of the stars in the host galaxy of the AGN may be formed (Benford et al. 1999). Further observations are required to understand the nature of BRI 13350417, including: (i) high resolution imaging with the VLA of the radio continuum emission to search for multiple imaging due to gravitational lensing on a scale of a few hundred mas, and/or to search for evidence of a radio jet, (ii) VLA imaging at 100 mas resolution of the CO emission to resolve the optically thick line emitting regions, and (iii) observations of higher order CO transitions to constrain the temperature of the molecular gas.
We would like to thank F. Owen, D. Downes, M. Walmsley, J. Lehar, and the referee, A. Omont, for useful comments and discussions. We would also like to thank J. van Gorkom for her cooperation in dynamic scheduling of the VLA. C.C. acknowledges support from the Alexander von Humboldt Society. This research made use of the NASA/IPAC Extragalactic Data Base (NED) which is operated by the Jet propulsion Lab, Caltech, under contract with NASA.
References
- (1)
- (2) Barthel, P.D., & Miley, G.K. 1988, Nature, 333, 319
- (3)
- (4) Benford, D. J., Cox, P., Omont, A., Phillips, T. G., & McMahon, R. G. 1999, preprint (astro-ph/9904277)
- (5)
- (6) Blain, A.W., & Longair, M.S. 1993, MNRAS, 264, 509
- (7)
- (8) Bryant, P.M., & Scoville, N.Z. 1996, ApJ, 457, 678
- (9)
- (10) Carilli, C. L. & Yun, M. S. 1999, ApJ, 513, L13
- (11)
- (12) Carilli, C. L. & Holdaway, M. A. 1999, Radio Science, in press
- (13)
- (14) Combes, F., Maoli, R., & Omont, A. 1999, A&A, 345, 369
- (15)
- (16) Downes, D., & Solomon, P.M. 1998, ApJ, 507, 615
- (17)
- (18) Downes, D., Neri, R., Wiklind, T., Wilner, D., & Shaver, P.A. 1999, ApJ (letters), 513, 1
- (19)
- (20) Condon, J. J., Huang, Z.-P., Yin, Q. F., & Thuan, T. X. 1991, ApJ 378, 65
- (21)
- (22) Guilloteau, S., Omont,A., McMahon, R.G., Cox,P., & Petitjean,P. 1997, A&A, 328, L1
- (23)
- (24) Guilloteau, S., Omont, A., McMahon, R. G., Cox, P., & Petitjean, P. 1999, A&A, submitted
- (25)
- (26) Güsten, R., Serabyn, E., Kasemann, C., Schinckel, A., Schneider, G., Schulz, A., & Young, K. 1993, ApJ, 402, 537
- (27)
- (28) Hu, E., McMahon, R.G., & Egami, E. 1996, ApJ, 459, L53
- (29)
- (30) Irwin, M., McMahon, R. G., & Hazard, C. 1991, in The Space Distribution of Quasars, ed. D. Crampton, (San Francisco: PASP), p. 117
- (31)
- (32) Kawabe, R., Kohno, K., Ohta, K., & Carilli, C. 1999, in Highly Redshifted Radio Lines, eds. C. L. Carilli, S. J. E. Radford, K. M. Menten, & G. I. Langston, (San Francisco: PASP), p. 48
- (33)
- (34) McMahon, R. G. 1991, in The Space Distribution of Quasars, ed. D. Crampton, (San Francisco: PASP), p. 129
- (35)
- (36) Ohta, K., Yamada, T., Nakanishi, K., Kohno, K., Akiyama, M., & Kawabe, R. 1996, Nature, 382, 426
- (37)
- (38) Omont, A., McMahon, R. G., Cox, P., Kreysa, E., Bergeron, J., Pajot, F., & Storrie-Lombardi, L.J. 1996a, A&A, 315, 1
- (39)
- (40) Omont, A., Petitjean, P., Guilloteau, S., McMahon, R. G., Solomon, P. M., & Pecontal, E. 1996b, Nature, 382, 428
- (41)
- (42) Peebles, P.J.E. 1999, PASP, 111, 274
- (43)
- (44) Perley, R.A. 1999, in Aperture Synthesis in Radio Astronomy II, eds. G. Taylor, C. Carilli, & R. Perley, (San Francisco: PASP)]
- (45)
- (46) Scoville, N.Z., Yun, M.S., & Bryant, P.M. 1997, ApJ, 484, 702
- (47)
- (48) Solomon, P.M., Downes, D., & Radford, S.J.E. 1992, ApJ, 398, L29
- (49)
- (50) Solomon, P.M., Downes, D., Radford, S.J.E., & Barrett, J.W. 1997, ApJ, 478, 144
- (51)
- (52) Solomon, P.M., Radford, S.J.E., & Downes, D. 1992, Nature, 356, 318
- (53)
- (54) Storrie-Lombardi, L.J., McMahon, R.G., Irwin, M.J., & Hazard, C. 1996, ApJ, 468, 121
- (55)
- (56) Tacconi, L.J. et al. 1999, ApJ, in press (astro-ph/9905031)
- (57)
- (58) Tan, J.C., Silk, J., & Blanard, C. 1999, ApJ, in press
- (59)
- (60) Turner, M.S. 1999, PASP, 111, 264
- (61)
- (62) Yun, M.S., Carilli, C.L., Kawabe, R., Tutui, Y., Kohno, K. & Ohta, K. 1999, ApJ, submitted
- (63)