Orbital Modulation of X-rays from Cygnus X-1 in its Hard and Soft States
Abstract
We have analyzed over years of /ASM data for Cygnus X-1. We have detected the -day orbital period in Lomb-Scargle periodograms of both light curves and hardness ratios when Cyg X-1 was in the hard state. This detection was made with improved sensitivity and temporal coverage compared with previous detections by other X-ray missions. The folded light curves and hardness ratios show a broad intensity dip accompanied by spectral hardening centered on superior conjunction of the X-ray source. The dip has a duration of about 27% of the orbital period and depth ranging from % to % of the non-dip intensities in three energy bands. Variability on time scales of hours is often evident within the broad dip in the unfolded data. In contrast, no feature at the orbital period is evident in the periodograms or folded light curves for the soft state. Absorption of X-rays by a stellar wind from the companion star can reproduce the observed X-ray orbital modulations in the hard state. To explain the low orbital modulation in the soft-state data, a reduction of the wind density during the soft state would be required. As an alternative, a partial covering scenario is described which could also account for the lack of the orbital modulation in the soft state.
1 Introduction
Cyg X-1 has been identified as a binary system of -day orbital period which contains an O Iab supergiant and a compact object that is believed to be a black hole (Bolton (1972); Webster & Murdin (1972)). The observed intense X-ray flux from this system is thought to be produced close to the black hole in an accretion disk which emits soft X-ray photons and in a hot corona (– K) that inverse-Compton scatters low energy photons to higher energies (e.g., Liang & Nolan (1984); Tanaka & Lewin (1995) and references therein). The accretion flow from the supergiant is probably intermediate between Roche-lobe overflow and stellar wind accretion (e.g., Gies & Bolton 1986b ).
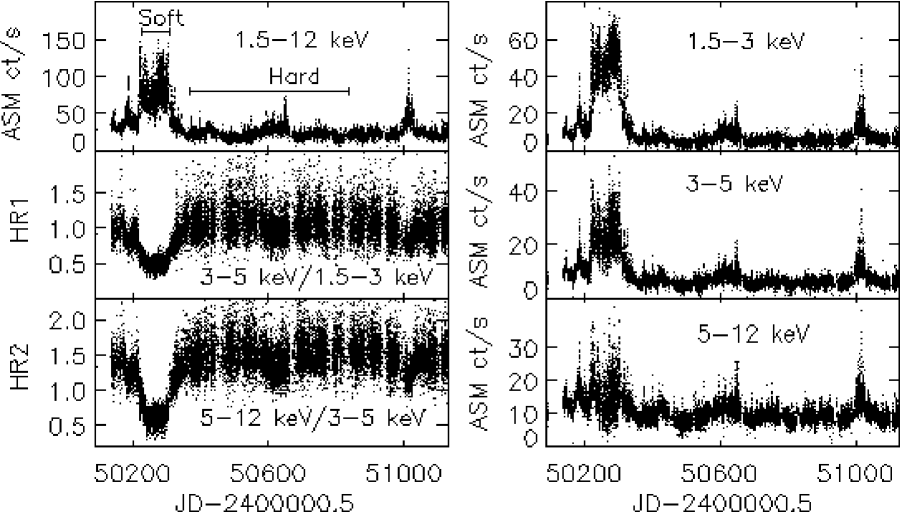
Two physically distinct states of Cyg X-1 have been observed: the hard state and the soft state. Most of the time, Cyg X-1 stays in the hard state where its – keV luminosity is low and the energy spectrum is hard. Every few years, Cyg X-1 undergoes a transition to the soft state and stays there for weeks to months before returning to the hard state. During the transition to the soft state, the – keV luminosity increases, often by a factor of more than , and the energy spectrum becomes softer (see reviews by Oda (1977); Liang & Nolan (1984) and references therein; also the /ASM light curves in Fig. 1). Interestingly, the total – keV luminosity remained unchanged to within during the hard-to-soft and soft-to-hard state transitions (Zhang et al. (1997)).
The hard state of Cyg X-1 frequently exhibits short, irregular, absorption-like X-ray intensity dips. These dips usually last seconds to hours and seem to occur preferentially near superior conjunction of the X-ray source. They are often thought to be due to absorption in inhomogeneities in the stellar wind from the companion (e.g., Pravdo et al. (1980); Remillard & Canizares (1984); Kitamoto et al. (1984); Bałucińska & Hasinger (1991); Ebisawa et al. (1996)).
The most probable mass for the black hole is about (Herrero et al. (1995); see also Gies & Bolton 1986a for a slightly higher value). One of the larger uncertainties in the determination of the mass comes through the inclination angle , which remains relatively poorly constrained. The various existing techniques to determine , such as those using the variation of the polarization of the optical light, allow it to be in a wide range of – (e.g., Long, Chanan, & Novick (1980)).
The -day orbital period of Cyg X-1 may be detected via several effects. In the optical band, this period manifests itself as radial velocity variations of the absorption/emission lines (Bolton (1975)) and as ellipsoidal light variation (e.g., Walker (1972)). Phase-dependent variations of the equivalent width of the UV lines of Si IV and C IV have been reported by Treves (1980) and attributed to the orbital motion of the X-ray heated region of the stellar wind. Orbital modulations in the near-infrared and band (Leahy & Ananth (1992)) and in radio at GHz (Pooley, Fender, & Brocksopp (1999)) have also been reported. The causes of these modulations are still speculative.
X-ray orbital modulations in the hard-state data of several investigations show an intensity minimum around superior conjunction in the folded light curves. A -day record of Ariel 5 ASM observations in the – keV band yielded an intensity minimum near superior conjunction even though the day period was not detected at a convincing level of statistical significance in a power density spectrum (Holt et al. (1979)). The existence of a broad dip near superior conjunction was confirmed in days of hard state data from the WATCH/Eureca wide field X-ray monitor (Priedhorsky, Brandt, & Lund (1995)). In the –, – and – keV bands, the dips had depths of , , and respectively. The width (FWHM) is of the period in the – keV band. It is unclear how this type of broad dip is related to the shorter irregular dips discussed previously. A peak-to-peak orbital modulation was also found in 3 years of BATSE data in the – keV band (Robinson et al. (1996)).
In this paper, we present a detailed study of the orbital modulation in the – keV energy band using data from the All-Sky Monitor (ASM) on board the Rossi X-ray Timing Explorer (). The advantages of /ASM observations lie in its relatively good sensitivity ( mCrab in a day), frequent data sampling (– times a day) and long baseline ( years). Moreover, the fact that a long ( days) soft state was observed by the ASM in makes it possible to quantitatively compare the two states. An earlier report of the detection of the day period in the /ASM data was made by Zhang et al. (1996).
Our analysis focuses on the X-ray orbital modulation with the goal of investigating the cause of the broad intensity dip, an understanding of which may ultimately help constrain the system parameters. Specifically, we present (1) the results of a periodicity search; (2) the folded and individual orbital light curves; (3) a comparison of the orbital modulations in the soft and hard states; and (4) the results from a simulation of the orbital modulation caused by a partially ionized stellar wind from the companion.
2 Data
The All-Sky Monitor on board (Bradt, Rothschild, & Swank (1993)) has been monitoring the sky routinely since March. The ASM consists of three Scanning Shadow Cameras, each consisting of a coded mask and a position-sensitive proportional counter. A linear least squares fit to the shadow patterns from a -s observation by one of the three cameras of the ASM yields the source intensity in three energy bands (–, –, and – keV). The intensity is usually given in units of the count rate expected if the source were at the center of the field of view in one of the cameras; in these units, the – keV Crab nebula flux is about ASM ct/s. The estimated errors of the source intensities include the uncertainties due to counting statistics and a systematic error taken to be of the intensities. A source is typically observed – times a day. In the present analysis, we have used source intensities of 90-s time resolution derived at MIT by the RXTE/ASM team. A detailed description of the ASM and the light curves can be found in Levine et al. (1996) and Levine (1998).
The X-ray light curves and hardness ratios from the ASM observations of Cyg X-1 ( March – September) are shown in Fig. 1. During May ( MJD , where MJD=JD-2400000.5 ), a transition into the soft state is evident (Cui (1996)). After about days in the soft state, Cyg X-1 returned to the hard state and remained there through 1998 September. The hard-state light curve shows long-term variations on time scale of – days and rapid flares that seem to occur every to days (see also Cui, Chen, & Zhang (1998)). For the analyses discussed below, the hard-state data are taken from a -day interval (MJD –) and the soft-state data from a -day interval (MJD –).
In this paper, the hardness ratio HR is defined as the ratio of the ASM count rates in the – keV band to that of the – keV band, and the hardness ratio HR as the ratio of the count rates of the – keV band to that of the – keV band.
3 Analysis and Results
Periodicities in both the hard state and the soft state have been sought by means of Lomb-Scargle periodograms of both the light curves and the derived hardness ratios. The Lomb-Scargle periodogram (Lomb (1976); Scargle (1982); Press et al. (1992)) was used to estimate the power density spectrum instead of the classic periodogram based on the Fast Fourier Transform (FFT) since the ASM data points are unevenly spaced in time. In the Lomb-Scargle periodogram, a maximum in the power occurs at the frequency which gives the least squares fit of a sinusoidal wave to the data. We oversampled the spectrum so that the frequencies are more closely spaced than , where is the total duration of the data used. The goal is to ensure the detection of a peak for a signal that is of border-line statistical significance and to best locate the peak. The frequency range we have searched is up to (or beyond) , where is the number of data points.
3.1 Hard State
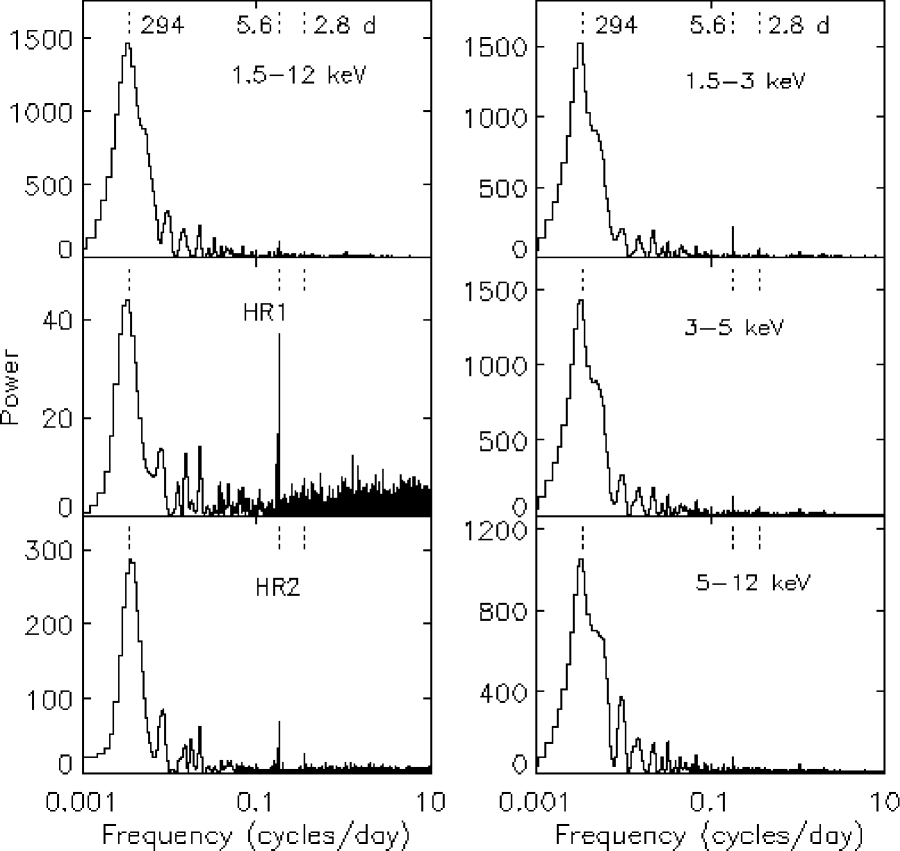
The Lomb-Scargle periodograms for the hard state are shown in Fig. 2. There is a distinct peak in the periodogram at a frequency that is consistent with Cyg X-1’s optically determined orbital period, i.e., days (Brocksopp et al. (1999); see also Gies & Bolton (1982) and Lasala et al. (1998)). The peak is much more apparent in the periodograms of the hardness ratios than in those of the light curves. Some of the periodograms also have a significant peak at the frequency of d-1, the first harmonic of the orbital period. There is a large peak at a very low frequency corresponding to a period of about days, which is consistent with the reported day period by Priedhorsky, Terrell, & Holt (1983) and by Kemp et al. (1983). However, the temporal span of the ASM data is too short to confirm this period; it could simply be “red noise”. In fact, this peak is no longer distinct in the periodograms calculated using an extended set of data, i.e., 860 days of hard state data. No other periodicities stand out at frequencies less than cycles per day except for the “peaks” at cycles per day which appear to be red noise (the spectrum for frequencies larger than cycles per day is not shown).
The data were folded modulo the orbital period of days to study the phase-dependent variations (Fig. 3). We used the orbital ephemeris reported recently by Brocksopp et al. (1999). The most distinctive feature in the folded light curves is the broad intensity dip. It is seen in all energy bands and is centered on the superior conjunction of the X-ray source (phase zero). The dip profiles are quite symmetric about superior conjunction. The fractional amplitude of the modulation in the light curves is larger in the lower energy band, which manifests itself as gradual spectral hardening during the dip. The fractional amplitudes of the dip relative to the average non-dip intensities (phase -) are % for – keV, % for – keV, and % for – keV. The widths (FWHM) are all about 27% of the orbital period. The corresponding fractional changes of HR and HR are about % and % respectively with similar widths. Taking into account the variation of the non-dip intensity in the folded light curves, we estimated the uncertainty in the fractional orbital modulations to be less than .
Complex structures are evident within the dip for at least of the orbital cycles observed by the ASM. The profile of the structure also seems to vary from cycle to cycle. As the ASM data are unevenly sampled in time, we have found only a few orbital cycles that are relatively uniformly sampled. We show in Fig. 4 one such cycle of the hard state observations with time bins of day in the energy band – keV. There is a broad intensity dip at superior conjunction with substantial substructure. In particular, there are two narrow dips near superior conjunction: within a few hours, the intensities dropped by a factor of , and the hardness ratios (HR1) increased by a factor of . This indicates that the dips were much less pronounced at higher energies as might be expected from an absorption process. These smaller dip-like structures are similar to those reported from previous missions. It is possible that the broad dip may be, partially or wholly, due to the superposition of smaller dips. We do not explore this possibility further because the study of such small dips (at time scale of seconds to hours) requires more frequent sampling around superior conjunction than is provided by the ASM.
3.2 Soft State
In contrast with the hard state, Lomb-Scargle periodograms of the soft-state data show no large power at the orbital period compared with the neighboring powers (Fig. 5, left panel). Neither were any other periodicities found in the frequency range of – cycles per day. At low frequencies, i.e. cycles per day, red noise is evident. For a direct comparison of the soft state data with the hard state data, we constructed periodograms for an -day segment of the hard-state data that has a comparable number of data points (Fig. 5, right panel). The day orbital period is clearly detected in the hard state periodogram but is not obvious in the soft state.
In comparing periodograms, we use the normalized variance, i.e., the observed total variance of the count rate divided by the average rate. For a sinusoidal modulation superposed on random noise, the expected height of a peak in the periodogram is then proportional to the product of the number of data points and square of the fractional modulation divided by the normalized variance (see equation 21 in Horne & Baliunas 1986). For the – keV band soft state data, the normalized variance is that of the hard-state data. Thus, for comparable fractional orbital modulations (assumed to be nearly sinusoidal), we expect the signal power of the soft state to be times that of the hard state, or (Fig. 5). The absence of a peak with at the orbital frequency in the soft state data thus clearly excludes the presence of comparable fractional orbital modulations in the – keV light curves of the two states. The folded orbital light curves and hardness ratios for the soft state (Fig. 7) also fail to reveal any significant broad dip or spectral hardening near superior conjunction.
A quantitative comparison of the fractional rms amplitude of the X-ray orbital modulation of the two states was estimated from the classic periodogram (power density spectrum estimated using FFT) of the same data used above. We have binned the data and filled data gaps with the average rate in order to apply the FFT. It is well known that the rms variation of the source signal in the data can be estimated using the FFT power spectrum assuming that the signal power can be properly separated out from the total power spectrum (cf., Lewin, van Paradijs, & van der Klis (1988); van der Klis (1989)). It is therefore relevant to study the distribution of the noise power in the periodogram. In the analysis below, only the powers at frequencies cycles per day were considered because the noise power spectrum is relatively flat in this region. The powers were first divided by the local mean which was obtained from a linear fit to the power as a function of frequency. The scaled noise powers of both the soft and hard state data were found to be consistent with a distribution with degrees of freedom. We then assumed that modulation at the orbital period would yield peaks with the same widths in the power density spectrum from both states. On this basis, we derived the fractional rms amplitude of the orbital modulation for the hard state and an upper limit for the soft state for each ASM energy band at more than confidence (cf., Lewin, van Paradijs, & van der Klis (1988); van der Klis (1989)). This procedure was repeated for different time-bin sizes (, , and days) to check for consistency of the results. We found that in the – keV band, the fractional rms amplitude of the orbital modulation for the soft state is at most of that for the hard state. The – and – keV bands yield higher percentages.
4 Models
The broad dip in the folded light curves cannot be attributed to a partial eclipse by the companion. The companion is a supergiant with a size more than times larger than the X-ray emitting region, so an eclipse of duration nearly of the orbital period would have to be total. Neither can the dip be caused by absorption by neutral material with solar elemental abundances since the observed reduction in flux in the – keV band would then be accompanied by a flux decrease in the – keV band of more than as opposed to the observed .
We have modeled the broad dip assuming that it is produced by absorption and scattering of the X-rays by a smooth isotropic stellar wind from the companion star. The wind is partially ionized by the X-ray irradiation. The X-ray modulation is then caused by changes in the optical depth along the line of sight to the black hole as a function of orbital phase. For simplicity, we did not consider possible complex structures in the wind, e.g., the tidal streams which could account for the strong X-ray attenuation at late orbital phases () in some other wind accreting systems (e.g., Blondin, Stevens, & Kallman (1991)). In our calculation, we neglected the influence of the UV emission from the optical star upon the ionization state of the wind as we expect it to have little effect on the X-ray opacity in the ASM energy band.
The radiatively driven wind model of Castor, Abbott, & Klein (1975) was adopted in our calculation. In this model, the velocity of the wind can be described by a simple power law for :
| (1) |
where is the terminal velocity of the wind, the distance from the center of the star, the radius of the star, and a fixed index. A spherically symmetric wind is assumed for simplicity. We therefore approximate the wind density profile as:
| (2) |
where is the number density of the wind, and is a wind density parameter, expressed in terms of the proton number density. The mass loss rate by the wind thus is , where is the atomic hydrogen mass.
Simulated ASM light curves in the energy band – were produced by integrating along the line of sight from the black hole for a given orbital phase :
| (3) |
where is the intrinsic X-ray energy spectrum, is the ASM energy-dependent detection efficiency, is the distance from the X-ray source, is the photoelectric absorption cross-section per hydrogen atom for the partially ionized gas as a function of the energy and the ionization parameter where is the effective source luminosity between eV and keV, is the absorption cross section per hydrogen atom for neutral gas, and is the interstellar hydrogen column density.
The values for the parameters in equations (2) and (3) were determined or adopted as follows. For the wind model, we took , cm, and km s-1 from Gies & Bolton (1986b) who fitted equations (1) and (2) to the numerical results from Friend & Castor (1982) for the radiative-driven wind profile of Cyg X-1. These values are for binary separation , corresponding to a Roche lobe fill-out factor of the companion, and for a wind profile that resembles a smooth wind from a single O I supergiant. The shape of was chosen to be similar to that seen in the ASCA observations of Cyg X-1 in the hard state, i.e. with blackbody and broken power law components (Ebisawa et al. (1996)). The binary inclination angle was taken as from the most probable value derived by Gies & Bolton (1986a). The interstellar hydrogen column density was taken as cm-2, slightly less than the values used in Ebisawa et al. (1996), for a better fit to the ASM data . The values for are from Morrison & McCammon (1983), and finally, for the wind, solar elemental abundances were assumed (as listed in Morrison & McCammon (1983))( Table 1).
The cross-section depends highly on the ionization state of the wind. Under the assumption of a steady state, the ionization state of an optically thin gas illuminated by an X-ray source can be uniquely parameterized by the ionization parameter for a given X-ray source spectrum (Tarter, Tucker, & Salpeter (1969)). For each ionization state of the optically thin gas, the local effective X-ray opacity can be uniquely determined from atomic physics calculations. The program XSTAR (v. 1.46, see Kallman & McCray (1982) for theoretical basis) was used to obtain an opacity table which contains for a wide range of ionization parameters and energies. For any particular ionization parameter value, can be constructed by interpolation. In our model, the Thomson scattering cross section was added to the cross section derived with the use of XSTAR. The wind absorption factor in equation (3) was integrated over the range cm cm. For cm the wind is highly ionized while for cm the density of the wind becomes very small; thus the absorption of the X-rays by the wind is negligible in both cases.
Our procedure was to find the wind density parameter which produced light curves with fractional orbital modulations matching those obtained from the hard state ASM data. The spectral parameters from Ebisawa et al. (1996) were also adjusted slightly to match the intensity levels in the three ASM energy bands. The best-fit values were obtained by minimizing the values of each model light curve relative to the data. The range of acceptable fit, with confidence level, is then estimated based on the increase of from the minimum (cf., Lampton, Margon, & Bowyer (1976)). Note the uncertainties in our results do not include the uncertain effects of the assumptions and binary parameters adopted for the calculation. The expected variance of the data in calculating was taken to be the variance of the data between phase 0.3–0.7 to account for the possible intrinsic uncertainty associated with the data.
The best-fit model light curves of the hard state for our choice of are plotted as the solid lines in Fig. 3 to compare with the observational data. Clearly this simple wind model can account for the observed X-ray orbital modulation in the hard state very well. The adjusted spectral parameters are listed in Table . For a distance of kpc, the derived intrinsic – keV X-ray luminosity from this model is ergs s-1, which is consistent with the previously reported value (e.g., Zhang et al. (1997)). The wind density parameter is estimated to be cm-3, indicating a total mass loss rate of per year. This value of is a factor of larger than that determined by Gies & Bolton (1986b). The hydrogen (neutral+ionized) column density is about cm-2. The ionization parameter varies from to along the integration path.
We have studied the effect of the inclination angle upon the quality of the fit of the model light curves to the data. The minimum of the value was found at roughly for data of all three energy bands. The acceptable range of the inclination angle was found to be , determined primarily by the data in the 1.5–3 keV band. This constraint is mainly due to the fact that the width of the dip of a fixed fractional amplitude in our model decreases if we increase the inclination angle (Fig. 6). The best-fit ranges from cm-3 for up to cm-3 for . Note that decreases if we choose a larger inclination angle . The results are relatively insensitive to the ASM efficiency and the intrinsic X-ray spectral shape.
In the BATSE band, the X-ray opacity is entirely due to electron scattering. We found that in all our acceptable fits, attenuation caused by electron scattering would modulate the apparent intensity by – peak-to-peak, which is in good agreement with the data (Robinson et al. (1996)).
We repeated the same procedure for the soft state for , assuming the same wind density profile (with cm-3) and using the energy spectrum adjusted slightly from that in Cui et al. (1997a), again to match the count rates in the three energy bands. The results are plotted as solid lines in Fig. 7. The model produces light curves of much smaller orbital modulations than in the hard state because the wind is more ionized due to a much larger flux of soft X-ray photons in the soft state. In the 1.5—3 keV band, the amplitude of the modulation () in the model light curve is not consistent with the upper limit () determined in section 3.2. Better fits to the data can be found with smaller values of . For cm-3, the fractional modulation of the model light curve is in the – keV band for the soft state, which is consistent with the upper limit. A wind model with a non-variable wind density therefore cannot explain the data in the hard and soft states simultaneously in case of . However, the non-detection of the orbital modulation in the soft state can be explained if the wind density is reduced by a factor of about 2 relative to the hard state.
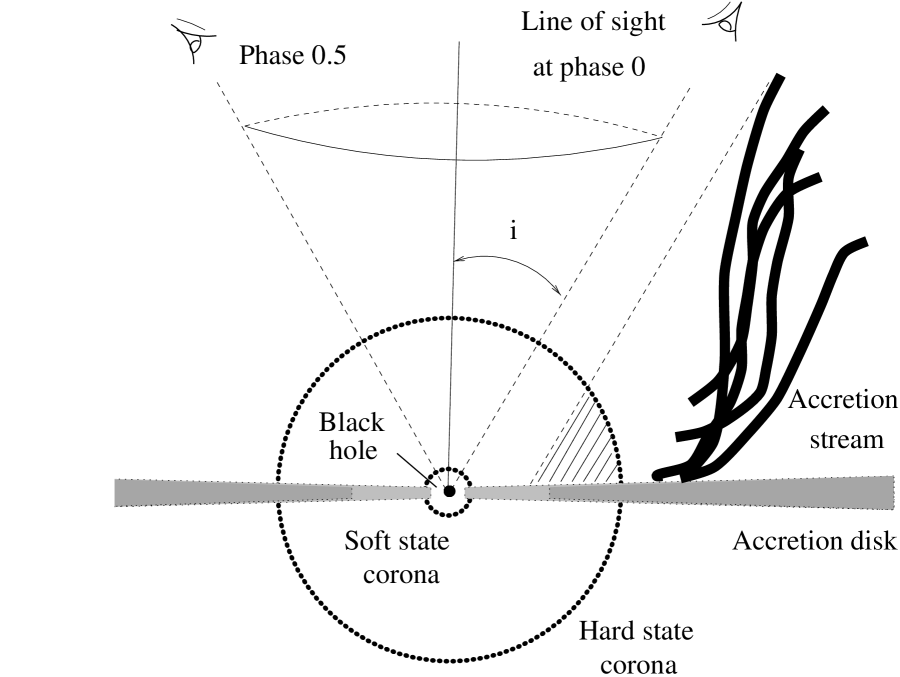
Alternatively, the X-ray orbital modulation observed in the hard state may be caused by partial covering of a central X-ray emitting region by the accretion stream. The wind density in this model is assumed to be much less than that required in the model discussed above, therefore it does not contribute significant X-ray opacity. Hard X-rays are generally thought to be produced by upscattering of low energy photons by electrons in a hot corona (e.g., Liang & Nolan (1984)). Observations seem to favor the geometry of a spherical corona centered on the black hole plus a standard thin disk (Fig. 8) (Dove et al. 1997, (1998); Gierliński et al. (1997); Poutanen, Krolik, & Ryde (1997)). Recent studies indicate that the size of the corona in the hard state could be as large as cm (Hua, Kazanas, & Cui (1998)) and that it may shrink by more than a factor of as the soft state is approached (Cui et al. 1997b ; Esin et al. (1998)). For Cyg X-1 in both states, the X-ray emission observed above keV is primarily from the corona. The accretion stream may have a scale height above the disk such that, viewed along the line of sight near superior conjunction of the X-ray source, it partially obscures the outer region of the large corona in the hard state but does not do so in the soft state because the corona is much smaller (Fig. 8). This constrains the distance of the absorber to be a few coronal radii away from the black hole. A covering factor around is sufficient to explain the observed depth of the dip in the hard state with a cold absorber of line-of-sight hydrogen column density of (–) cm-2. If we take the degree of ionization into account, the hydrogen column density could be much higher, which may account for the observed modulation in the BATSE band.
5 Summary
Our analysis of RXTE/ASM observations of Cyg X-1 leads to the following conclusions: There is a broad smooth dip in the folded orbital light curves of Cyg X-1 in the hard state. The dip is symmetric about superior conjunction of the X-ray source. The depth of the dip relative to the non-dip intensity is around in the – keV band, in the – keV band, and in the – keV band. The FWHM of the dip is of the orbital period in the energy range – keV. Individual light curves show complex structures around superior conjunction in the form of dips of shorter duration. Finally, no evidence is found for orbital modulation during the soft state of Cyg X-1.
We examined the possibilities that the broad dip is produced by the absorption of the X-rays by a stellar wind from the companion star. This model reproduces the observed light curves of the hard state well for inclination angles and can also explain the soft-state data if there was a reduction in the stellar wind density for the duration of the soft state. Alternatively, the observed X-ray modulation in the hard state may be mostly due to the partial obscuration of a central hard X-ray emitting region by the accretion stream. The lack of the observed orbital modulation in the soft state can be attributed to a significant shrinkage in the size of the X-ray emitting region such that it is no longer obscured by the accretion stream. This model requires the accretion stream to have specific geometric properties, such as its scale height, width, and orientation. In both models, the required hydrogen column density can reproduce orbital modulation due to electron scattering as observed in the BATSE data (Robinson et al. (1996)).
References
- Bałucińska & Hasinger (1991) Bałucińska, M. & Hasinger, G. 1991, A&A, 241, 439
- Blondin, Stevens, & Kallman (1991) Blondin, J. M., Stevens, I. R., & Kallman, T. R. 1991, ApJ, 371, 684
- Bolton (1972) Bolton, C. T. 1972, Nature, 235, 271
- Bolton (1975) Bolton, C. T. 1975, ApJ, 200, 269
- Bradt, Rothschild, & Swank (1993) Bradt, H. V., Rothschild, R. E., & Swank, J. H. 1993, A&A, 97, 355
- Brocksopp et al. (1999) Brocksopp, C., Tarasov, A. E., Lyuty, V. M., & Roche, P. 1999, A&A, 343, 861
- Castor, Abbott, & Klein (1975) Castor, J. I., Abbott, D. C., & Klein, R. I. 1975, ApJ, 195, 157
- Cui (1996) Cui, W. 1996, IAU Circ., 6404
- (9) Cui, W., Heindl, W. A., Rothschild, R. E., Zhang, S. N., Jahoda, K., & Focke, W. 1997a, ApJ, 474, L57
- (10) Cui, W., Zhang, S. N., Focke, W., & Swank, J. H. 1997b, ApJ, 484, 383
- Cui, Chen, & Zhang (1998) Cui, W., Chen, W., & Zhang, S. N. 1998, Proceedings of 1997 Pacific Rim Conference on Stellar Astrophysics, ed. K. L. Chan, K. S. Cheng, & H. P. Singh, ASP Conference Series, vol 138, 75 (astro-ph/9711168)
- Dove et al. 1997, (1998) Dove, J. B., Wilms, J. , Maisack, M., & Begelman, M. C. 1997, ApJ, 487, 759
- Dove et al. (1998) Dove, J. B., Wilms, J. , Nowak, M. A., Vaughan, B. A., & Begelman, M. C. 1998, MNRAS, 298, 729
- Ebisawa et al. (1996) Ebisawa, K., Ueda, Y., Inoue, H., Tanaka, Y., & White, N. E. 1996, ApJ, 467, 419
- Esin et al. (1998) Esin, A. A., Narayan, R., Cui, W., Grove, J. E., & Zhang, S.-N. 1998, ApJ, 505, 854
- Friend & Castor (1982) Friend, D. B. & Castor, J. I. 1982, ApJ, 261, 293
- Gierliński et al. (1997) Gierliński, M. , Zdziarski, A. A., Done, C. , Johnson, W. N. , Ebisawa, K. , Ueda, Y. , Haardt, F., & Phlips, B. F. 1997, MNRAS, 288, 958
- Gies & Bolton (1982) Gies, D. R. & Bolton, C. T. 1982, ApJ, 260, 240
- (19) Gies, D. R. & Bolton, C. D. 1986a, ApJ, 304, 371
- (20) Gies, D. R. & Bolton, C. D. 1986b, ApJ, 304, 389
- Herrero et al. (1995) Herrero, A., Kudritzki, R.P., Gabler, R., Vilchez, J. M., & Gabler, A. 1995, A&A, 297, 556
- Holt et al. (1979) Holt, S. S., Kaluzienski, L. J., Boldt, E. A., & Serlemitsos, P. J. 1979, ApJ, 233, 344
- Horne & Baliunas (1986) Horne, J. H. & Baliunas, S. L. 1986, ApJ, 302, 757
- Hua, Kazanas, & Cui (1998) Hua, X.-M., Kazanas, D., & Cui, W. 1998, ApJ, accepted
- Kallman & McCray (1982) Kallman, T. R. & McCray, R. 1982, ApJS, 50, 263
- Kemp et al. (1983) Kemp, J. C., et al. 1983, ApJ, 271, L65
- Kitamoto et al. (1984) Kitamoto, S., Miyamoto, S., Tanaka, Y., Ohashi, T., Kondo, Y., Tawara, Y., & Nakagawa, M. 1984, PASJ, 36, 731
- Lampton, Margon, & Bowyer (1976) Lampton, M., Margon, B., & Bowyer, S. 1976, ApJ, 208, 177
- Lasala et al. (1998) Lasala, J., Charles, P. A., Smith, R. A. D., Bałucińska-Church, M., & Church, M. J. 1998, MNRAS, 301, 285
- Leahy & Ananth (1992) Leahy, D. A. & Ananth, A. G. 1992, MNRAS, 256, 39
- Levine et al. (1996) Levine, A. M., Bradt, H., Cui, W., Jernigan, J. G., Morgan, E. H., Remillard, R., Shirey, R. E., & Smith, D. A. 1996, ApJ, 469, L33
- Levine (1998) Levine, A. M. 1998, in Nuclear Physics B (Proc. Suppl.), 69/1-3, 196
- Lewin, van Paradijs, & van der Klis (1988) Lewin, W. H. G., van Paradijs, J., & van der Klis, M. 1988, Space Science Reviews, 46, 273
- Liang & Nolan (1984) Liang, E. P. & Nolan, P. L., 1984, Space Science Reviews, 38, 353
- Lomb (1976) Lomb, N. R. 1976, Ap&SS, 39, 447
- Long, Chanan, & Novick (1980) Long, K. S., Chanan, G. A., & Novick, R. 1980, ApJ, 238, 710
- Morrison & McCammon (1983) Morrison, R. & McCammon, D. 1983, ApJ, 270, 119
- Oda (1977) Oda, M. 1977, Space Science Reviews, 20, 757
- Pooley, Fender, & Brocksopp (1999) Pooley, G. G., Fender, R. P., & Brocksopp, C. 1999, MNRAS, 302, L1
- Poutanen, Krolik, & Ryde (1997) Poutanen, J. , Krolik, J. H., & Ryde, F. 1997, MNRAS, 292, L21
- Pravdo et al. (1980) Pravdo, S. H., White, N. E., Becker, R. H., Kondo, Y., Boldt, E. A., Holt, S. S., Serlemitsos, P. J., & McCluskey, G. E. 1980, ApJ, 237, L71
- Press et al. (1992) Press, W. H., Teukolsky, S. A., Vetterling, W. T., & Flannery, B. P. 1992, Numerical Recipes, 2nd ed. (Cambridge: Cambridge University Press), 569
- Priedhorsky, Terrell, & Holt (1983) Priedhorsky, W. C., Terrell, J., & Holt, S. S. 1983, ApJ, 270, 233
- Priedhorsky, Brandt, & Lund (1995) Priedhorsky, W. C., Brandt, S., Lund, N. 1995, A&A, 300, 415
- Remillard & Canizares (1984) Remillard, R. A., & Canizares, C. R. 1984, ApJ, 278, 761
- Robinson et al. (1996) Robinson, C. R. et al. 1996, in Proceedings of 2nd INTEGRAL Workshop “The Transparent Universe”, ed. C. Winkler et al. (ESA SP-382), 249
- Scargle (1982) Scargle, J. D. 1982, ApJ, 263, 835
- Tarter, Tucker, & Salpeter (1969) Tarter, C. B., Tucker, W., & Salpeter, E. E. 1969, ApJ, 156, 943
- Tanaka & Lewin (1995) Tanaka, Y. & Lewin, W. H. G. 1995, in X-ray Binaries, ed. Lewin, W. H. G.,Van Paradijs, J., & Van den Heuvel, E. P. J. (Cambridge: Cambridge University Press), 126
- Treves (1980) Treves, A., et al. 1980, ApJ, 242, 1114
- van der Klis (1989) van der Klis, M. 1989, in Timing Neutron Stars, ed. Ögelman, H. & van der Heuvel, E. P. J. (Dordrecht: Kluwer Academic Publishers), 27
- Walker (1972) Walker, E. N. 1972, MNRAS, 160, 9
- Webster & Murdin (1972) Webster, B. L., & Murdin, P. 1972, Nature, 235, 37
- Zhang, Robinson, & Cui (1996) Zhang, S. N., Robinson, C. R., & Cui, W. 1996, IAU Circ., 6510
- Zhang et al. (1997) Zhang, S. N., Cui, W., Harmon, B. A., Paciesas, W. S., Remillard, R. E., & Van Paradijs, J. 1997, ApJ, 477, L95


| Blackbody aa : normalization in units of 1036 ergs s-1 at d=2.5 kpc, : temperature | Broken Power Law bb : break energy, : photon index below , : photon index above ,
: normalization in units of photon s-1 cm-2 keV-1 at 1 keV for |
Absorption cc Interstellar hydrogen column density in units of 1021 cm-2 | Luminositydd Calculated in the 13.6 eV–13.6 keV band in units of ergs s-1 | ||||
| (keV) | (keV) | ||||||
| 7.5 | 0.16 | 1.84 | 4 | 1.515 | 2.63 | 5.0 | 3.4 |