Hybrid Neural Networks for Frequency Estimation of Unevenly Sampled Data
Abstract
In this paper we present a hybrid system composed by a neural network based
estimator system and genetic algorithms. It uses an unsupervised Hebbian
nonlinear neural algorithm to extract the principal components which, in
turn, are used by the MUSIC frequency estimator algorithm to extract the
frequencies.We generalize this method to avoid an interpolation
preprocessing step and to improve the performance by using a new stop
criterion to avoid overfitting. Furthermore genetic algorithms are used to
optimize the neural net weight initialization.
The experimental results are obtained comparing our methodology with the
others known in literature on a Cepheid star light curve.
1. Introduction
Periodicity analysis of unevenly collected data is a relevant issue in
several scientific fields. Classical spectral analysis methods are
unsatisfactory to solve the problem. In this paper we present a neural
network based estimator system which performs well the frequency extraction
in unevenly sampled signals. It uses an unsupervised Hebbian nonlinear
neural algorithm to extract the principal components of the signal
auto-correlation matrix, which, in turn, are used by the MUSIC frequency
estimator algorithm to extract the frequencies [6], [18]. We generalize this method to avoid an interpolation
preprocessing step, which generally adds high noise to the signal, and
improve the system performance by using a new stop criterion to avoid
overfitting problems. Furthermore, genetic algorithms are used to optimize
the neural net weight initialization, so improving its convergence. The
experimental results are obtained comparing our methodology with the others
known in literature [7],[13],[9],[17],[3],[14].
2. Evenly and unevenly sampled data
In what follows, we assume to be a physical variable measured at
discrete times . can be written as the sum of the signal
and random errors : . The
problem we are dealing with is how to estimate fundamental frequencies which
may be present in the signal [2], [7].
If is measured at uniform time steps (even sampling) [4],[17] there are a lot of tools to effectively solve the problem which
are based on Fourier analysis [7],[13]. These methods,
however, are usually unreliable for unevenly sampled data. For instance, the
typical approach of resampling the data into an evenly sampled sequence,
through interpolation, introduces a strong amplification of the noise which
affects the effectiveness of all Fourier based techniques which are strongly
dependent on the noise level [5].
To solve the problem of unevenly sampled data, we consider two classes of
spectral estimators:
Spectral estimators based on Fourier Transform (Least Squares methods);
Spectral estimators based on the eigenvalues and eigenvectors of the
covariance matrix (Maximum Likelihood methods).
Classic Periodogram [7],[13], Lomb’s Periodogram [9], Scargle’s Periodogram [17], DCDFT [3] are the methods of the first class that we use, while MUSIC
[7],[13] and ESPRIT [15],[14] belong to
the second class.
The methods based on the covariance matrix are more recent and have great
potentiality. Starting by this consideration, we develop a method based on
the MUSIC estimator. It is compared with classical methods to evidence the
perfomance.
3. The Neural Estimator
In the last years several papers dealed with learning in PCA neural nets
[11],[12],[16],[6],[1], [18] finding advantages, problems and difficulties of such
neural networks. In what follows, we shall use a robust hierarchical
learning algorithm because it has been experimentally shown that it is the
best performing in our problem [18].
Our neural estimator (ne) can be summarized as follows:
-
1
Preprocessing: calculate and subtract the average pattern to obtain zero mean process with unity variance.
Interpolate input data if it is the case.
-
2
Train the neural network.
-
3
Calculate the frequencies estimation by using the frequency estimator MUSIC.
MUSIC takes as input the weight matrix columns of the neural network after the learning. The estimated signal frequencies are obtained as the peak locations of the function of the following equation [7]:
where is the th neural network weight vector after learning, and is the vector
where are the
first components of the temporal coordinates of the uneven signal [18].
When is the frequency of the th sinusoidal component, , we
have and . In
practice we have a peak near and in corrispondence of the component
frequency. Estimates are related to the highest peaks
Furthermore, to optimize the performance of the PCA neural networks, we stop
the learning process when
so avoiding overfitting problems. In fact,
leaving the stop condition used in the ne causes to the ne to find
periodicities not present in the signal, while the new condition preserves
it from this problem.
Since sometimes the weight inizialization can lead to local maxima of the
objective function, here we propose to use genetic algorithms for this aim.
We use a real encoding of the net parameters [8] in a string
(chromosome), and then we run the genetic algorithms with a fitness
function, which is the system objective function.
4. Experimental Results
Many experiments on synthetic and real signals were made [18], and in this paper we presents the results obtained with one specifc
real signal, which highlights the main features of our problem.
The signal is related to the Cepheid T Mon [10]. The sequence was
obtained with the photometric technique BVRI and the sampling made from April
1977 to December 1979. The light curve is composed by samples, and a
period of , as shown in figure 1. In this case, the parameters
of the ne are: , , , . The estimated
frequency interval is . The estimated
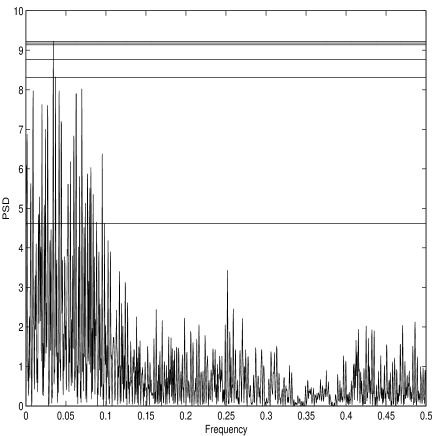
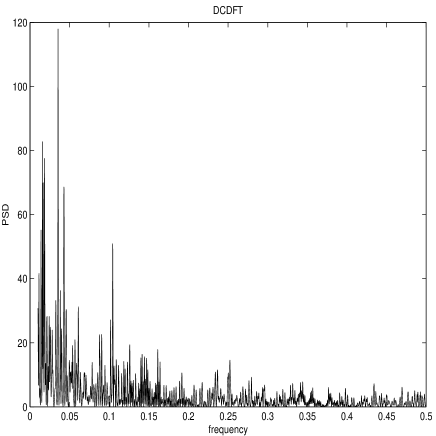
frequency is (1/JD) (see figure 2). By using the genetic algorithms (gne)we improve the system performance reaching the true frequency of (1/JD) (see figure 3). Lomb’s Periodogram finds the correct frequency but it generates several spurious peaks (see figure 4). For what concerns DCDFT, the frequency interval must be changed because it is too much sensitive to very low frequencies (the new interval becomes
)
(see figure 5).
Finally ESPRIT does not work at all finding a frequency of (1/JD) (see figure 6).
In conclusion, only the Lomb’s Periodogram and our gne are in agreement with the right periodicity, but the former showing several spurious peaks.


5. Concluding Remarks
In this paper we have illustrated an improved technique based on PCA neural
networks and MUSIC to estimate the frequency of unevenly sampled data. It
has been shown that it obtains good results on real data (here we used the
Cepheid T Mon light curve) compared with other well known methods. A further
improvement can be obtain by using filters to extract and identify one
frequency at each time when dealing with multi-frequency signals. In [19], we used our system to detect the Milankovic’ frequencies
from a stratigrafic record. In that case the best performance was found when
we extracted one frequency at each time and eliminating it with a FIR
filtering.
Acknowledgements
The paper has been partially supported by IIASS “E. R. Caianiello” and by MURST 40%.
References
- [1] T. Chen,Y. Hua,W.Y. Yan, Global Convergence of Oia’s Subspace Algorithm for Principal Component Extraction, IEEE Transaction on Neural Networks, Vol. 9, No.1, 1998.
- [2] T.J. Deeming, Fourier analysis with unequally-spaced data, Astrophysics and Space Science, vol.36, pag.137-158,1975.
- [3] Ferraz-Mello, Estimation of periods from unequally spaced obsevations. The Astronomical Journal,vol.86, pag. 619,1981
- [4] J.H. Horne, S.L. Balius, A prespriction for period analysis of unevenly sampled time series, The Astrophisical Journal, vol. 302, pag.757-763,1986.
- [5] L.L. Horowitz, IEEE Trans., ASSP-22, 22, 1974.
- [6] J.Kharhunen, J.Joutsensalo, Representation and separation of signals using nonlinear PCA type learning.Neural Networks,vol. 7,pag.113-127,1994.
- [7] S.M. Kay, Modern spectral estimation: Theory and application. Englewood Cliffs: Prentince-Hall,1988.
- [8] C.T. Lin and C.S.G. Lee, Neural Fuzzy Systems: a Neuro-fuzzy Synergism to Intelligent Systems, Upper Saddle River-NJ: Prentice Hall, 1996.
- [9] N.R. Lomb, Least-squares frequency analysis of unequally spaced data. Astrophysics and Space Science,vol.39,pag 447- 462,1976
- [10] T.J. Moffet,T.G. Barnes, Observational Studies of Cepheids,The Astrophysical Journal Supplement Series, vol. 44, pag. 427-450,1980.
- [11] E.Oja, A simplified neuron model as principal component analyzer, Journal of Mathematical Biology, vol.15,pag.267-27,1982.
- [12] E.Oja, H.Ogawa, J.Wangviwattana, Learning in nonlinear constrained Hebbian network. In T. Kohonen et al. (Eds.), Artificial neural networks, North-Holland, Amsterdam, p. 385-390,1991.
- [13] A.V. Oppenhaim, R.W. Schafer, Digital Signal Processing, Prentince-Hall.,1965.
- [14] J.G. Proakis, D.G. Lakis, Digital Signal Processing.,Second edition.
- [15] R. Roy, A. Paulray, T. Kailath, ESPRIT- A Subspace Rotation Approch to Estimation of Parameters of Cisoids in Noise. IEEE Transactions on Acustics, speech, and Signal
- [16] T. D. Sanger, Optimal unsupervised learning in a single-layer linear feedforward network, Neural Network, 2, 459-473, 1989.
- [17] J.D. Scargle, Studies in astronomical time series analysis; statistical aspects of spectral analysis of unevenly spaced data, The Astrophisical Journal vol. 263, pag.835-853, 1982.
- [18] R.T agliaferri, A. Ciaramella, L. Milano, F. Barone, G. Longo, Spectral Analysis of Stellar Light Curves by Means of Neural Networks, Astronomy and Astrophysics Supplement Series, Vol. 137, pag. 1-15, 1999.
- [19] R. Tagliaferri, N. Pelosi, A. Ciaramella, G. Longo, M. Milano, F. Barone, Soft computing methodologies for spectral analysis in cyclostratigraphy, submitted for publication, 1999