Very High Energy Gamma-ray spectral properties of Mkn 501 from CAT Čerenkov telescope observations in 1997
Abstract
The BL Lac object Mkn 501 went into a very high state of activity during 1997, both in VHE -rays and X-rays. We present here results from observations at energies above carried out between March and October 1997 with the CAT Čerenkov imaging Telescope.
The average differential spectrum between and shows significant curvature and is well represented by , with:
,
, and
(negligible systematics).
The TeV spectral energy distribution of Mkn 501 clearly peaks in the range –. Investigation of spectral variations shows a significant hardness-intensity correlation with no measurable effect on the curvature. This can be described as an increase of the peak TeV emission energy with intensity.
Simultaneous and quasi-simultaneous CAT VHE -ray and BeppoSAX hard X-ray detections for the highest recorded flare on April and for lower-activity states of the same period show correlated variability with a higher luminosity in X-rays than in -rays.
The observed spectral energy distribution and the correlated variability between X-rays and -rays, both in amplitude and in hardening of spectra, favour a two-component emission scheme where the low and high energy components are attributed to synchrotron and inverse Compton (IC) radiation, respectively.
Galaxies: active – Galaxies: nuclei – BL Lacertæ objects: individual: Mkn 501 – Gamma-rays: observations
Key Words.:
:
This article is dedicated to the memory of Eric Paré, one of the originators of CAT, who died in a road accident in July, 1998.
1 Introduction
Mkn 501, at , is the second-closest BL Lac object and, with Mkn 421 (), is one of the two extra-galactic sources thus far detected and confirmed at TeV energies. Its TeV emission was discovered in 1995 by the Whipple observatory group (Quinn et al. (1996)) above , at the level of 8% of the TeV flux of the Crab Nebula, and subsequently confirmed by the HEGRA collaboration (Bradbury et al. (1997)).
Initially, Mkn 501 had been placed in the radio-selected BL Lac family (Stickel et al. (1991), from 1 Jy BL Lac and S4 radio samples). However, its spectral energy distribution (SED) in recent years resembled typical High-Frequency BL Lac objects (mostly X-ray selected) with the low-energy peak in the EUV/soft X-ray energy band, making it a bright Einstein Slew Survey source (Ciliegi et al. (1995)). In fact, it can be considered as being intermediate between the radio- and X-ray bright classes of BL Lac (Lamer & Wagner (1998)).
From March to October 1997, Mkn 501 showed dramatic activity in the VHE -ray band, exhibiting flares during which it became up to times brighter than the Crab Nebula (e.g., see Protheroe et al. (1997)); i.e., two orders of magnitude brighter than its discovery level.
During the same period, Mkn 501 was also extremely active in the X-ray band as reported by the All Sky Monitor (ASM) on board the Rossi X-Ray Timing Explorer (RXTE). In April, high-intensity flares were recorded in the hard X-ray range by RXTE (Lamer & Wagner (1998)), BeppoSAX (Pian et al. (1998)), and OSSE (Catanese et al. (1997)) on board the Compton Gamma Ray Observatory (CGRO). The synchrotron peak underwent a shift towards high energies as compared to archival data, shifting to energies of . This unprecedentedly high energy made Mkn 501 the most extreme known BL Lac object in the X-ray sky.
This paper is dedicated to the study of detailed spectral properties of this source, based on observations carried out with the CAT Čerenkov imaging telescope above in 1997.
The next section describes briefly the CAT telescope and its specific event reconstruction method. The data-sample used for this paper and the resulting source light-curve are presented in Sect. 3. Spectra derived for different-activity states are given in Sect. 4 and intensity-hardness correlations are studied in Sect. 5. In Sect. 6 we compare simultaneous and quasi-simultaneous CAT and BeppoSAX data for the highest flare recorded on April to the lower activity states of the and of the same period. In Sect. 7 we discuss results and their implications for proposed emission models. The conclusions are given in Sect. 8.
2 CAT Čerenkov Imaging Telescope
The CAT (Čerenkov Array at Thémis) imaging telescope started operation in Autumn 1996 on the site of the former solar plant Thémis (France). A complete description of the CAT telescope can be found in Barrau et al. (1998).
The instrument records Čerenkov light from the particles in cosmic-ray showers. The analysis of the shape and the pointing of the resulting images, as discussed in Le Bohec et al. (1998), takes full advantage of the very-high-definition camera. This latter has a full field of view which is comprised of a central region of 546 phototubes in a hexagonal matrix spaced by and 54 surrounding tubes in two “guard rings”.
The -ray image analysis is based on the comparison of individual events and theoretical average images as a function of impact parameter and energy. Accurate analysis of the longitudinal light profile and lateral width of the shower image is possible thanks to the high-resolution camera. This fitting procedure allows the direction and energy of each -ray to be determined with good accuracy: the angular resolution () is of the order of the pixel size; when selecting showers with an impact parameter less than , the energy resolution is about 20%, independent of energy, from approximately to . At the highest energies, the image tails are cut by the field of view, but the light-profile analysis still permits a good energy estimation.
It should be noted that, in general, for the Atmospheric Čerenkov Technique, there is a systematic uncertainty due to variations in the transparency of the atmosphere. Additional uncertainties due to unmastered detector drifts exist, but are fairly low for CAT, and are monitored within the data (e.g., using muon ring images). A conservative estimate of the overall uncertainty on the absolute energy scale is .
To separate -ray initiated shower images from those due to hadronic showers we use the -like goodness-of-fit parameter given by the above procedure, requiring the probability , and the pointing angle (which is the angle at the image barycentre between the actual source position and the reconstructed angular origin of the ray), . In addition, only images with more than 30 photo-electrons and whose fourth brightest pixel has more than 3 photo-electrons are selected, in order to eliminate the lowest-energy triggers. These cuts yield a rejection factor of about 200, with a -ray efficiency better than 40%. Further details on this specific method can be found in Le Bohec et al. (1998).
3 Data Sample
(a)
 (b)
(b)
(c)
 (d)
(d)

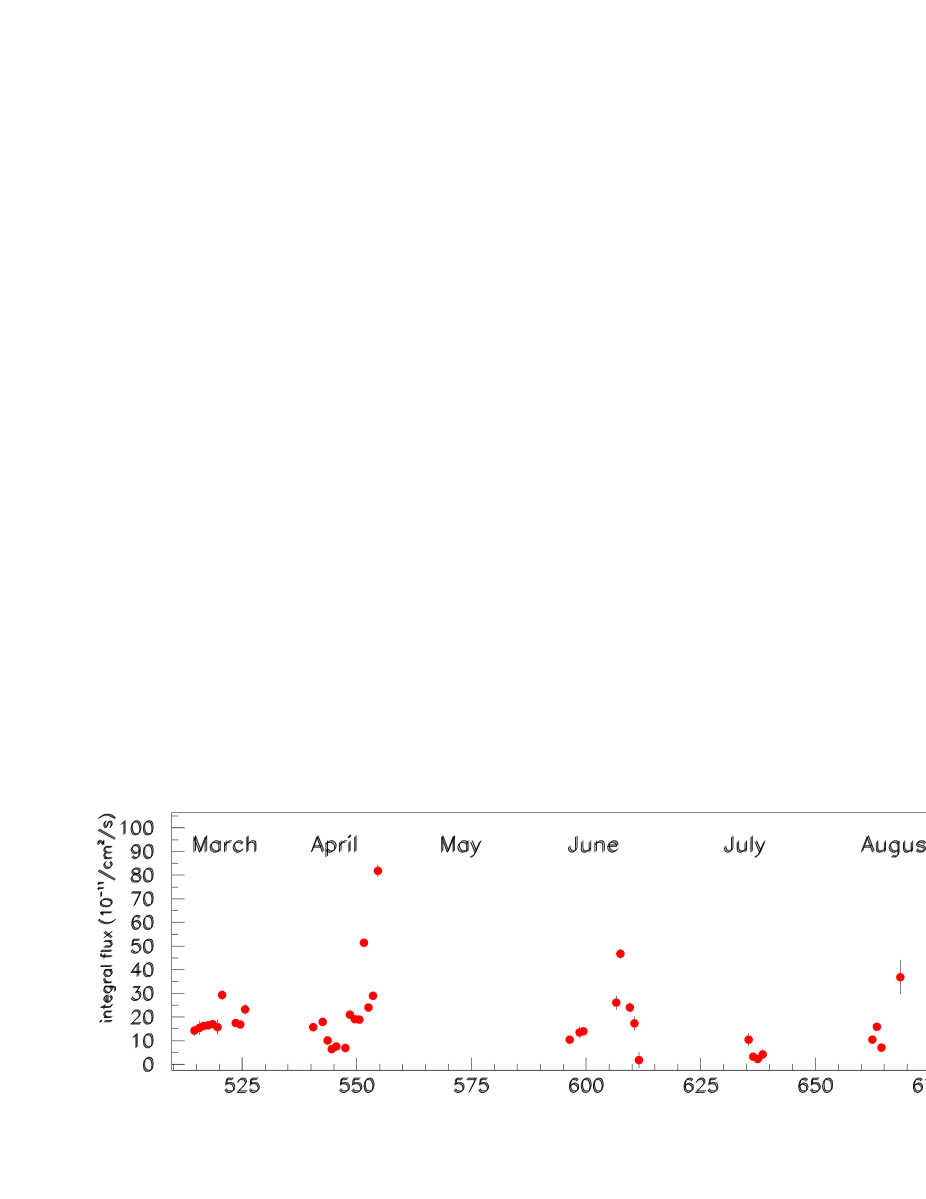
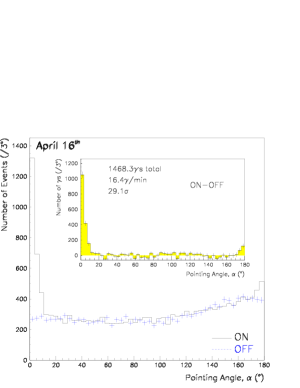
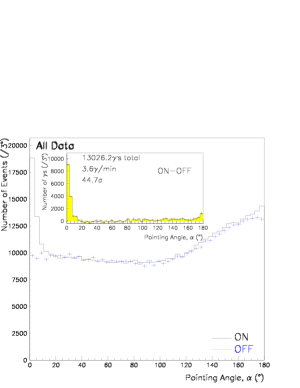
A total of 95.3 hours of data were taken on Mkn 501 (ON), together with 36 hours on control regions (OFF), between March and October 1997. The data used for the analysis were selected by quantitative criteria including clear weather and stable detector operation. The data-set has been further limited to zenith angles , for which the detector calibration studies have been completed. This leaves ON and OFF data for the analysis presented in the following sections. Fig. 1 shows the nightly flux levels as sampled by CAT above between March and October, 1997. The average flux was approximately twice that of the Crab Nebula, while the highest flare, recorded on April (-ray rate ), reached about 8 times the Crab level with signal-to-background ratios of 2.7 for the flare and 0.68 on average (see Fig. 2(a,b)).
4 Spectra
4.1 Analysis Method
As stated in Sect. 3, observations consist of ON and OFF source runs, the latter being used to estimate the background due to hadronic showers. Since the threshold energy of the telescope increases with zenith angle, ON and OFF data are classified within zenith angle bins (with a width of 0.05 in ). Energy bins have been defined so as to be larger than the telescope’s energy resolution. Trigger and cut efficiencies – yielding the effective detection area – as well as the energy-resolution function are determined by detailed Monte-Carlo simulations of the telescope response as a function of energy and zenith angle. These simulations have been checked and calibrated on the basis of several observables using the nearly-pure -ray signal from the highest flare and muon rings. This will be reported in a forthcoming paper.
The spectra are derived in two steps. First, the number of events passing the cuts within each energy and zenith-angle band is determined for ON and OFF runs. Then, for a given hypothesis on the spectral shape, a maximum-likelihood estimation of the spectral parameters is performed, taking into account the effective area and the energy-resolution function of the telescope.
Two hypotheses have been assumed for the spectral shape: a simple power law () and a curved shape (). In fact, as we will see below, the data are not compatible with the former shape. The curved shape is suggested by general considerations on emission processes within blazar jets (see Sect. 7.1). Whipple Observatory has also reported a curved shape in terms of a quadratic law in a vs. representation (Samuelson et al. (1998)). We will use the same framework in order to allow for simple comparisons.
To give an estimate of the relevance of with respect to , the likelihood ratio of the two hypotheses is defined as . It behaves (asymptotically) like a distribution with one degree of freedom.
4.2 Results
| Set | ON | ||||||||
|---|---|---|---|---|---|---|---|---|---|
| (h) | (GeV) | (GeV) | |||||||
| LF | 13.6 | 10.7 | |||||||
| MF | 40.5 | 47.1 | |||||||
| HF | 29.1 | ||||||||
| AV | 57.2 | 61.5 |
In order to investigate spectral variations as a function of source intensity, three independent data-subsets corresponding to different activity states of Mkn 501 – high-intensity flares (HF, integral flux above ), low-intensity runs (LF, integral flux ), and mid-intensity flares (MF) – have been established. The average over the complete data-set (AV) has also been considered. The quadratic law used to estimate the spectral parameters is . Results for each data-subset are given in Table 1. Only statistical errors are quoted in this table.
As noted in Sect. 2, the systematic errors on the absolute energy scale, conservatively estimated at 20%, lead to an error on the absolute flux depending on the spectral index (referred to below as “sys-atm”). Additional errors coming from the limited statistics of the simulated -rays (referred to below as “sys-MC”) used to determine are twofold:
-
–
an overall scaling error which affects the absolute flux.
-
–
possible distortions of as a function of energy within the Monte Carlo errors affecting the parameter . The curvature parameter is, however, almost unaffected.
Both parameters have proved to be insensitive to modifications of the analysis procedure (which modify efficiencies and energy resolution functions), showing that they are robust.
For the AV spectrum, the complete results are:
,
, and
(negligible systematics).
The corresponding covariance matrix for the fit, based on the
statistical errors, is:
with and being correlated.
The likelihood ratio, , for and shows that the HF and MF states (and the AV spectrum) have significantly curved shapes: has values of 29.1 and 47.1 respectively, corresponding to chance probabilities of and of accepting were the power-law hypothesis true. For the LF state, the curvature significance is somewhat lower (a probability of ), but this could be attributed to the weak intensity of the source.
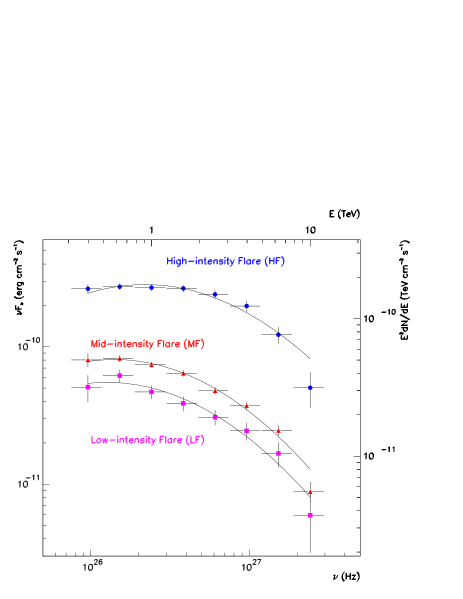
The SEDs are shown in Fig. 3: as can be seen, the VHE peak emission of Mkn 501 clearly takes place in the range of several hundred GeV. The corresponding maximum energy, , of the equivalent quadratic form – proportional to – is given by (see Table 1).
| Set | ON (h) | Flux | |||
|---|---|---|---|---|---|
| I | 1.5 | 68–105 | |||
| II | 3.5 | 45–68 | |||
| III | 5.5 | 28–45 | |||
| IV | 10.5 | 17–28 | |||
| V | 20.5 | 5.5–17 |
There is some indication of an increase in with source intensity, which is equivalently shown by the variation of the fitted values of . Although the power-law hypothesis is clearly not favoured here, the corresponding variation of values follows the same tendency. On the other hand, the curvature (given by ) is compatible with being constant for the three data-subsets. Fixing yields with smaller errors, as shown in the last column of Table 1. This reinforces a possible correlation between intensity and . We will investigate this question in more detail in the next section by looking at intensity-hardness correlations.
In order to determine the highest-energy -rays measured, the effects of the energy-resolution function and the uncertainty in the absolute energy scale must be taken into account. There is a signal at the significance level above , after correction for the number of lower-energy events which migrate above this energy due to the energy resolution (and also to the lesser number which migrate to lower energy). Taking into account also the uncertainty in the absolute energy scale implies (conservatively) that there is a signal above .
5 Spectral Hardness vs. Source Intensity
As compared to a usual spectrum analysis method, a more robust manner to check for spectral changes is to consider two given energies and , and the hardness ratio defined as: .
Given the large energy-bins, this ratio is rather insensitive to statistical fluctuations and entails the estimation of only one parameter. Nevertheless, as the detection threshold of atmospheric Čerenkov telescopes increases with zenith angle and is sensitive to slight changes in weather conditions, it is desirable to limit the data-set to low zenith angle runs (here ) and choose well above the telescope trigger threshold of (here or above).
Although these two restrictions reduce the available statistics, they allow for minor acceptance corrections by weighting data to normalize them to those taken at the Zenith. This minimizes any possible systematic effects. Furthermore, to achieve the best energy resolution, an additional cut on shower impact parameter ( at the Zenith) has been introduced.
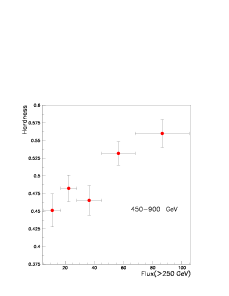
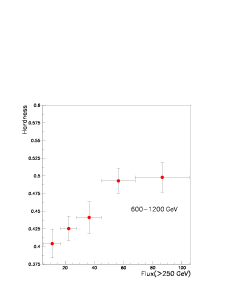
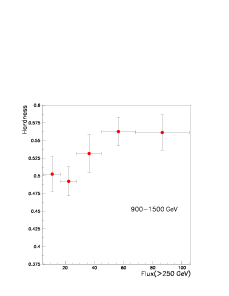
The limited statistics still forbid a reliable computation of the hardness ratio on a run-by-run (or even night-by-night) basis, except for the highest-intensity runs. Therefore, data have been divided into five sets with different average fluxes. For each data-set in flux, the hardness ratio has been computed for three different energy bands, , hereafter referred to as , , and . The number of hours for each data-set and the corresponding average flux and hardness ratio values are given in Table 2.
As can be seen in Fig. 4, a clear correlation between intensity and hardness is present for all energy-band definitions. The chance probabilities of observing such an effect in the case of an absence of correlation for , and are respectively: , , and . We note that as and are raised to higher energies, the significance of the correlation decreases owing to lack of statistics.
| Date | BeppoSAX | X-ray power output | CAT | VHE power output |
|---|---|---|---|---|
| Observing time (UT) | 13– | Observing time (UT) | 0.25– | |
| April | 05:30:29 16:01:47 | 00:34:06 03:56:53 | ||
| April | 05:53:57 16:25:49 | 01:06:57 03:53:16 | ||
| April | 03:36:52 14:35:48 | 01:42:34 03:45:55 |
Considering the curved spectral shape measured in the previous section, and fixing the curvature at , we can calculate the shift in necessary to cause the observed maximum change in . The variation is of the order of , which is fully compatible with the results of the previous section seen in the final column of Table 1.
6 Hard X-ray and -ray correlation
During the April 1997 multi-wavelength campaign, Mkn 501 was observed from X-ray to VHE energies (e.g., see Catanese et al. (1997)). In the energy range 0.1–, the BeppoSAX satellite observed for three periods of hours: on April , and (Pian et al. (1998)). The RXTE satellite observed in the 2– range (Lamer & Wagner (1998)) between July and . X-ray and high energy -ray observations were also performed by the OSSE and EGRET instruments respectively, on board CGRO. In the VHE regime, CAT, HEGRA, Whipple and other instruments were active (Protheroe et al. (1997)).
In the X-ray range, extremely hard spectra were reported by BeppoSAX indicating that the synchrotron power output peaked at or more. OSSE observations gave similar conclusions (Catanese et al. (1997)).

The highest-intensity TeV flare recorded by CAT in 1997 occurred on April (see Fig. 1), where CAT and BeppoSAX observations overlapped for about ten minutes, providing some simultaneous VHE -ray and X-ray data. The observation logs are given in Table 3. On April and , the source was less bright and only quasi-simultaneous data were available, as there was a delay of about two hours between CAT and BeppoSAX pointing periods. However, data from all Čerenkov telescopes (CAT, Whipple and HEGRA) show no large variations in source flux for the periods to and to (Protheroe et al. (1997)). Hence, -ray and X-ray levels can be considered as simultaneous data and compared in a reliable manner.
Table 3 shows comparisons of the VHE and X-ray power output from BeppoSAX and CAT data. The ratio of VHE to X-ray power outputs is plotted in Fig. 5 as a function of the X-ray power, and clearly increases with source brightness.
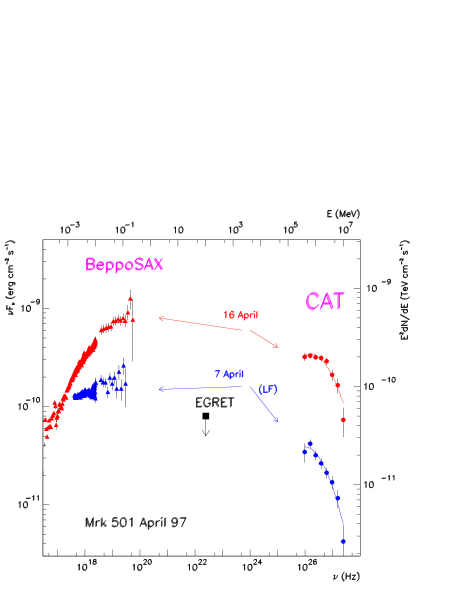
The spectra are shown in Fig. 6. Because of the very high intensity of the source on April , it is possible to derive its spectrum for that single observation (one and a half hours of data). In order to represent the spectrum corresponding to April , the LF data-subset comprising runs with similar flux levels (within 30%) was used.
Four characteristics come out of these comparisons:
-
(i)
the fluxes and SED shapes seen in the CAT and BeppoSAX data, together with the EGRET upper limit in the GeV domain, imply a double structure in the power output of Mkn 501;
-
(ii)
hard X-rays and VHE -rays show correlated variability;
-
(iii)
the luminosity in X-rays remains higher than in -rays;
- (iv)
7 Discussion
CAT observations of Mkn 501 during 1997 have revealed several spectral properties: a curved shape and an emission extending above (Sect. 4), hardness–intensity correlations (Sect. 5), X-ray and -ray correlations (Sect. 6). Together with the power deficit in the GeV range, this strongly suggests a two-component emission spectrum for Mkn 501.
It is generally accepted that the high luminosity of blazars ( erg/s) requires a relativistically-amplified beamed-emission. Beaming is also required for the source to be transparent to -rays if both VHE and IR to UV emissions originate in the same region of the jet (Dermer & Gehrels (1995); Dondi & Ghisellini (1995)). Two major processes have been suggested as the dominant source of the high-energy emission from blazars: inverse Compton (IC) scattering of low-energy photons by ultra-relativistic electrons, and -decay through photo-production or secondary production of pions by an ultra-high-energy hadronic component in the jet (Mannheim & Biermann (1992); Mannheim (1993)).
In the IC case, a double-structure spectrum in terms of synchrotron and IC emissions is predicted with the two components being correlated in intensity, hardness, energy of the peak luminosities, etc. The correlations depend on the nature of the target-photon population. This may consist of either synchrotron photons within the jet – the synchrotron self-Compton, or SSC, mechanism (Königl (1981); Marscher & Gear (1985); Ghisellini et al. (1996)) – or external radiation, either from the accretion disk (Sikora et al. (1994); Dermer et al. (1992)), or reflected by the broad-line region clouds (Ghisellini & Madau (1996)). Spectral variations of the primary electrons (due for example to a change in the injection-acceleration efficiency or in cooling conditions), seen through their effect on the synchrotron radiation, should be reflected in the high-energy emission, especially when the IC interactions take place in the Thomson limit. In the Klein-Nishina regime, hardening effects can be attenuated because of a severe cross-section drop at high energies.
In hadronic models, no particular predictions are made for a marked two-component emission. A continuum emission is predicted due to secondary cascades produced by hadronic interactions of ultra-high-energy protons, which tend to fill the gap between the high-energy (-ray) and low-energy (X-ray) domains.
7.1 Curved Shape
The spectral shape derived in Sect. 4 between and is clearly curved. This curvature is in contrast with reports on the other TeV blazar, Mkn 421, whose spectrum has been observed to be compatible with a power-law (Krennrich et al. (1999); Piron et al. (1999)). The curved shape is predicted by IC models of blazar spectra but can only be seen if the IC component is observed over a broad dynamic range close to the maximum power emission energy (i.e., close to the maximum of the IC bump in a representation). The curvature could arise from intrinsic absorption effects (within the jet or due to nearby radiation fields, from the accretion disk, for example) and/or from a cutoff in the primary particle spectrum. However, when observing within a limited energy range – as compared to the energy scale over which the emission phenomenon is taking place – not including the peak emission region, a power-law spectrum is naturally seen. We note that the reported synchrotron peak of Mkn 501 during 1997 is well above that of Mkn 421 ( as compared to ) and that the IC and synchrotron peak-emission energies are expected to be correlated in IC schemes. This correlation has also been established on a purely observational basis using a large sample of blazars (Fossati et al. (1998)). Thus, the difference in observed spectral shapes for Mkn 421 and Mkn 501 may well arise because the peak of the high-energy component for Mkn 421 is below the VHE energy domain, whereas the peak for Mkn 501 is well above our threshold.
The overall spectrum, and particularly the highest energy -rays (10–), may be affected by intergalactic absorption due to pair creation on the intergalactic background IR radiation (Stecker & de Jager (1998); Biller et al. (1998)). Therefore any interpretation of VHE spectra in terms of emission models should take this effect into account. It could be disentangled from intrinsic absorption features if we dispose of a large sample of VHE emitters. Nevertheless, the different spectral shapes of Mkn 501 and Mkn 421 – which have similar red-shifts and have been detected above (Krennrich et al. (1999)) – imply already that the curvature of the former must be mainly due to intrinsic features.
7.2 Hardness–intensity and -ray/X-ray Correlations
In Sect. 5, a correlation between VHE intensity and spectral hardness was demonstrated. If we assume a constant curvature for different-activity states as indicated by the data, this effect is equivalent to an increase of approximately for the peak emission energy for an intensity change of about an order of magnitude between the LF and HF subsets.
BeppoSAX results have established that the energy of the maximum power output during the active period is much larger than during the low-emission state (Pian et al. (1998)). A comparison of April and X-ray data suggests that this hardening continues as the intensity increases during the flare.
This simultaneous observation of flaring activity and spectrum hardening, in both X-ray and VHE energy ranges, is naturally explained by a common primary electron population, as expected in the framework of inverse Compton models. Pian et al. (1998) claim that a significant change in the magnetic field intensity or the Doppler factor is unlikely since the expected changes in the lower-energy part of Mkn 501 spectrum which would result have not been observed; i.e., the X-ray emission below did not show any dramatic variation. In this case, this would leave the injection of a transient electron population and/or a change in the acceleration efficiency (an increase of the maximum energy of electrons) as the most likely source of the flares.
In the framework of IC models, the observed increase of the VHE to X-ray intensity ratio with source brightness (see Fig. 5) is qualitatively in agreement with the SSC mechanism which predicts a quadratic increase of VHE intensity with X-ray brightness due to the fact that both the electron population and the “target” synchrotron populations are enhanced. The yield of the SSC contribution to the IC process should be damped by the decreasing cross-section in the extreme relativistic Klein-Nishina regime. The highest intensity data point in Fig. 5 is consistent with such an effect.
7.3 Comparison with other VHE detections
The Whipple group’s results for Mkn 501 between and (Samuelson et al. (1998)) show an average spectrum with and , in good agreement with CAT results within the statistical errors. HEGRA (Aharonian et al. (1999)) has also demonstrated a curved spectral shape. Given the source variability and the different source sampling due to local conditions, one does not expect the absolute flux levels observed in the three experiments to be identical. Nonetheless, the convergence of these three observations as regards the spectral shape is noteworthy.
No hardening effect has been claimed by either Whipple or HEGRA. While this appears to contradict the effect seen in our data, it may be explained for each case. We note that Whipple’s reported results are limited to the period between February and June 1997 and include of data. The CAT results are based on a larger sample ( of observations for the hardness-intensity studies), and include runs from June to October 1997, providing large statistics of the source emission in a lower-activity state. The effect reported here could hardly be seen with lower statistics.
Considering HEGRA results, their higher energy threshold might well result in a lower sensitivity to the hardness-intensity correlation: as shown in Sect. 6, this effect becomes less significant when we consider higher energy events.
8 Conclusion
The results reported in this paper are based on the large sample of data taken by CAT from March to October 1997, including periods with very different source intensities. The Mkn 501 spectrum has been measured from to . The curvature reported by the Whipple group is confirmed. In addition, CAT data show an intensity-hardness correlation which can be simply described by a shift of the peak TeV emission energy.
The overall picture emerging from these spectral properties and from the comparison with simultaneous and quasi-simultaneous BeppoSAX observations favours the interpretation in terms of an energetic electron beam propagating in a magnetic plasma and producing X-rays through synchrotron radiation as well as VHE -rays through inverse Compton scattering of low-energy photons.
Acknowledgements.
The authors wish to thank the French national institutions IN2P3/CNRS and DAPNIA/DSM/CEA for supporting and funding the CAT project. The CAT telescope was also partly funded by the Languedoc-Roussillon region and the Ecole Polytechnique. The authors also wish to thank Electricité de France for making available to them equipment at the former solar plant “Thémis” and allowing the building of the new telescope and its hangar. They are grateful to the French and Czech ministries of Foreign Affairs for providing grants for physicists’ travel and accommodation expenses.References
- Aharonian et al. (1999) Aharonian, F., et al., 1999, A&A 342, 69
- Barrau et al. (1998) Barrau, A., et al., 1998, NIM A416, 278
- Biller et al. (1998) Biller, S., et al., 1998, Phys. Rev. Lett. 80, 2992
- Bradbury et al. (1997) Bradbury, S., et al., 1997, A&A 320, L5
- Catanese et al. (1997) Catanese, M., et al., 1997, ApJ 487, L143
- Ciliegi et al. (1995) Ciliegi, P., Bassani, L., Caroli, E., 1995, ApJ 439, 80
- Dermer & Gehrels (1995) Dermer, C.D., and Gehrels, N., 1995, ApJ 447, 103
- Dermer et al. (1992) Dermer, C., Schlickeiser, R., and Mastichiadis, A., 1992, A&A 256, L27
- Dondi & Ghisellini (1995) Dondi, L., and Ghisellini, G., 1995, MNRAS 273, 583
- Fossati et al. (1998) Fossati G., Maraschi, L., Celotti, A., Comastri, A., and Ghisellini, G., 1998, MNRAS 299, 433
- Ghisellini & Madau (1996) Ghisellini, G., and Madau, P., 1996, MNRAS 280, 67
- Ghisellini et al. (1996) Ghisellini, G., Maraschi, L., and Dondi, L., 1996, A&AS 120, 503
- Königl (1981) Königl, A., 1981, ApJ 243, 700
- Krennrich et al. (1999) Krennrich, F. et al., 1999, ApJ 511, 149
- Lamer & Wagner (1998) Lamer, G. and Wagner, S., 1998, A&A 331, L13
- Le Bohec et al. (1998) Le Bohec, S., et al., 1998, NIM A416, 425
- Mannheim (1993) Mannheim, K., 1993, A&A 269, 67
- Mannheim & Biermann (1992) Mannheim, K., and Biermann, P., 1992, A&A 253, L21
- Marscher & Gear (1985) Marscher, A. and Gear, W., 1985, ApJ 298, 114
- Pian et al. (1998) Pian, E., et al. 1998, ApJ 492, L17
- Piron et al. (1999) Piron, F. et al., in preparation
- Protheroe et al. (1997) Protheroe, R.J., et al., 1997, Proc. 25th ICRC (Durban), vol. 8, p. 317
- Quinn et al. (1996) Quinn, J., et al., 1996, ApJ 456, L83
- Samuelson et al. (1998) Samuelson, F., et al., 1998, ApJ 501, L17
- Sikora et al. (1994) Sikora, M., Begelman, M., and Rees, M., 1994, ApJ 421, 153
- Stecker & de Jager (1998) Stecker, F., and de Jager, O. C., 1998, A&A 334, L85
- Stickel et al. (1991) Stickel, M., Padovani, P., Urry, C.M., Fried, J.W., Kühr, H., 1991, ApJ 374, 431