TeV gamma-ray observations from nearby AGNs by Utah Seven Telescope Array
The Utah Seven Telescope Array collaboration
T.Yamamoto1,
N.Chamoto2, M.Chikawa3, S.Hayashi2, Y.Hayashi4, N.Hayashida1,
K.Hibino5, H.Hirasawa1, K.Honda6, N.Hotta7,
N.Inoue8, F.Ishikawa1, N.Ito8, S.Kabe9,
F.Kajino2, T.Kashiwagi5, S.kakizawa19, S.Kawakami4, Y.Kawasaki4,
N.Kawasumi6, H.Kitamura16, K.Kuramochi11, E.Kusano9,
E.C.Loh12, K.Mase1, T.Matsuyama4, K.Mizutani8, Y.Morizane3,
D.Nishikawa1, M.Nagano18, J.Nishimura13, T.Nishiyama2,
M.Nishizawa14, T.Ouchi1, H.Ohoka1, M.Ohnishi1, S.Osone1,
To.Saito15, N.Sakaki1, M.Sakata2, M.Sasano1,
H.Shimodaira1, A.Shiomi8, P.Sokolsky12, T.Takahashi4,
S.F.Taylor12, M.Takeda1, M.Teshima1, R.Torii1, M.Tsukiji2,
Y.Uchihori16, Y.Yamamoto2, K.Yasui3, S.Yoshida1,
H.Yoshii17, and T.Yuda1
1Institute for Cosmic Ray Research, University of Tokyo, Tokyo 188-8502, Japan
2Department of Physics, Konan University, Kobe 658-8501, Japan
3Department of Physics, Kinki University, Osaka 577-8502, Japan
4Department of Physics, Osaka City University, Osaka 558-8585, Japan
5Faculty of Engineering, Kanagawa University, Yokohama 221-8686, Japan
6Faculty of Education, Yamanashi University, Kofu 400-8510, Japan
7Faculty of Education, Utsunomiya University, Utsunomiya 320-8538, Japan
8Department of Physics, Saitama University, Urawa 338-8570, Japan
9High Energy Accelerator Research Organization (KEK), Tsukuba 305-0801, Japan
10Department of Physics, Kobe University, Kobe 657-8501, Japan
11Faculty of Science and Technology, Meisei University, Tokyo 191-8506, Japan
12Department of Physics, University of Utah, Utah 84112, USA.
13Yamagata Academy of Technology, Yamagata 993-0021, Japan
14National Center for Science Information System, Tokyo 112-8640, Japan
15Tokyo Metropolitan College of Aeronautical Engineering, Tokyo 116-0003, Japan
16National Institute of Radiological Sciences, Chiba 263-8555, Japan
17Department of Physics, Ehime University, Matsuyama 790-8577, Japan
18Department of Applied Physics and Chemistry, Fukui University of Technology, Fukui 910-8505, Japan
19Department of Physics, Shinshu University, Matsumoto 390-8621, Japan
Abstract
We have investigated TeV gamma-ray emissions from nearby X-ray selected BL Lac objects using the Utah Seven Telescope Array for more than two years. These objects can be considered as potential sources of TeV gamma rays with inverse compton model. The gamma-ray flares from Mrk421 and Mrk501 found in these observation will be reported.
1 Introduction:
Several sources, Active Galactic Nuclei (AGNs) and Super Nova Remnants (SNRs) are identified as TeV gamma-ray sources so far by the ground based Cherenkov telescopes. TeV gamma-ray observations of AGNs give us an opportunity to investigate the environment near the central massive black hole in the AGN and the particle acceleration in the jet. In addition, detail study of the energy spectrum of the TeV gamma rays from different distance sources makes it possible to measure the density of inter-galactic infrared photons. With these reasons, the study of TeV gamma-ray emission from AGNs is very important. The nearest X-ray selected BL Lacs, Mrk421 (z=0.031) and Mrk501(z=0.034) are identified as TeV gamma-ray sources.
Using the Utah Seven Telescope Array, we have observed Mrk421 and Mrk501 intensively since early 1997. We have started the survey observation of XBL Lacs since the autumn of 1997 just after the detection of flares of TeV gamma-ray emission from Mrk501 in 1997. Survey observations were carried out more than 700 hrs so far. Some results from the survey observation in 1997, 1998 and 1999 are reported in this paper.
2 Experiment:
Table 1 shows observation time under good weather conditions for each sources. We have selected nearby XBL Lacs with the redshift less than 0.2 in the northern hemisphere (Stecker et al. 1996). Observation targets list of the day was made every night by choosing the objects which pass thorough near the zenith. According to the target list, all telescopes track the same target. We adopted the tracking method called as “Raster Scan”. In this mode, the tracking center of the telescopes scans the square region of in right ascension and declination coordinate centered on the target with a cycle of 48minutes. After the observation with one raster scan cycle, the data is analyzed immediately. If we find unusual event excess at the source position, the observation is continued for another raster scan cycle. If there is no excess, all telescopes begin to track next target as in schedule. These data are transfered to Japan through the Internet for detail analysis.
Optimization of the cut values for image parameters was carried out using the data of Mrk501 obtained in 1997. Threshold energy and mode energy of the detector for gamma rays are estimated as 600 GeV and 900GeV, respectively. By using the optimized cut values, we estimate by the Monte Carlo simulation that 40% of gamma rays are picked up and 99.8% of the background cosmic rays are rejected.
3 Results:
We have analyzed about 700 hours observation data of AGNs under the good weather condition(corresponds to 2000 hrs telescopes exposure). We have detected clear signals from Mrk501 and Mrk421. Possible detection of gamma-ray emissions from 1ES1959 is reported in OG.2.1.21. We could not see clear signals from other sources except for these three, however, detail analysis is still going on. In this report, the results of Mrk501 and Mrk421 will be presented.
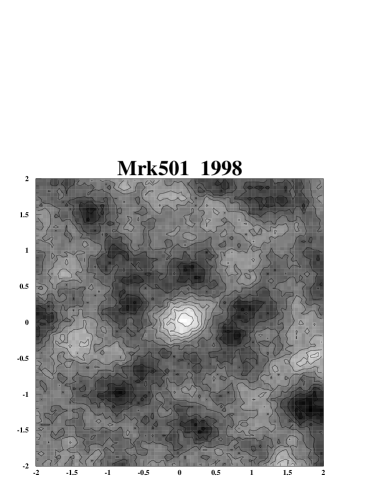
Figure 1 shows time variation of gamma-ray intensity from Mrk501 in 1997 and 1998. The observation time was 360 hrs tels and 215 hrs tels, respectively. Mrk501 was very active in 1997 and the intensity of the gamma rays varied with about 24 days periodicity (see OG.2.1.17). The activity of Mrk501 became low in Sep. 1997. From the observation in 1998, we could not see any clear flares, however, most of data points deviate in the positive direction as shown in figure 1. By adding all data observed in 1998, we obtained 6 sigma excess. Two dimensional excess map from the Mrk501 for 1998 data is shown in Figure 3. We can conclude that the activity of Mrk501 became lower in Sep. 1997, however, the gamma-ray emission still continued until Sep. 1998. The Mrk501 should be monitored continuously to investigate the cause of the variability of the VHE gamma-ray emission.
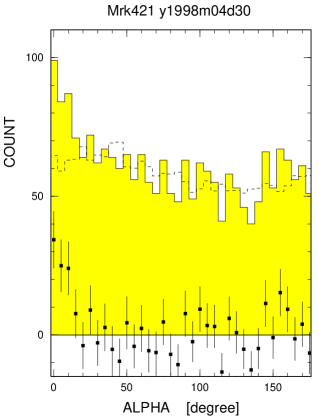
The observation of Mrk421 were carried out for 25 nights from April to May in 1998, under good weather condition. Total observation period was 56 hrs. Among these observations, the most clear excess of 5.3 sigma was found in 1.3 hrs observation on 30th of April 1998(2450933 MJD). distribution of the data in this flare is shown in Figure 3.
As reported in the previous paper (Hayashida et al 1998),
the energy spectrum of Mrk501 in 1997 showed interesting feature,
the spectral index became steeper around several TeV.
If we assume that this lack of higher energy gamma rays is
due to the interaction with the inter-galactic infrared photons,
it is expected that the similar
shape appears for the spectrum of Mrk501(98) and Mrk421 because of the
similar redshifts of Mrk501 and Mrk421.
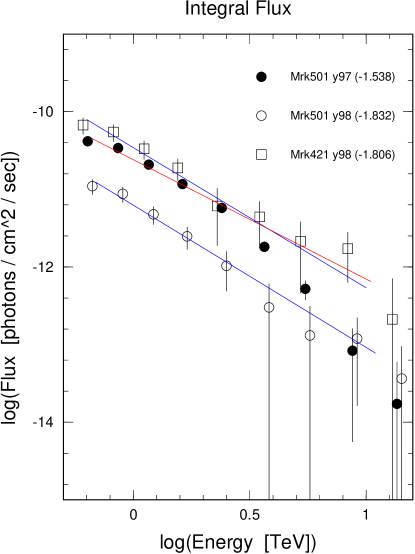
In Figure 4, integral spectra of Mrk421(30/Apr/98),
Mrk501(97) and Mrk501(98) are compared.
The indices of the integral spectrum between 900 GeV and 3 TeV
are -1.54 for Mrk501(97), -1.83 for Mrk501(98)
and -1.81 for Mrk421(30/Apr/98).
Following this figure, only the spectrum for Mrk501(97) is harder at low energy and
softer at high energy than those for Mrk421 and Mrk501(98).
Acknowledgments
This work is supported in part by the Grants-in-Aid for Scientific Research (Grants #0724102 and #08041096) from the Ministry of Education, Science and Culture. The authors would like to thank the people at Dugway for the help of observations.
References
Stecker, F.W., De Jager, O.C.,& Salamon, M.H., 1996, ApJ 473, L75
Hayashida, N. et al, 1998, ApJ 504, L71
Nishikawa, D. et al, 1999,Proc.26th ICRC(Salt Lake city,1999)OG.2.1.17
| Object | z | hours | Object | z | hours | |
|---|---|---|---|---|---|---|
| telescope | telescope | |||||
| Mrk421 | 0.031 | 561.6 | 1ES0145+138 | 0.125 | 38.0 | |
| Mrk501 | 0.034 | 532.1 | EXO0706.1+5913 | 0.125 | 82.9 | |
| 1ES2344+514 | 0.044 | 43.1 | 1ES0229+200 | 0.139 | 89.0 | |
| 1ES1959+650 | 0.048 | 250.0 | 1ES0323+022 | 0.147 | 29.9 | |
| 1ES2321+419 | 0.059 | 101.4 | 1ES0927+500 | 0.188 | 85.5 | |
| BL Lac | 0.069 | 49.6 | 1ES0446+449 | 0.203 | 38.9 |