Search for VHE pulsed emission from the Crab with the CAT Telescope
A. Musquère1, for the CAT collaboration1,2,3
1 CESR, CNRS/UPS, Toulouse, France (musquere@cesr.fr)
2 IN2P3/CNRS and DAPNIA/CEA, France
3 Charles University, Prague, Czech Republic
Abstract
Since 1996, the CAT experiment, operating at the THEMIS site (French Pyr n es), has been collecting Very High Energy (VHE) -ray data from the Crab. The temporal analysis of photon arrival times folded with the pulsar parameters did not reveal any significant pulsation. The upper limit of a steady pulsed flux over the 102.7 hours of observation is 1.5 10-12 cm-2 s-1, 3.0 10-13 cm-2 s-1 and 5.4 10-14 cm-2 s-1 above 250 GeV, 1 TeV and 5 TeV, respectively. These results put stringent constraints on the models of high energy pulsar electrodynamics.
1 Introduction
The Crab Nebula has an extraordinarily broad spectrum, mostly attributed to synchrotron radiation from the relativistic wind of electrons, accelerated up to a few TeV and injected by the pulsar in the surrounding nebula (De Jager & Harding 1992, Atoyan & Aharonian 1996). However, above 1 GeV, a high energy spectral component is thought to be produced by inverse Compton scattering between “seed” photons (essentially the synchrotron spectrum of the Nebula in the Crab case) and the relativistic wind. This continuous emission has been detected by many VHE groups (Weekes et al. 1989, Vacanti et al. 1991, Akerlof et al. 1990, Baillon et al. 1991, Goret et al., 1993, 1997, Iacoucci & Nuss 1998) and its integral flux appears constant making the Crab Nebula the standard candle in VHE astronomy.
Pulsed radiation has been detected up to GeV energies. Although some groups have reported transient TeV pulsed emission, long term observations of the pulsar show no modulation. In particular, a stringent upper limit for a pulsed emission with 10 % duty cyle of cm-2 s-1 has been derived above 300 GeV by the Whipple group (Gillanders et al. 1997).
In this paper, we present the results of the search for pulsed emission from the Crab with the CAT telescope. First, we briefly describe the instrument and the methods used for selecting VHE photons. Then, upper limits are derived and compared to results obtained with similar experiments. Finally, implications for the physics of the pulsar and possible developments of this study are briefly discussed.
2 The CAT VHE telescope and the data reduction
The CAT imaging telescope uses the Atmospheric Cherenkov Technique (ACT) to observe Very High Energy -ray sources. A comprehensive description of the experimental setup can be found in Barrau et al. (1998). This setup features a very high definition camera consisting of 600 phototubes (PMT) at the focus of a 17.8 m2 mirror. The CAT experiment has been operating since September 1996 in the French Pyr n es on the site of the former Themis solar power plant. The trigger requires a signal greater than 3 photoelectrons in at least 4 PMTs. With such conditions, the trigger rate is about 15 Hz at zenith. When triggered, the camera records the image of cosmic-ray showers through Cherenkov light. Each triggered event gets a time stamp using a GPS (Global Positioning System) clock.
Due to the fine grain of the CAT camera, a powerful image analysis is performed, based on a maximum likelihood method using the longitudinal and transverse distributions of Cherenkov light in each image (Le Bohec et al. 1998). It provides a -like goodness-of-fit parameter () allowing a good gamma-ray/hadron separation as well as a measurement of the direction () and energy of electromagnetic shower.
The CAT standard selection of -ray-like events is made with the following cuts : , , Q where Qtot is the total number of photoelectrons in the image. Simulations show that this selection yields to -ray efficiency better than and a rejection factor for hadrons of . For this particular combination of cuts, we have determined (from the MC simulations) the effective area (Aeff(E,) in cm2) as a function of energy and zenital pointing angle ().
3 Search for pulsed emission
Since september 1996, the Crab nebula has been observed with the CAT telescope during ON scans for 102.7 hours. Arrival times of individual events were converted from Universal Coordinated Time to Barycentric Dynamical Time, then corrected for the propagation delay to the solar system barycenter using the JPL DE200 planetary ephemeris (Standish 1982). Corresponding radio phases were obtained from the Jodrell Bank ephemeris (Lyne 1999). To search for a possible modulation at the pulsar frequency, we applied the standard selection criteria described above and construct 60 bin phasograms with selected events for various combinations of observing time and energy ranges. Each of these phasograms were tested for non-uniformity using a Pearson’s test. These phasograms show no evidence for any peculiar excess, especially if we consider the relatively high number of trials.
To derive an upper limit for the pulsed emission, two assumptions must be made : the pulsar duty cycle (10 % centered on radio origin) and the spectral shape (a power law with a differential spectral index = 2.15). Both assumptions are consistent with the EGRET observations at lower energies (Nolan et al. 1993). Knowing the total number of events above the cuts in a given energy range (E), we can derive a 99.9 % confidence level upper limit for the number of pulsed photons (Nul) over the full observations. This number is converted to an integral flux upper limit (Ful) by dividing its value by the total acceptance of the telescope (Atot, in cm2 sec). This acceptance is calculated by averaging the effective area (A(E,)) over the expected spectrum and summing the contributions of all the runs we used. In these calculations, we take into account the energy resolution of the telescope and the actual zenith angle.
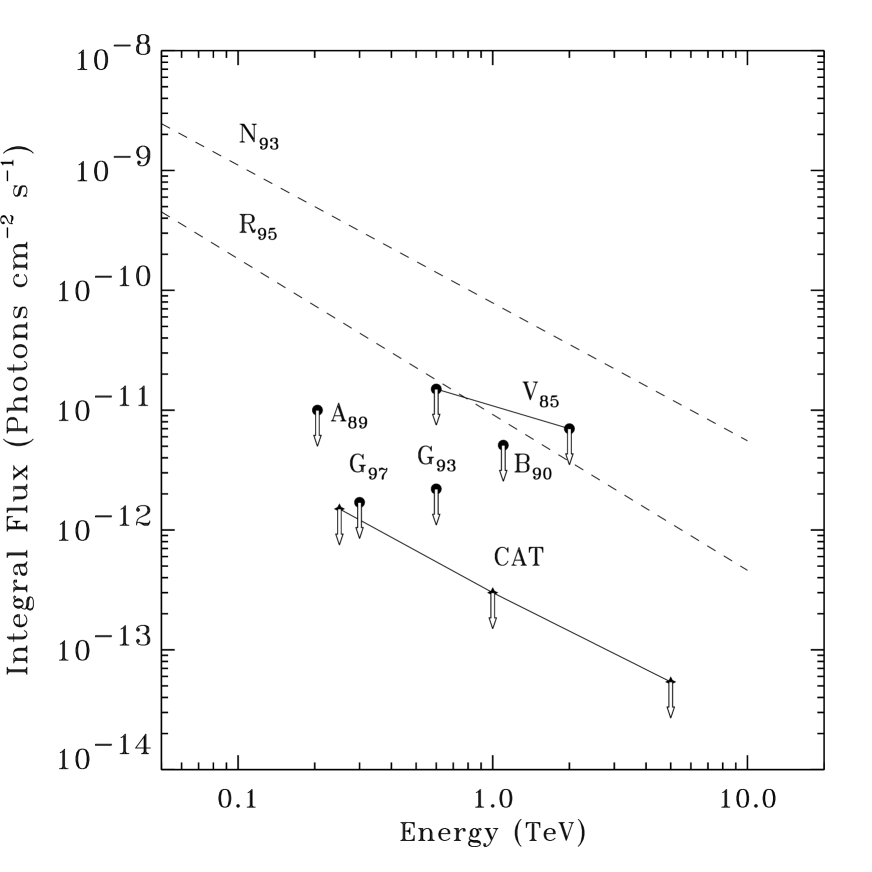
The results of this analysis are reported for three energy thresholds in Table 1. The upper limits are then compared to previously published ones in Figure 1. The CAT upper limits presented here are consistent (even slightly better) with the upper limit reported by the Whipple group above 300 GeV (Gillanders et al. 1997).
| Ntot | Nul | Atot | Ful | |
|---|---|---|---|---|
| (GeV) | (cm2 sec) | (ph cm-2 sec-1) | ||
| 250 | 28342 | 168 | 1.1 1014 | 1.5 10-12 |
| 1000 | 10251 | 102 | 3.4 1014 | 3.0 10-13 |
| 5000 | 679 | 27 | 5.0 1014 | 5.4 10-14 |
4 Discussion
Pulsed emission from the Crab, characterized by a power-law spectrum, is possibly generated in the corotating magnetosphere by relativistic particles accelerated in vacuum gaps. In the outer gap model, primary charged particles accelerated to highly relativistic energies emit curvature and/or inverse-compton radiation. A synchrotron emission (from optical to -rays) is produced by the secondary particles generated in the induced electromagnetic cascades (Cheng, Ho & Ruderman 1986 see also Romani 1996 and references therein). A revised version of this model (Romani 1996, Romani & Yadigaroglu 1995), including the Compton upscattering of the synchrotron emission on the primary e+/- predicts (for a standard -ray pulsar : B=3 1012 Gauss, synchrotron cutoff at 3 GeV) a TeV pulsed emission containing 1 % of the GeV flux and showing up in the spectrum well above the synchrotron cutoff.
In the polar cap model, the acceleration region is located above the neutron star polar caps, in a region of a few NS radii which encloses open magnetic field lines (Daugherty & Harding 1996, Harding & Muslimov, 1998 and references therein). In this case, primary particles of maximum energy between 5 and 50 TeV are produced across the gap. These high energy particles radiate a VHE emission via curvature radiation and/or inverse Compton scattering with seed photons (possibly the soft thermal emission coming from the neutron star surface). The escape probability of the produced photons crucially depends on attenuation processes such as the magnetic pair creation close to the neutron star.
The EGRET observations of the Crab suggest that a spectral cut-off or a break occurs around 1 GeV with a integral spectral index of -0.88 below this value and -1.3 above it (Ramanamurthy et al. 1995). The upper limits obtained with the CAT experiment represent 3 % of the extrapolation of the EGRET spectrum (see Figure 1, R95) strongly suggesting that spectrum above few GeV is much steeper than predicted with a simple broken powerlaw. On the other hand, our upper limits give a stringent constraint for a TeV pulsed component such as the one discussed above.
The above discussion demonstrates that the quest for a pulsed emission from the Crab pulsar above a few GeV must go on. First, more observations have to be performed with imaging VHE telescopes and the Crab definitively remains a major target for CAT. Second, the analysis scheme might also be extended to steeper pulsar spectra with different cuts adapted to the corresponding spectral index. This study will be reported in a future work. Finally, future observations in the 1-200 GeV energy range with instruments such as CELESTE, HESS and GLAST will certainly provide new insights.
References
Akerlof C.W., et al. 1990, Proc. of the XXI ICRC (Adelaide), 2, 135
Akerlof C.W., et al. 1989, Proc. of the GRO Workshop (Greenbelt, NRL), 4-49
Atoyan A.M., & Aharonian, F.A. 1996, MNRAS, 278, 525
Baillon P., et al. 1991, Proc. of the XXII ICRC (Dublin), 1, 220
Barrau, A., et al. 1998, NIM A, 416, 278
Bhat P.N., et al. 1990, Proc. of the XXI ICRC (Adelaide), 2, 148
Chen K.Y., Ho C. & Ruderman M.A., 1986, Astrophys. J., 300, 522
Daugherty J.K., & Harding A.K., 1996, Astrophys. J., 458, 278
de Jager O.C., & Harding, A.K. 1992, Astrophys. J., 396, 161
Gillanders G.H., et al. 1997 , Proc. of the XXV ICRC (Durban), 3, 185
Goret P., et al. 1993, A&A, 270, 401
Goret P., et al. 1997, Proc. of the XXV ICRC (Durban), 3, 173
Harding A.K. & Muslimov A.G., 1998, Astrophys. J., 508, 328
Iacoucci L., & Nuss E., 1998, Proc. of the XVI ECRS (Madrid), G.R.2.5, 363
Le Bohec S., et al. 1998, NIM A, 416, 425
Lyne A.G., 1999, Jodrell Bank Crab Monthly Ephemeris
(http://www.jb.man.ac.uk/pulsar/crab.html)
Nolan P.L., et al. 1993, Astrophys. J., 409, 697
Ramanamurthy P.V., et al. 1995, Astrophys. J., 450, 791
Romani R.W., 1996, Astrophys. J., 470, 469
Romani R.W. & Yadigaroglu I.A., 1995 Astrophys. J., 438, 314
Standish M., 1982, A&A, 114, 297
Vacanti G., et al. 1991, Astrophys. J., 377, 467
Vishwanath P.R., et al. 1985, Proc. of the IXX ICRC (La Jolla), 1, 144
Weekes T.C., et al. 1989, Astrophys. J., 342, 379