Optical observations of GRB afterglows: GRB 970508 and GRB 980326 revisited ††thanks: Based on observations collected at the German-Spanish Astronomical Centre, Calar Alto, operated by the Max-Planck-Institut für Astronomie, Heidelberg, jointly with the Spanish National Commission for Astronomy.,††thanks: Based on observations carried out at the 4.2-m William Herschel Telescope operated by the Royal Greenwich Observatory in the Spanish Observatorio del Roque de los Muchachos of the Instituto de Astrofísica de Canarias.
Abstract
Since January 1997, we have monitored 15 GRB fields, detecting 6 optical/IR afterglows. We have revisited GRB 970508 and GRB 980326. For GRB 970508, we derive a power-law decay exponent = -1.19 (R-band). The luminosity of the host galaxy relative to the characteristic luminosity is in the range 0.06–0.15, i.e. a dwarf galaxy. For GRB 980326, we derive a power-law decay exponent = -1.7, taking into account the new upper limit for the host as R 27.3 provided by Bloom and Kulkarni (1998). This implies one of the fastest GRB optical decays ever measured. The fact that only about 50 % of optical transients have been found within the /X-ray error boxes, suggest that either considerable intrinsic absorption is present or that some optical transients display a very fast decline. We also propose that the ′′secondary maximum′′ detected on 17 Apr 1998 could be explained in the context of the ′′SN-like′′ light curves 2-3 weeks after the GRB, as recently suggested by Woosley (1999).
Key Words.:
Methods: observational, Gamma rays: bursts1 Introduction
Since 1997, we have been monitoring the error boxes of gamma-ray bursts (hereafter GRBs) detected by the BSAX or RXTE satellites. We have monitored 15 GRB fields on the aggregate, detecting 6 optical/IR afterglows. See Castro-Tirado (1999) and Gorosabel (1999) for a review of results. Here we focus on the GRB 970508 and GRB 980326 afterglows.
2 Observations: some selected results
2.1 GRB 970508 and its host galaxy
The optical counterpart was discovered by Bond (1997). After a initial phase of constant brightness lasting one day (as inferred from the light curves shown in Fig. 1), a strong flare took place. The peak brightness of the optical light occurred two days after the GRB, and a maximum was reached in the R and U bands at the same time. The increase in brightness was similar to the one inferred for GRB 970228 (Guarnieri et al. 1997).
New U and R-band images taken on 11 May showed that the source was declining in brightness (Castro-Tirado et al. 1997) and by ten months later, it almost reached the quiescent level, revealing a 25th mag galaxy in the R-band (Bloom et al. 1998a, Castro-Tirado et al. 1998a). The decay of the optical flux could be modelled in terms of a power law decay, with (), assuming a host galaxy with R = 25.72 0.20 according to Bloom et al. (1998). On the basis of an extrapolation of the V- and B-band measurements into the U-band, assuming a given spectral shape (Bloom et al. 1998b, Zharikov et al. 1998), we obtain U = 26.56 0.25 for the host. If the U-band flux also followed a power-law decay, then (), implying a faster decay than that observed at longer wavelength. This difference in decay slope between and is marginal given the large error on the U-band decay slope.
With respect to the host galaxy, and depending on the value of the -correction and spectral index () considered, we obtain () or (). The first value is consistent with that reported by Zharikov et al. (1998). In both cases the object is well below the knee of the galaxy luminosity function, (Schechter 1976) and the luminosity of the host galaxy relative to the characteristic luminosity is 0.06 or 0.15 depending of the value of considered. The host galaxy corresponds to any of the following categories: a starburst, a red dwarf starburst, a irregular dwarf, a HII galaxy or a blue compact dwarf galaxy. All these types of dwarfs galaxies show evidence of starburst or post starburst activity, and are now thought to harbour the majority of star formation at z 1.

2.2 GRB 980326
Optical observations were performed with the 2.2-m CAHA telescope (equipped with CAFOS). See Fig. 2. The resulting 2700-s co-added image revealed an object (2.6 confidence level), consistent with the position of the optical counterpart discovered by Groot et al. (1998). We derive R = 22.8 0.7, in agreement with the measurements obtained by other authors.
If we introduce a host galaxy with R as initially proposed by Djorgovski et al. (1998), then we obtain with (point-dashed line in Fig. 2). The value of (the power-law exponent) is consistent with the one calculated by Groot et al. (1998) as .
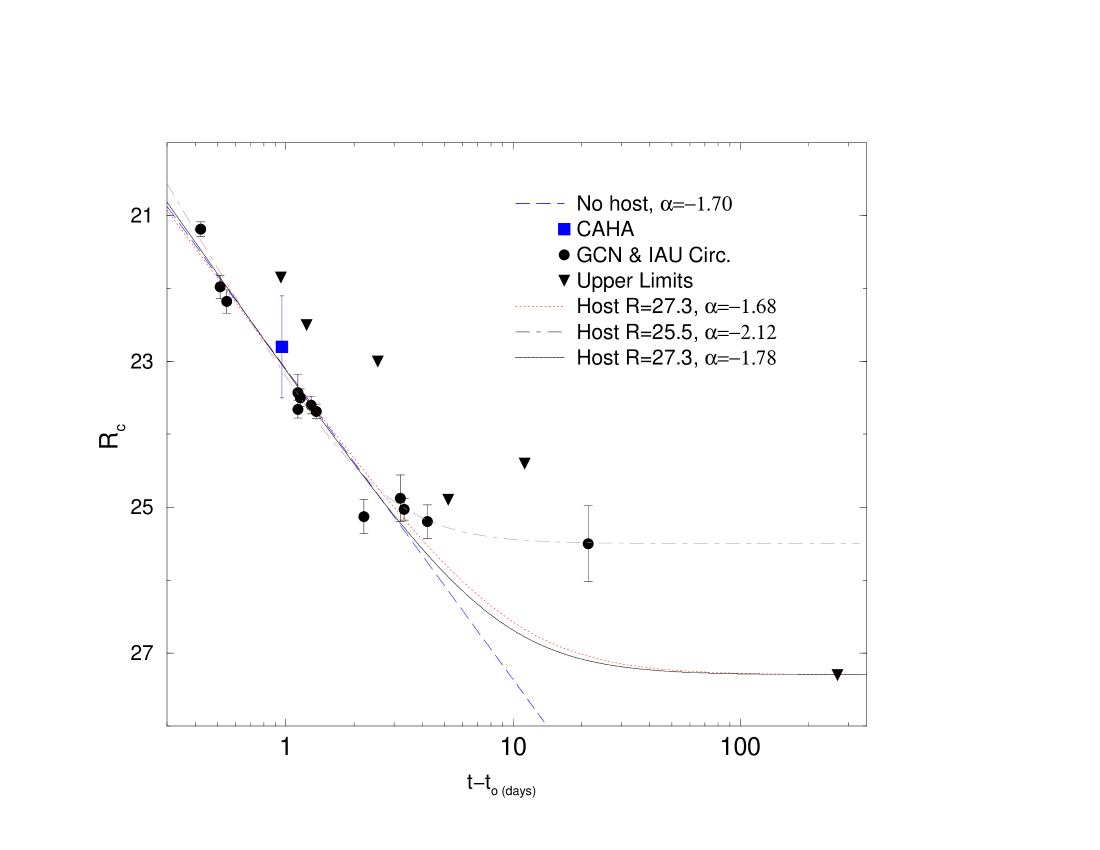
However, the recent upper limit of R 27.3 given for the GRB 980326 host galaxy (Bloom & Kulkarni 1998) implies with (long dashed line), instead of when considering a Rc = 25.5 host. In that case, the light curve can then be interpreted as a power-law decay plus an optical outburst occurring approximately 20 days post-burst, when Rc = 25.5 was measured for the optical transient at this date. This ′′secondary maximum′′ could be explained in the context of the ′′SN-like′′ light curves 2-3 weeks after the GRB, as recently suggested by Woosley (1999).
The value derived for the power-law decay exponent ( = -1.70 0.13) implies one of the fastest optical decay ever detected for a GRB. The existence of similar slopes in the GRB afterglow light curves could explain -at least in some cases- the non-detection of optical counterparts for many events, like GRB 970111, GRB 970616, GRB 970815 and GRB 970828.
Acknowledgements.
We are grateful to the entire BeppoSAX team for rapidly distributing the GRB positions, and to the Time Allocation Committees of the German-Spanish Calar Alto Observatorio and Observatorio del Teide (owned by the IAC). We also wish to thank the referee, L. Hanlon, for useful suggestions, and A. Bohm, K. J. Fricke, J. Greiner and K. Jäger for their help at some stage of this work.References
- (1) Bloom, J. et al. 1998a, GCN 30
- (2) Bloom, J. et al. 1998b, ApJ 507, L25
- (3) Bloom, J. & Kulkarni, S. R. 1998, GCN 161
- (4) Bond, H. 1997, IAUC 6654
- (5) Castro–Tirado et al. 1997, IAUC 6659
- (6) Castro–Tirado et al. 1998a, IAUC 6848
- (7) Castro–Tirado et al. 1998b, Sci 279, 1011
- (8) Castro–Tirado et al. 1999, A&SS, in press (astro-ph/9903187)
- (9) Djorgovski, G. et al. 1998, GCN 57
- (10) Galama, T. et al. 1998, ApJ 497, L13
- (11) Gorosabel, J. 1999, Ph.D. Thesis, Univ. of Valéncia
- (12) Groot et al. 1998, ApJ 502, L123
- (13) Guarnieri, A. et al. 1997, A&A 328, L13
- (14) Pedersen et al. 1998, ApJ 496, 311
- (15) Schechter, P. 1976, ApJ 203, 297
- (16) Woosley, S. 1999, A&AS, this issue
- (17) Zharikov, S. V. et al. 1998, A&A 337, 356