Two Galaxy Clusters: A3565 and A3560111Based on observations at Complejo Astronomico El Leoncito (CASLEO), operated under agreement between the Consejo Nacional de Investigaciones Científicas de la República Argentina and the National Universities of La Plata, Córdoba and San Juan; European Southern Observatory (ESO), partially under the ESO-ON agreement and Observatório do Pico dos Dias, operated by the Laboratório Nacional de Astrofísica (LNA).
Abstract
We report 102 new redshifts and magnitudes for a sample of galaxies to 15.5 in a 2.17∘ 2.17∘ region centered on the galaxy IC 4296, the most luminous member of the A3565 cluster. Up to the limiting magnitude we find 29 cluster members, and measure a velocity dispersion of = 228 kms-1 . The estimated total mass for this system is 3.0 1013 M⊙ (where = H0/100 km s-1Mpc-1), and its dynamical properties are quite typical of poor clusters presenting X-ray emission. We also find that galaxies with absorption lines are more concentrated towards the center of the cluster, while systems with emission lines are mainly located in the outer parts. The small velocity dispersion of the cluster, coupled to the known presence of an interacting pair of galaxies, and the large extent of the brightest cluster galaxy, could indicate that galaxy formation through mergers may still be underway in this system.
The surveyed region also contains galaxies belonging to the Shapley Concentration cluster A3560. Within 30 arc min of the cluster center, we detect 32 galaxies, for which we measure a velocity dispersion of 588 kms-1 and a mass of 2 1014 M⊙. However, because our sample is restricted to galaxies brighter than M∗, these values should be considered only as rough estimates.
1 Introduction
A region of the sky that presents a significant number of groups and clusters is the so called Centaurus Concentration (Lynden-Bell et al. 1989) which is a collection of about 20 groups and poor clusters which could be associated with the Great Attractor (Lynden-Bell et al. 1988). To date, only a few of these groups have been studied in detail (e.g., A3574 by Richter 1984; 1987; Willmer et al. 1991; and S753, Willmer et al. 1991; Jørgensen et al. 1995), being overshadowed by the much richer Shapley Concentration which lies in the background (e.g., Drinkwater et al. 1999; Bardelli et al. 1998; Ettori et al. 1997 and references therein).
Another reason for the paucity of studies of individual groups of galaxies in the region (as well as elsewhere) are the biases to which this kind of system is susceptible. In general, when analysing groups identified from the wide-angle redshift surveys (e.g., Huchra & Geller 1982; Maia et al. 1989; Nolthenius 1993; Garcia 1993; Ramella et al. 1999) one has to deal with two potential problems. The first is the variable limiting absolute magnitude of the group-finding algorithms (which is a function of redshift), so that typically only the brightest components are sampled. The second is the possibility that some of these groups are only chance projections along the line of sight rather than true physical associations, as only a few galaxies at most are assigned to the groups. The most effective means of overcoming these limitations is to probe the luminosity function of the groups to much fainter limits (e.g., Zabludoff & Mulchaey 1998a; Mulchaey & Zabludoff 1998a; Koranyi et al. 1998; Mahdavi et al. 1999), which allows not only establishing which galaxies are group members, but also ensures a more robust estimation of the group’s physical parameters (e.g., Zabludoff & Mulchaey 1998a).
In this work we present a redshift survey of a 4 square degrees region centered on IC 4296, which is the brightest galaxy of the cluster A3565, one of the groups belonging to the Centaurus Concentration. This cluster, located at R.A. 13h 33.8m and Dec. –33∘ 43′ (1950.0) is classified as a Richness 1 cluster by Abell et al. (1989), and as a BM type I cluster by Brown & Burns (1991). The group associated with IC 4296 was first identified by Sandage (1972), and has been included in the group catalogues of Huchra & Geller (1982) (containing 3 galaxies) and Garcia (1993) (where it has 13). Most of the works dealing with this group have concentrated on IC 4296, which is the optical counterpart of the low-luminosity radio-source PKS 1333-33 (Mills et al., 1960; Killeen & Bicknell 1988). This galaxy also presents X-ray emission which has been studied by Forman et al. (1985) using Einstein data, and more recently by Buote & Fabian (1998) using ASCA data. The diffuse X-ray emission of the cluster detected by ROSAT has been studied by Mulchaey et al. (1996). The properties of several of its brighter members were investigated in a series of papers by Kemp & Meaburn (1991, 1993) and Kemp (1994). This cluster has also been used by Lauer & Postman (1994) and Lauer et al. (1998) in the study of peculiar velocities in the local Universe, and to estimate the far field Hubble constant. In the latter work, Lauer et al. (1998) have estimated the distance of IC 4296, the brightest cluster galaxy, as 3220 kms-1.
The region surveyed in this work also includes A3560 (13h29.0m, –32∘ 58′, 1950.0, Abell et al. 1989), who classified it as an irregular system of richness class 3, and estimated its redshift as 3270 kms-1, the central position corresponding to that of the galaxy NGC 5193. In the analysis of the Shapley Concentration, Vettolani et al. (1990) noted that NGC 5193 and NGC 5193A are actually galaxies in the foreground of the cluster CE1329-327 identified by Melnick & Moles (1987), the center of which is 14′ off (mostly in Declination ) from the Abell et al. (1989) position. From the measurement of ten spectra Melnick & Moles (1987) found that 14850 kms-1, which places A3560 in the Shapley Concentration. That A3560 is a background cluster was also noted by Mould et al. (1991), though in their work they retain the name of A3560 to identify a foreground group (which contains some galaxies of A3565). Lauer et al. (1998) also refer to the distribution of galaxies at 3800 kms-1 centered on NGC 5193 as A3560. In this work we will assume that both NGC 5193 and NGC 5193A are part of A3565, and follow Vettolani et al. (1990) by calling A3560 the cluster in the Shapley Concentration. Other works dealing with this system have been Gregorini et al. (1994), who detected radio emission and showed that its peak originates from a position close to a dumbbell galaxy in the cluster; and Ebeling et al. (1996), Pierre et al. (1994) and Ettori et al. (1997), who analyse the X-ray emission detected by ROSAT.
This paper is organized as follows: the acquisition and observations of the galaxy sample are described in Section 2, followed by the analyses in Section 3. A summary of the main results follows in Section 4.
2 The Sample
2.1 Acquisition, Astrometry and Photometry
The sample of galaxies was defined from scans of an on-film copy of the ESO/Uppsala survey field 383 in the band (IIIaF emulsion + GG630 filter, Lauberts & Valentijn 1989, hereafter ESO–LV) using the Observatório Nacional PDS 1010A microdensitometer. A square slit of 20 size was used, corresponding to 1.35′′ 1.35′′ projected on the sky, about 0.25 0.25 kpc at the cluster distance, where = /100 kms-1 Mpc-1. We scanned an area of 2.17∘ 2.17∘ (1.4 Mpc 1.4 Mpc) centered close to the position of IC 4296. The scanned area was divided into a mosaic of 9 scans each of 2000 2000 pixels, with 100 pixels overlap between contiguous scans. This was done to minimize possible variations of the instrument focus due to the fact that we were not scanning a plate, while the overlap ensured that few objects on the border between scans, if any, would be lost, and would also allow a verification of the photometric stability. The scans were transformed into intensities in a procedure entirely analogous to that of Marston (1988) where the characteristic curve is derived comparing the surface brightness profiles of galaxies measured from the scans and CCD photometry. After the transformation into intensities, the scans were processed with FOCAS (Jarvis & Tyson 1981; Valdes 1982), and a possible candidate object was considered whenever it contained more than 9 contiguous pixels above the threshold, which we took as being 3 above the sky level. Objects in common to one or more scans were later used to shift the scans into the same instrumental magnitude system (e.g., Maddox et al. 1990).
The astrometric solution for each of the 9 individual scans was obtained independently. The first step was to identify in the object catalogue stars contained in the HST Guide Star Catalogue (Lasker et al. 1990, hereafter HSTGC). The positions of these stars were redetermined following the procedure of Assafin et al. (1997), using the PPM (Röser & Bastian 1991) and ACRS (Corbin & Urban 1988) catalogues. Basically, we selected PPM and ACRS stars in a 2∘ wide region centered on the individual scan, which were used to refine the HSTGC star positions, therefore defining the secondary reference frame with a rms error of 0.5′′. The secondary frame was then used to transform the scan and positions into right ascension and declination. We estimate that positional uncertainties should be smaller than 1′′.
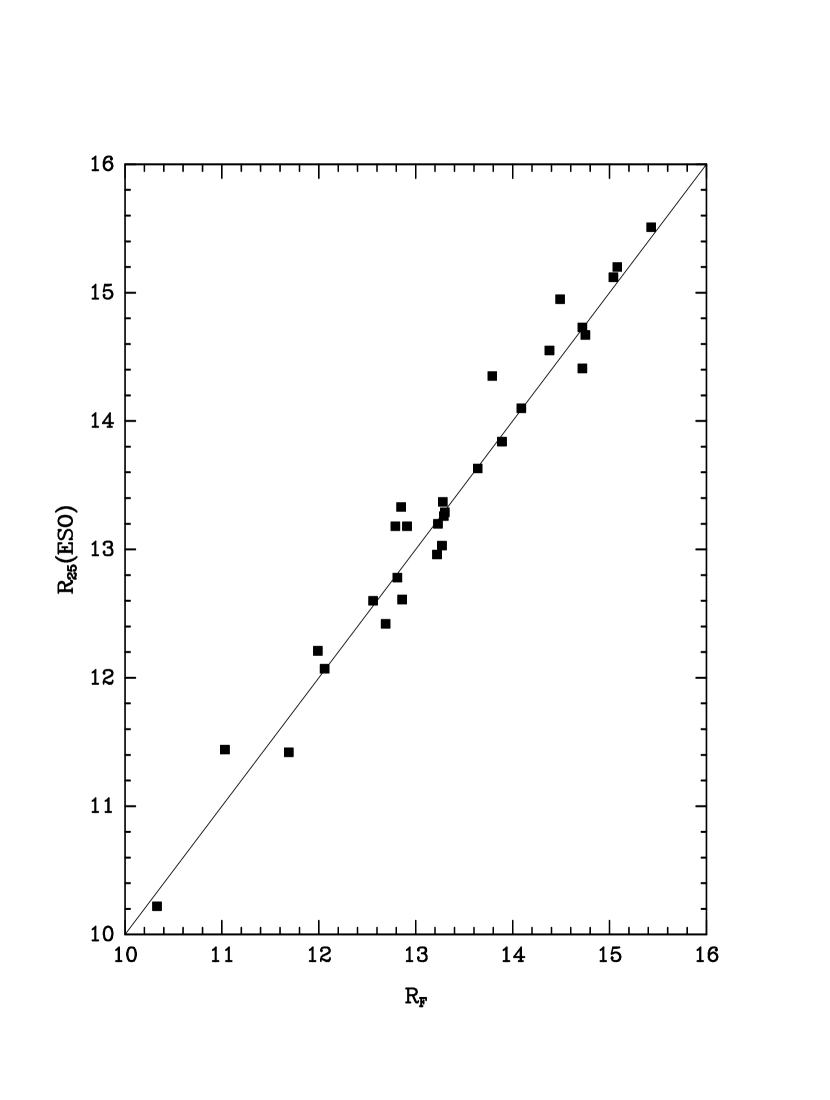
The calibration used CCD photometry for 15 galaxies obtained during two observing runs at the LNA, the details of which are described in Table 1. The magnitudes were measured at three different isophotal levels, as described by Alonso et al. (1993). The calibrating galaxies are presented in Table 2 which shows in column (1) the galaxy identification used in this work, followed in column (2) by the previous identification when known; the magnitudes and errors for each of the surface brightness levels 24, 25 and 26 are presented in columns (3), (4) and (5), and column (6) identifies the observing run described in Table 1. The magnitudes used in our catalogue, which we will denominate , were obtained through a linear fit between the and the instrumental photographic magnitudes. An estimate of the uncertainty of our magnitudes was obtained by comparing our measurements with of the ESO-LV catalogue for 25 galaxies in common. The comparison presented in Figure 1 shows that there is a mean difference – = –0.05 0.24 . For the 18 galaxies we have in common with Drinkwater et al. (1999) we find – = 0.11 0.25 . Both comparisons suggest that our magnitudes have an average probable uncertainty of 0.18 if the errors are similar for each of the data sets.
The final catalog used to define the spectroscopic observations was limited at = 15.5 before making reddening corrections. In the analyses in Section 3, galaxy magnitudes were corrected for extinction using the DIRBE–IRAS maps of Schlegel et al. (1998) interpolated for the position of each galaxy, where we have assumed that = . In general the average reddening in the band for this region is 0.15 .
2.2 Spectroscopy
The spectroscopic data used in this work were obtained at different telescopes, which are summarized in Table 3, where we identify the site (column 1), the telescope size (column 2), while the detector is identified in column (3) and its size in column (4); column (5) shows the grating rule, followed by the dispersion (column 6), resolution (column 7) and wavelength coverage (column 8). The data were reduced in exactly the same manner as the SSRS2 data (da Costa et al. 1998), following the usual procedures of removing bias images, correcting by flatfield and making illumination corrections (e.g., Massey 1992), all within IRAF222IRAF is distributed by the National Optical Astronomy Observatories (NOAO) which is operated by the Association of Universities for Research in Astronomy, Inc. under contract to the U. S. National Science Foundation. Radial velocities were measured using the RVSAO package (Kurtz et al. 1992; Kurtz & Mink 1998). In addition to the standard templates supplied with RVSAO, we used composite spectra of stars of various spectral types, a composite spectrum of galaxies measured for the SSRS (da Costa et al. 1989), and high signal-to-noise spectra of NGC 7507 and M31, the latter kindly supplied by V. de Lapparent and C. Bellanger. As in the case of the SSRS2 data (da Costa et al. 1998), which shared the same instrumental setups of the majority of observing runs reported herein, and was processed with the same software, the estimated velocity error for most spectra should be of the order of 40 kms-1 . An independent assessement of these errors can be made by comparing redshifts for 18 galaxies in common with Drinkwater et al. (1999), where we find a mean difference – = 40 87 kms-1 . This result implies in 61 kms-1 uncertainty if both data sets have comparable errors, while if we consider the average uncertainty quoted by Drinkwater et al. (1999) for their measurements (67 kms-1 ) this implies in an uncertainty of 55 kms-1 for our radial velocities. There are 6 galaxies in common with Quintana et al. (1995) for which we also measured radial velocities. We find a mean difference of – = 125 83 kms-1 . The origin of this fairly large offset is unclear.
The final sample of galaxies is presented in Table 4 333An electronic version of this table is available at where we give in column (1) our object identification; in column (2) the previous identification obtained by matching galaxy positions with objects in the NED database, and for a few cases with the HSTGC, the original reference being identified in the footnotes; the right ascension and declination for epoch B1950.0 in columns (3) and (4) respectively and the magnitudes in column (5). A rough morphological classification is shown in column (6), in a system consistent with that of da Costa et al. (1998), where T= –5 corresponds to ellipticals; –2 to S0s; 0 to S0/a; 5 to spirals in general; 16 to peculiar morphologies; 22 to dwarfs and 33 to galaxies with superposed stars. We should note that for fainter galaxies these classifications are uncertain because of the small apparent sizes. This is followed in column (7) by the heliocentric radial velocity; the estimated internal error (column 8); the number of emission lines used in the redshift determination (column 9) and the source code for the radial velocity (column 10), where s1, s2, etc. refer to the run number in Table 3, or the references shown in the table notes. In the table we have included all galaxies identified in this region to about 16.4 . A total of 166 new observations are reported in this work, including the outer region discussed in Appendix A.
3 Analysis
3.1 Distribution of Galaxies
The sample of galaxies brighter than = 15.5 considered in this work is shown in Figure 2, where the symbols represent galaxies in different redshift intervals, as noted in the caption, while the symbol size is a function of the object magnitude. The most prominent features in this plot are A3560 at approximately 13h 30m and –32∘ 50′, at the upper right, and A3565 at 13h 33m –33∘ 40′, close to the center of the surveyed region. To the adopted magnitude limit, there are 111 galaxies, of which 110 (99%) have measured radial velocities. The distribution in radial velocities bins of 250 kms-1 is shown in Figure 3, where all velocities were corrected for galactic rotation through . The two main peaks correspond to A3565 at 3600 kms-1 and galaxies associated with A3560 and the Shapley Concentration at 15000 kms-1. The smaller peak at 7000 kms-1 is due to a group of 3 galaxies close to the position of IC 4296, plus a few other galaxies distributed over the whole field. This loose distribution of galaxies at 7000 kms-1 has also been detected by Drinkwater et al. (1999). In contrast, the structure at 11000 kms-1 found by those authors in the foreground of the Shapley Concentration is not very prominent in our sample; an inspection of their redshift maps suggests that most of the galaxies in that structure are located to the south of our survey.
3.2 A3565
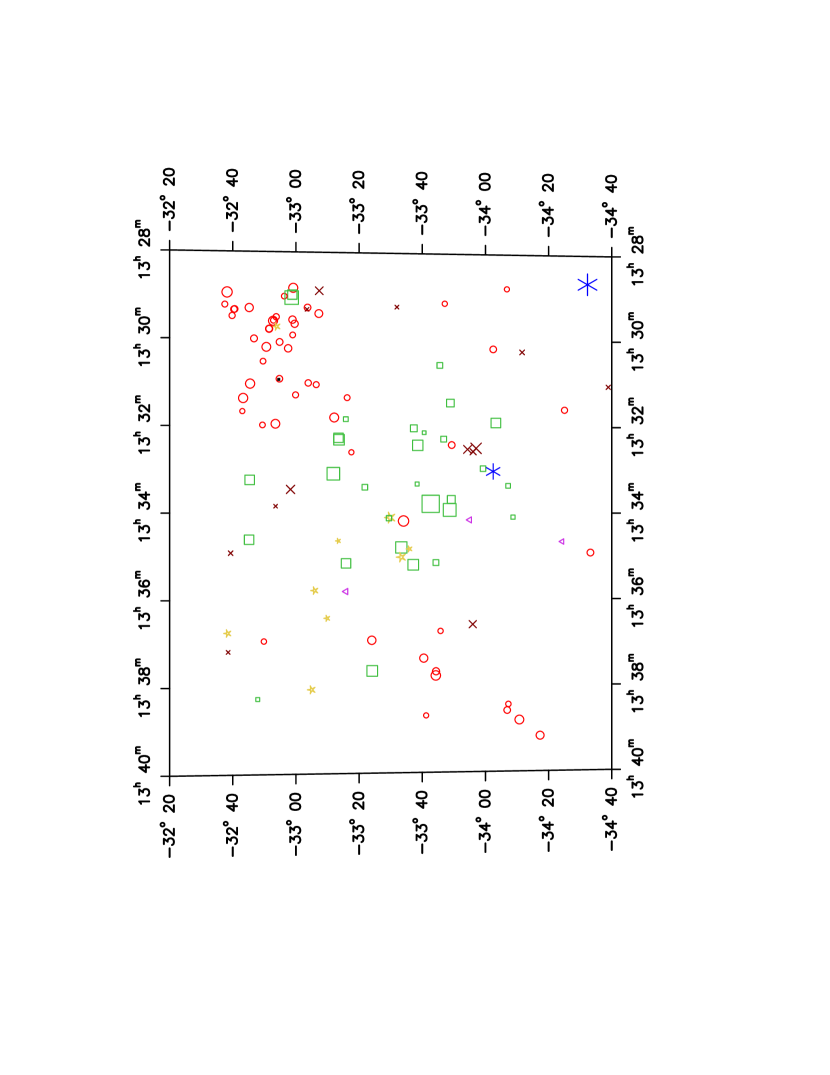
The peak corresponding to A3565 in Figure 3 contains 30 galaxies which are well separated in velocity space from the foreground galaxies at 2000 kms-1 and the background at 7000 kms-1. Because the surveyed area is rather small ( Mpc), it is possible that some outlying galaxies are being lost (e.g., Mahdavi et al. 1999). This in fact is suggested when comparing the present catalogue with that derived by Garcia (1993) using the LEDA database (Paturel et al. 1991), which contains three galaxies beyond the survey boundaries. However, in order to keep our sample homogeneous and well defined, we have not considered in the analysis these possible member galaxies. In this work we will consider as group members only those galaxies that are within the surveyed area and with radial velocities within 3 of the cluster mean (Yahil & Vidal 1977), where is the cluster velocity dispersion uncorrected for velocity errors. This eliminates WMMA 219 (=4494 kms-1 ) from the sample. The spatial distribution of likely member galaxies of A3565 is shown in Figure 4, where again we have coded the symbol size as a function of the apparent magnitude of the galaxy, while crosses represent galaxies with emission lines in the spectra, and open squares galaxies only presenting absorption line spectra.
In Table 5 we present the dynamical properties of A3565, most of which were calculated using the “classical estimators” (mean radial velocity, velocity dispersion and mass), while the cluster centroid was estimated using an unweighted average. The velocity dispersion and errors were derived following Danese et al. (1980), where the radial velocity uncertainty is accounted for, while for the other parameters we used the “jacknife” technique (e.g., Bothun et al. 1983). In the table we also show the values of the central location and scale estimates calculated using ROSTAT (Beers et al. 1990), the errors for the latter being estimated by means of 1000 bootstrap simulations. As may be seen in the table, the values of both classical and robust estimators agree very well. All these parameters were calculated without weighting by luminosity. The mean harmonic radius (Rh), the mean pairwise separation (Rp) and the virial mass (MVT) were calculated using the expressions of Ramella, Geller & Huchra (1989). The uncertainty for the latter was estimated using standard error propagation, which takes into account the uncertainty in and the jacknife error for Rh . We also calculate the projected mass (Mp) which is an estimator proposed by Heisler, Tremaine & Bahcall (1985) that is less sensitive to the presence of interlopers. Both MVT and Mp were shown by West, Oemler & Dekel (1988) to give reliable measures of the cluster mass.
The velocity dispersion of A3565 (228 kms-1 ) is marginally higher than the typical value for groups of galaxies 194 kms-1 (Ramella et al. 1999), yet in the lower range of velocity dispersions measured by Zabludoff & Mulchaey (1998a) in their sample of 12 poor clusters with X-ray emission. The mass derived from the Virial Theorem in addition to the projected mass estimator by Heisler et al. (1985) are in good agreement, giving a mass of the order of 3 1013 M⊙. The uncertainties for MVT are of the order of 30%, a value which is consistent with that measured for simulated clusters by West et al. (1988). The estimated uncertainty measured for Mp is probably too small, as the latter authors found that it presents comparable errors to those of MVT.
The dynamics of A3565 is significantly influenced by the presence of IC 4296, which, although not classified as a cD, does present an extended profile quantified by a value of n=11.8 for a Sersic law (Graham et al. 1996). Such flat profiles were noted by those authors as being typical of Brightest Cluster Galaxies. The large extent of this galaxy was also noted by Saglia et al. (1993) who presented the velocity dispersion profile out to a distance of 0.8 Re which corresponds to 45′′ or 7.7 kpc. The internal velocity dispersion profile of this galaxy is greater than 200 kms-1 and has a rather flat appearance, indicating the presence of a massive dark halo (Saglia et al. 1993).
The velocity histogram of group members (corrected to the Local Group Centroid) is shown in Figure 5 where the dashed line indicates the radial velocity of IC 4296 ( = 3593 kms-1 ). This is almost identical to the value of the bi-weight estimate for the central location velocity of the cluster (3586 kms-1 ). This result differs from the conclusion of Kemp (1994), who found that a difference of 150 kms-1 between IC 4296 and the group’s mean radial velocity, though the reason for this discrepancy is unclear. The projected separation of IC 4296 to the group’s centroid about 0.14 Mpc. In order to check whether this could be due to the presence of interlopers at large angular separations, we also determined the dynamical parameters in the case where only galaxies within a radius of 0.5∘ (0.31 Mpc) from IC 4296 were considered. This radius excludes galaxies such as NGC 5193 and NGC 5193A which, as mentioned in the Introduction, have been assigned to another system by Abell et al. (1989) and Lauer et al. (1998). This smaller sample contains 21 galaxies, and reduces the projected separation between the group center and IC 4296 to 0.07 Mpc, while the radial velocity difference is slightly larger, increasing from 7 kms-1 to 39 kms-1 , still within the measurement errors. The velocity dispersion for this smaller sample also changes slightly (234 kms-1 ). The mass estimators are 10% smaller (MVT = 2.6 M⊙ ; Mp = 3.0 M⊙), but still within the errors estimated from the larger sample, suggesting that the larger sample probably contains no interlopers.
The spatial segregation between galaxies presenting emission lines (crosses), comprising 34% of the sample (10 galaxies), from the 19 (66%) galaxies that only present absorption line spectra (open squares), can be seen in Figure 4. The latter tend to be found in the central regions of the cluster, while emission line galaxies are predominant in the outer regions, a feature which is common in rich clusters, but only recently shown to occur also in poor clusters (Zabludoff & Mulchaey 1998a; Mahdavi et al. 1999). The observed segregation may be quantified through Rh and Rp which for the absorption line galaxies are Rh=0.280.02 Mpc, and Rp=0.470.04 Mpc, while for the emission line systems these are Rh = 0.67 0.03 Mpc and Rp = 0.66 0.10 Mpc, which are a factor of 2 larger than for the absorption line systems. For the entire sample the values are Rh = 0.40 0.01 Mpc and Rp = 0.57 0.03 Mpc. By running a two-sample Kolmogorov-Smirnov test on the projeted distances of galaxies from the cluster center we find that the probability of both samples being drawn from the same parent population is at the 4% level; a similar result ( 3.6%) is obtained from Monte-Carlo simulations where the galaxy distances from the cluster center were bootstrapped. On the other hand the cluster velocity dispersion measured using either type of galaxy is to all effects identical. For the 19 absorption line systems we find 231 (+51, –32) kms-1 using the classical estimator, and 242 42 kms-1 using the bi-weight ROSTAT estimator, while for the 10 emission line systems these are 232 (+82, –41) kms-1 and 235 66, respectively. The values for both galaxy populations are very similar to the velocity dispersion of the entire sample 228 (+38, –26)kms-1 and 236 69 kms-1 .
The distribution of absolute magnitudes is presented in Figure 6, where galaxies are counted in 0.5 magnitude bins. The faintest absolute magnitude that can be reached with this sample is 3 magnitudes fainter than the value of M (–20.29 0.02 + 5 log , Lin et al. 1996). In the figure we may see a dip in the absolute magnitude distribution at –19. This is at a similar value to that found by Koranyi et al. (1998) in AWM 7 as well as in other systems, and which could be a common feature to rich clusters, due to a depletion of galaxies as a result of mergers (Koranyi et al. 1998). However, because of the small number of galaxies in A3565, we cannot consider this feature as being significant as it could be just a fluctuation due to small number statistics.
In the study of groups and poor clusters presenting diffuse X-ray emission detected by ROSAT, Mulchaey et al. (1996) present in their Figure 4 the X-ray contours overlaid on a Digital Sky Survey map covering a 1∘ 1∘ region centered on IC 4296. There one can see that the X-ray emission is not centered on IC 4296, but presents a peak between IC 4296 and IC 4299, having a rather irregular shape aligned NE-SW. By fitting a modified King model
| (1) |
to the counts, Mulchaey et al. (1996) measured = 0.46 and a temperature = 1.07 keV. In their model, Mulchaey et al. (1996) considered the gas profile out to a maximum extent of 21.5 arc min or 0.23 Mpc from IC 4296, where the gas reaches 20% of the background level. The mass estimated from the X-ray model is of the order of 1.17 1013 M⊙, which is about a factor of 3 smaller than the mass we derive from the galaxy distribution. By extrapolating the model of Mulchaey et al. (1996) out to the value of the harmonic radius measured in this work we find that the mass estimate (1.57 1013 ) is still only about a half of the total mass obtained from the virial and projected mass estimators.
As noted above, IC 4296 has an internal velocity dispersion 200 kms-1 , which reaches up to 300 kms-1 in its central regions (Wegner et al. 1999; Kemp 1994). This value is comparable to the velocity dispersion of A3565, and it is interesting to note that of the sample of 12 clusters studied by Zabludoff & Mulchaey (1998a), only 2 present a similar feature, although the significance of this result is unclear. The high value of the velocity dispersion could imply that at least some of the X-ray emiting gas is more influenced by the galaxy rather than the cluster (e.g., David & Blumenthal 1992). The scenario where gas is bound by the central galaxy as well as by the cluster potential is consistent with the conclusions of Mulchaey & Zabludoff (1998a), who obtained better fits to the observed X-ray distribution when a two-component model was considered: one component would be due to the central galaxy and the second component due to the diffuse gas. Such a scenario was considered by Mulchaey et al. (1996), to explain the rather low value of they measured for A3565.
3.3 A3560
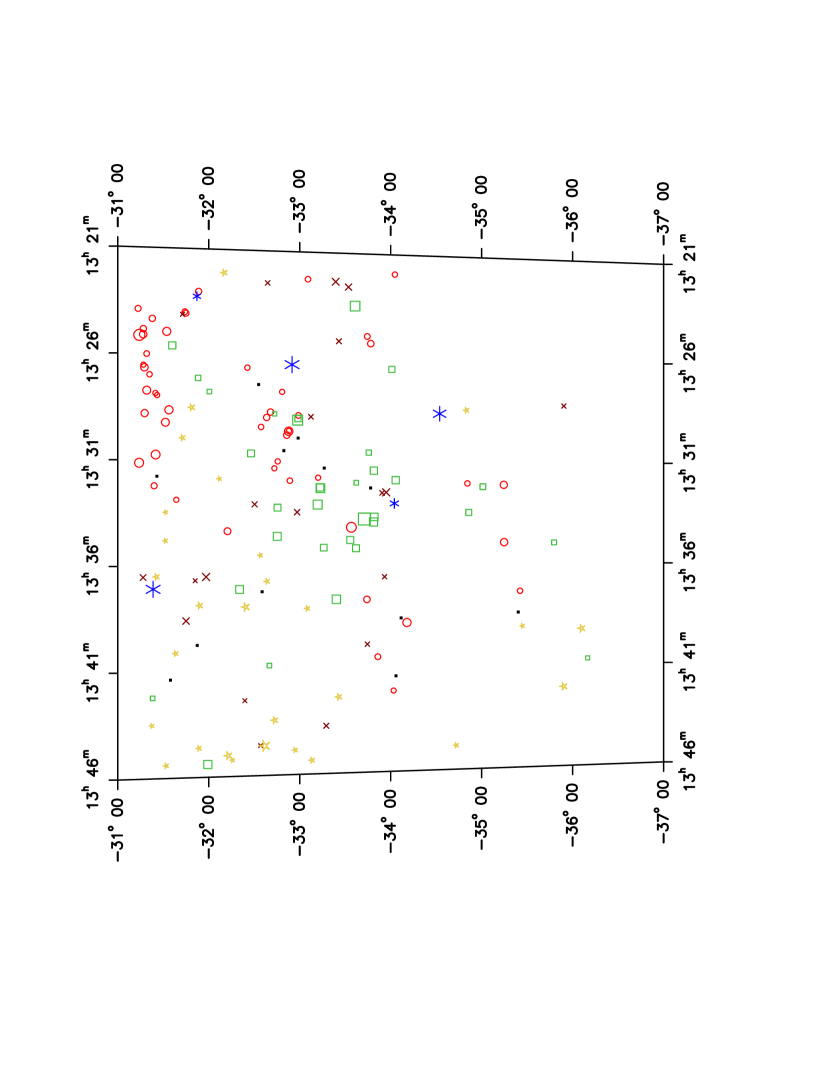
In Figure 7 we show the distribution of galaxies with radial velocities between 13000 kms-1 16000 kms-1, which roughly corresponds to the redshift interval of the Shapley Concentration. In addition to A3560 there is a dispersed distribution of galaxies which belong to the Shapley Supercluster, but are not part of the cluster. Even though A3560 is close to the NW border of the surveyed region, enough galaxies are contained in the survey that an estimate of the dynamical parameters of the cluster is possible. In this analysis we will consider the galaxies within the range of 13h 28 13h 33m and -32∘ 35 -33∘ 20′′ as likely members. Within these limits and the radial velocity range above, there are 33 galaxies. Their distribution seen in Figure 7 suggests that A3560 could be composed of two concentrations of galaxies. This is also suggested by the histogram of radial velocities in Figure 8, where two velocity peaks are seen: one at 13600 kms-1 and the other at 14800 kms-1. In order to confirm whether both the spatial and redshift distribution could be due to subclustering, we applied the statistical tests described by Pinkney et al. (1996) to the sample. Only the Lee 2-D and Lee 3-D statistics detect any significant level of subclustering. The Dressler & Shectman (1988) statistic in particular, which is the most sensitive test (Pinkney et al. 1996), detects no significant evidence of subclustering. Therefore, in the determination of the physical parameters for A3560, shown in the last column of Table 5, we will assume that there is no subclustering. In the analysis that follows we also applied the 3 clipping algorith (Yahil & Vidal 1977), which removes one galaxy from the sample (WMMA 076, = 13361 kms-1 ).
The velocity dispersion we measure for this cluster, (588 kms-1) is smaller than that measured by Melnick & Moles (1987), 838 kms-1 which was based on 10 galaxies. Our mass estimate using the Virial Theorem ( 2 1014 M⊙) is close to the value estimated by Ettori et al. (1997) from X-ray data ( 2.3 1014 M⊙). The projected mass is a factor of 2 larger than the Virial estimator, and this could be due to the combination of the small sample size with a somewhat complex distribution of galaxies, which is seen not only in the optical data, but also in the X-ray maps for this cluster of Pierre et al. (1994). As may be seen in their Figure 6, there are four X-ray peaks in the direction of A3560, and excepting for the most extended source, they are not well correlated with the distribution of galaxies down to the limiting magnitude used in this work.
We should note that the centroid we determine here for A3560 differs from the position of Melnick & Moles (1987), probably because of the larger range in right ascension we are considering. The range used here corresponds to 1.6 Mpc at the mean cluster distance. The centroid in Table 5 is about 0.13∘ , or 0.32 Mpc away from the position of galaxies WMMA 032 and WMMA 033 in Table 4, which form a dumbbell system (Gregorini et al. 1994). The fact that this type of system is typically found in the central regions of clusters (Valentijn & Casertano 1988), suggests that the centroid of A3560 may be close to this position. Further support for this interpretation is the presence of the main component of the diffuse X-ray emission detected by Pierre et al. (1994) which also peaks close to the position of the dumbbell galaxy. In particular, if one considers the sample of galaxies to =16.0 , which has 80% radial velocity completeness, the distribution of galaxies with redshifts centered on the dumbbell becomes much more pronounced. Furthermore, the fact that the mass-to-light ratio is large ( 760 (M/LR)⊙) is also suggestive that the cluster membership as considered in this work is uncertain. All these results suggest that our conclusions regarding A3560 should only be considered as preliminary, since a larger and fainter sample will be required to describe more accurately the distribution of galaxies in this region.
The radial velocities of the dumbbell components differ by 10 kms-1 , while their projected separation is of the order of 9 kpc. Both values are somewhat smaller that the typical values for this kind of system quoted by Valentijn & Casertano (1988). Both nuclei have absorption line spectra, neither presenting any significant evidence of having undergone recent episodes of star formation. The mean radial velocity of these systems is shown in Figure 8 as a dotted line, which is about 60 kms-1 away from the mean radial velocity of the group in Table 5.
4 Conclusions
In this paper we have presented the redshift survey of a 2.17∘ 2.17∘ region centered on the galaxy IC 4296, which is the brightest galaxy in the A3565 cluster. The present work extends the coverage of galaxies of A3565 to a limit of + 3, within a radius of 0.7 Mpc. Both the radial extent and the number of members for this cluster are comparable to what was found for similar systems by Zabludoff & Mulchaey (1998a) and Mulchaey & Zabludoff (1998a) in their study of the optical and X-ray properties of 12 poor clusters of galaxies. The velocity dispersion, as well as the mass we measure for A3565 are within the range of values quoted in those works, and A3565 has dynamical properties typical of X-ray emitting poor clusters.
This cluster contains galaxies undergoing interactions (NGC 5215A and NGC 5215B; Kemp & Meaburn 1991), and with common haloes (IC 4296 and IC 4299; Kemp 1994). This evidence coupled to the small value of the velocity dispersion of the system suggests that bright galaxies could still be forming in A3565 through mergers. Such a scenario has been suggested in recent works by Mulchaey & Zabludoff (1998b) and Zabludoff & Mulchaey (1998b) who find that the brightest galaxies in groups as well as the groups themselves could still be forming through the accretion of smaller systems, and that the merger rate is most efficient in groups with 200 kms-1 , which is the case of A3565.
As in other poor clusters with diffuse X-ray emission, (e.g., Zabludoff & Mulchaey 1998a; Mahdavi et al. 1999), A3565 also shows radial segregation between galaxies presenting emission lines, mainly found in the outer parts of the cluster, while absorption line systems are concentrated towards the cluster center. This radial segregation together with the bending of the radio jets of IC 4296 noted by Killeen & Bicknell (1988), and the presence of several galaxies with distorted morphologies (Kemp & Meaburn 1993), suggest that the Intergalactic Medium of A3565 could also play an important role in the dynamical evolution of this system.
We also measured redshifts of galaxies belonging to the A3560 cluster, a background system that belongs to the Shapley Concentration. Although the velocity dispersion we measure for A3560 ( 580 kms-1 ) is typical of rich galaxy clusters, our results for this cluster should only be taken as preliminary. This is suggested by the relatively bright limiting absolute magnitude of our work at the distance of A3560 (M M); the relatively complex distribution of galaxies and X-ray emission; the discrepancies between the mass estimators, and the large M/L ratio we measure. Therefore, to characterize the membership and dynamics of this cluster, a larger and fainter sample will be needed.
Appendix A Additional Galaxies
A more extensive though shallower survey in a larger (5∘ 5∘ ) region in the general direction of A3565 shows no significant increase in the number of cluster members. A further 51 galaxies were observed, and are listed in Table 6 where column (1) shows the HSTGC identification, and in column (2) other identifications if known; columns (3) and (4) the right ascension and declination for epoch B1950.0 followed by the new radial velocity and the internal estimated error, respectively in columns (5) and (6). In this table we also include three serendipitous objects that were observed in the course of the survey, which are noted in the table. The coordinates for these three objects were estimated from the DSS. Because most objects in Table 6 were defined from a blue selected sample with 15.5 , where is the blue magnitude at the 26 (Alonso et al. 1993; da Costa et al. 1998), we did not include them in the analysis of the group. However, the distribution of galaxies may be seen in Figure 9, where we code galaxies in different redshift intervals as in Figure 4. The main feature to note is that very few galaxies in the redshift interval of A3565 are added in the outskirts of the cluster.
References
- (1)
- (2) Abell, G. O., Corwin, H.G., & Olowin, R.P. 1989, ApJS, 70, 1
- (3)
- (4) Alonso, M. V., da Costa, L. N., Pellegrini, P. S. & Kurtz, M. J. 1993, AJ 106, 676
- (5)
- (6) Arp H. C., & Madore, B. F. 1987, “A Catalogue of Southern Peculiar Galaxies and Associations”, (Cambridge: Cambridge Univ. Press) (AM)
- (7)
- (8) Assafin, M., , Martins, R. Vieira, & Andrei, A. H. 1997, AJ, 113, 1451
- (9)
- (10) Bardelli, S., Pisani, A., Ramella, M., Zucca, E., & Zamorani, G. 1998, MNRAS 300, 589
- (11)
- (12) Beers, T. C., Flynn, K. & Gebhardt, K. 1990, AJ, 100, 32
- (13)
- (14) Bothun, G., Geller, M. J., Beers, T. C. & Huchra, J. P. 1983, ApJ 268, 47
- (15)
- (16) Brown, D., L., & Burns, J. O. 1991, AJ, 102, 1917
- (17)
- (18) Buote, D. A., & Fabian, A. C., 1998, MNRAS, 296, 977
- (19)
- (20) Buta, R. 1995, ApJS, 96, 39 (CSRG)
- (21)
- (22) Corbin, T. & Urban, S. 1988, in I.A.U. Symp. No. 133, “Mapping the Sky”, ed. H. Eichhorn (Dordrecht: Reidel), 75
- (23)
- (24) Coté, S., Freeman, K. C., Carignan, C., & Quinn, P. J. 1997, AJ, 114, 1313
- (25)
- (26) da Costa, L.N., Pellegrini, P.S., Nunes, M.A., Willmer, C., Chincarini, G., & Cowan, J. 1986, AJ, 91, 6 (DC1)
- (27)
- (28) da Costa, L.N., Pellegrini, P. S., Willmer, C., de Carvalho, R., Maia, M., Latham, D. W. & Geary, J. C. 1989, AJ, 97, 315
- (29)
- (30) da Costa, L.N., Willmer, C. N. A., Pellegrini, P.S., Chaves, O. L., Rité, C., Maia, M. A. G., Geller, M. J., Latham, D. W., Kurtz, M. J., Huchra, J. P., Ramella, M., Fairall, A. P., Smith, C., & Lípari, S. 1998, AJ, 116, 1
- (31)
- (32) da Costa, L.N., Willmer, C., Pellegrini, P.S., & Chincarini, G. 1987, AJ, 93, 1338 (DC2)
- (33)
- (34) David, L. P., & Blumenthal, G. R. 1992, ApJ 389, 510
- (35)
- (36) Danese, L., De Zotti, G., & di Tullio, G. 1980, A&A, 82, 322
- (37)
- (38) Dressler, A., & Shectman, S. A. 1988, AJ, 95, 985
- (39)
- (40) Drinkwater, M. J., Proust, D., Parker, Q. A., Quintana, H., & Slezak, E. 1999, PASAu, in press; astro-ph/9903028
- (41)
- (42) Ebeling, H., Voges, W., Böhringer, H., Edge, A. C., Huchra, J. P. & Briel, U. G. 1996, MNRAS, 281, 799
- (43)
- (44) Ettori, S., Fabian, A. C., & White, D. A. 1997, MNRAS, 289, 787
- (45)
- (46) Forman, W., Jones, C., & Tucker, W. 1985, ApJ, 293, 102
- (47)
- (48) Garcia, A. M. 1993, A&AS, 100, 47
- (49)
- (50) Graham, A. W., Lauer, T. D., Colless, M. & Postman, M. 1996, ApJ 465, 534
- (51)
- (52) Gregorini, L., de Ruiter, H. R., Parma, P., Sadler, E. M., Vettolani, G., & Ekers, R. D. 1994, A&AS, 106, 1
- (53)
- (54) Heisler, J., Tremaine, S., & Bahcall, J. N. 1985, ApJ, 298, 8
- (55)
- (56) Huchra, J. P., & Geller, M. G. 1982, ApJ, 257, 243
- (57)
- (58) Jarvis, J.F., & Tyson, J.A. 1981, AJ, 86, 476
- (59)
- (60) Jørgensen, I., Franx, M., & Kjaergaard, P. 1995, MNRAS 276, 1341
- (61)
- (62) Kemp, S. N. 1994, A&A, 282, 425
- (63)
- (64) Kemp, S. N., & Meaburn, J. 1991, MNRAS, 252, 27
- (65)
- (66) Kemp, S. N., & Meaburn, J. 1993, A&A, 274, 19
- (67)
- (68) Killeen, N. E. B., & Bicknell, G. V. 1988, ApJ, 324, 198
- (69)
- (70) Koranyi, D. M., Geller, M. J., Mohr, J. J., & Wegner, G. 1998, AJ, 116, 2108
- (71)
- (72) Kurtz, M. J. & Mink, D. J. 1998, PASP, 110, 934
- (73)
- (74) Kurtz, M. J., Mink, D. J., Wyatt, W. F., Fabricant, D. G., Torres, G., Kriss, G. A., & Tonry, J. L. 1992, in ASP Conf. Ser. Vol. 25, Proc. 1st Ann. Conf. Astronomical Data Analysis Software and Systems, ed., D.M. Worral, C. Biemesderfer, & J. Barnes (San Francisco: ASP), 432
- (75)
- (76) Lasker, B.M., Sturch, C.R., McLean, B.M., Russel, J.L., Jenker, H., & Shara, M. 1990, AJ, 99, 2019 (HSTGC)
- (77)
- (78) Lauberts, A., & Valentijn, E.A. 1989, The Surface Photometry Catalogue of the ESO-Uppsala Galaxies, (Garching: ESO) (ESO–LV)
- (79)
- (80) Lauer, T. R. & Postman, M. 1994, ApJ, 425, L418
- (81)
- (82) Lauer, T. R., Tonry, J. L., Postman, M., Ajhar, E. A. & Holtzman, J. A. 1998, ApJ 499, 577
- (83)
- (84) Lin, H., Kirshner, R. P., Schectman, S. A., Landy, S. D., Oemler, A., Tucker, D. L. & Schechter, P. L. 1996, ApJ, 471, 617
- (85)
- (86) Lynden-Bell, D., Faber, S.M., Burstein, D., Davies, R.L., Dressler, A., Terlevich, R.J., & Wegner, G. 1988, ApJ, 326, 19
- (87)
- (88) Lynden-Bell, D., Lahav, O., & Burstein, D. 1989, MNRAS, 241, 325
- (89)
- (90) Maia, M.A.G., da Costa, L.N., & Latham, D.W. 1989, ApJS, 69, 809
- (91)
- (92) Massey, P. 1992, A User’s Guide to CCD Reductions with IRAF (Tucson: KPNO Computer Support Group)
- (93)
- (94) Maddox, S. J., Efstathiou, G. & Sutherland, W. J. 1990, MNRAS 246, 433
- (95)
- (96) Mahdavi, A., Geller, M. J., Boehringer, H., Kurtz, M. J. & Ramella, M. 1999, astro-ph/9901095
- (97)
- (98) Marston, A. P. 1988, MNRAS, 230, 97
- (99)
- (100) Matthewson, D. S., Ford, V. L. & Buckhorn, M. 1992, ApJS, 81, 413
- (101)
- (102) Melnick, J. & Moles, M. 1987, RMxAA, 14, 72
- (103)
- (104) Metcalfe, N., Godwin, J. G., & Peach, J. V. 1994, MNRAS, 267, 431
- (105)
- (106) Mills, B. Y., Slee, O. B., Hill, E. R. 1960, Aust.J. Phys. 13, 676
- (107)
- (108) Mount Stromlo Abell Cluster Supernova Search Team, 1997, IAU Circular 6708A
- (109)
- (110) Mould, J. R., Staveley-Smith, L., Schommer, R. A., Bothun, G. D., Hall, P. J., Han, M. S., Huchra, J. P., Roth, J., Walsh, W., & Wright, A. E. 1991, ApJ, 383, 467
- (111)
- (112) Mulchaey, J. S., Davis, D. S., Mushotzky, R. F., & Burstein, D. 1996, ApJ, 456, 80
- (113)
- (114) Mulchaey J. S., & Zabludoff, A., I. 1998a, ApJ, 496, 73
- (115)
- (116) Mulchaey J. S., & Zabludoff, A., I. 1998b, astro-ph/9810458
- (117)
- (118) Nolthenius, R. 1993, ApJS, 85, 1
- (119)
- (120) Paturel, G., Petit, C., Kogoshvili, N., Dubois, P., Bottinelli, L., Fouque, P., Garnier, R. & Gouguenheim, P. 1991, A&AS, 91, 371
- (121)
- (122) Pierre, M., Böhringer, H., Ebeling, W., Vosges, W., Schuecker, P., Crudacce, R., & MacGillivray, H. 1994, A&A, 290, 725
- (123)
- (124) Pinkney, J., Roettinger, K, Burns, J. O., & Bird, C. M. 1996, ApJS 104, 1
- (125)
- (126) Postman, M. & Lauer, T. R., 1995, ApJ, 440, 28
- (127)
- (128) Quintana, H., Ramirez, A., Melnick, J., Raychaudhury, S., & Slezak, E. 1995 AJ 110, 463 (QRM)
- (129)
- (130) Ramella, M., et al. 1999, A&A, 342, 1
- (131)
- (132) Ramella, M., Geller, M. J., & Huchra, J. P. 1989, ApJ, 344, 57
- (133)
- (134) Richter, O. -G. 1984, A&AS, 58, 131
- (135)
- (136) Richter, O. -G. 1987, A&AS, 67, 261
- (137)
- (138) Röser, S., & Bastian, U. 1991, PPM Star Catalogue (Heidelberg: Spektrum Akademischer Verlag)
- (139)
- (140) Saglia, R. P., Bertin, G., Bertola, F. Danziger, J., Dejonghe, H., Sadler, E. M., Stiavelli, M., de Zeeuw, P. T., Zeilinger, W. W. 1993, ApJ 403, 567
- (141)
- (142) Sandage, A. 1972, ApJ, 178, 1
- (143)
- (144) Schlegel, D. J., Finkbeiner, D. P. & Davis, M., 1998, ApJ, 500, 525
- (145)
- (146) Theureau, 1998, A&AS, 130, 333 (T98)
- (147)
- (148) Valdes, F. 1982, Focas User’s Manual (2nd ed.; Tucson: KPNO Computer Support Group)
- (149)
- (150) Valentijn, E. A., & Casertano, S. 1988, A&A 206, 27
- (151)
- (152) Vettolani, G., Chincarini, G., Scaramella, R. & Zamorani, G. 1990, AJ, 99, 1709
- (153)
- (154) Wegner, G. et al. 1999, in preparation.
- (155)
- (156) West, M. J., Oemler, A., & Dekel, A. 1988, ApJ, 327, 1
- (157)
- (158) Willmer, C.N.A., Focardi, P., Chan, R., Pellegrini, P.S., & da Costa, L.N. 1991, AJ 101, 57
- (159)
- (160) Yahil, A., Vidal, N. V. 1977, ApJ, 214, 347
- (161)
- (162) Zabludoff, A., I., & Mulchaey, J., S. 1998a, ApJ, 496, 39
- (163)
- (164) Zabludoff, A., I., & Mulchaey, J., S. 1998b, ApJ, 498, 5
- (165)
| code | date | telescope | CCD | Format | Scale | Gain | RON |
|---|---|---|---|---|---|---|---|
| [] | [e-/ADU] | [e-] | |||||
| (1) | (2) | (3) | (4) | (5) | (6) | (7) | (8) |
| 1 | 1996 March 21 | 0.60 m | LNA#301 | 578 385 | 1.13 | 2.63 | 5.4 |
| 2 | 1997 May 2 | 1.60 m | LNA#48 | 770 1152 | 0.57 | 5.59 | 10.67 |
| WMMA Id. | Identification | Run | |||
|---|---|---|---|---|---|
| (1) | (2) | (3) | (4) | (5) | (6) |
| 008 | NGC 5193A, 383 G 14 | 12.98 0.22 | 13.05 0.18 | 13.11 0.13 | p1 |
| 011 | NGC 5193, 383 G 15 | 11.27 0.17 | 11.17 0.31 | 11.14 0.40 | p1 |
| 125 | 16.15 0.05 | 16.06 0.06 | 15.98 0.08 | p1 | |
| 126 | 383G37 | 13.24 0.05 | 13.16 0.06 | 13.11 0.07 | p1 |
| 135 | B133341.2-334911 | 14.01 0.05 | 13.97 0.05 | 13.93 0.06 | p1 |
| 137 | IC 4296, 383 G 39 | 10.24 0.05 | 10.08 0.06 | 9.93 0.06 | p1 |
| 141 | IC 4299, 383 G 42 | 12.18 0.05 | 12.16 0.05 | 12.13 0.05 | p1 |
| 159 | 383 G 45 | 12.48 0.05 | 12.43 0.05 | 12.38 0.05 | p1 |
| 171 | 383 G 49 | 13.11 0.06 | 12.84 0.06 | 12.57 0.06 | p2 |
| 192 | 383 G 55 | 14.40 0.06 | 14.22 0.06 | 14.03 0.06 | p2 |
| 204 | 15.89 0.06 | 15.74 0.06 | 15.58 0.06 | p2 | |
| 206 | B133737.8-334408 | 16.09 0.06 | 15.94 0.06 | 15.83 0.06 | p2 |
| 208 | 15.32 0.06 | 15.02 0.06 | 14.71 0.06 | p2 | |
| 209 | 14.53 0.06 | 14.32 0.06 | 14.11 0.06 | p2 | |
| 231 | 14.68 0.05 | 14.49 0.05 | 14.31 0.05 | p2 |
| code | date | telescope | CCD | Format | Grating | Dispersion | Resolution | coverage |
|---|---|---|---|---|---|---|---|---|
| [l/mm] | [] | [] | [] | |||||
| (1) | (2) | (3) | (4) | (5) | (6) | (7) | (8) | (9) |
| s1 | 1994 May | CASLEO 2.15m | EEV P8603S | 385 578 | 600 | 2.4 | 7.3 | 4650–6050 |
| s2 | 1994 Jul | CASLEO 2.15m | EEV P8603S | 385 578 | 300 | 4.7 | 14.0 | 4100–6800 |
| s3 | 1995 Mar | OPD 1.60m | EEV P8603A | 1156 770 | 900 | 1.2 | 3.1 | 4770–6135 |
| s4 | 1995 Apr | CASLEO 2.15m | Tek | 1024 1024 | 600 | 1.6 | 5.0 | 5100–6800 |
| s5 | 1997 Jan | ESO 1.52m | Loral | 2048 2048 | 600 | 1.7 | 4.3 | 3600–7500 |
| s6 | 1997 Apr/May | ESO 1.52m | Loral | 2048 2048 | 600 | 1.7 | 4.3 | 3600–7500 |
| s7 | 1997 Jun | ESO 1.52m | Loral | 2048 2048 | 600 | 1.7 | 4.3 | 3600–7500 |
| s8 | 1998 Feb/Mar | ESO 1.52m | Loral | 2048 2048 | 600 | 1.7 | 4.3 | 3600–7500 |
| s9 | 1998 Apr | ESO 1.52m | Loral | 2048 2048 | 600 | 1.7 | 4.3 | 3600–7500 |
| s10 | 1998 Jun | ESO 1.52m | Loral | 2048 2048 | 600 | 1.7 | 4.3 | 3600–7500 |
| s11 | 1999 Feb | ESO 1.52m | Loral | 2048 2048 | 600 | 1.7 | 4.3 | 3550–7450 |
| WMMA Id. | Identification | R.A. | Dec. | T | Ne | Ref | |||
|---|---|---|---|---|---|---|---|---|---|
| B1950.0 | B1950.0 | kms-1 | kms-1 | ||||||
| (1) | (2) | (3) | (4) | (5) | (6) | (7) | (8) | (9) | (10) |
| 001 | NGC 5188, 383 G 09 | 13:28:39.6 | -34:32:19 | 11.03 | 5 | 2425 | 6 | 0 | T98 |
| 002 | 13:28:40.4 | -34:15:48 | 15.84 | 5 | – | – | – | – | |
| 003 | 13:28:47.6 | -34:06:48 | 15.49 | 5 | 13798 | 40 | 3 | s11 | |
| 004 | 13:28:49.6 | -32:59:09 | 14.43 | 5 | 16554 | 40 | 0 | s2 | |
| 005 | 383 G 12 | 13:28:53.1 | -33:07:23 | 13.89 | 5 | 7759 | 21 | 1 | s9 |
| 006 | 13:28:53.1 | -32:56:21 | 15.84 | -5 | 15449 | 35 | 0 | s8 | |
| 007 | 13:28:56.4 | -32:38:12 | 14.10 | -2 | 14780 | 46 | 0 | s9 | |
| 008 | NGC 5193A, 383 G 14 | 13:28:58.9 | -32:58:52 | 13.30 | -2 | 3519 | 21 | 0 | s6 |
| 009 | GDP 1aaIdentification in Gregorini et al. (1994). | 13:29:01.2 | -32:56:18 | 15.35 | -5 | 14852 | 40 | 0 | s8 |
| 010 | 13:29:02.0 | -33:23:48 | 16.13 | -2 | – | – | – | – | |
| 011 | NGC 5193, 383 G 15 | 13:29:03.1 | -32:58:39 | 11.69 | -5 | 3745 | 20 | 0 | s8 |
| 012 | 13:29:08.9 | -33:47:07 | 15.45 | 5 | 14246 | 49 | 4 | s10 | |
| 013 | 13:29:09.0 | -33:47:45 | 16.28 | 5 | – | – | – | – | |
| 014 | 13:29:09.6 | -32:50:12 | 16.09 | 5 | – | – | – | – | |
| 015 | 13:29:10.9 | -32:38:20 | 16.28 | 5 | – | – | – | – | |
| 016 | 13:29:12.8 | -32:48:34 | 15.60 | -2 | – | – | – | – | |
| 017 | 13:29:13.1 | -32:37:29 | 15.27 | 5 | 14033 | 28 | 0 | s10 | |
| 018 | B132914.5-333157bbIdentification in Drinkwater et al. (1999). | 13:29:14.4 | -33:31:58 | 15.39 | 5 | 8755 | 25 | 4 | s5 |
| 019 | B132916.4-330338bbIdentification in Drinkwater et al. (1999). | 13:29:16.5 | -33:03:41 | 15.06 | -5 | 13820 | 33 | 4 | s5 |
| 020 | 13:29:17.4 | -32:45:13 | 14.65 | -2 | 14807 | 38 | 0 | s2 | |
| 021 | 13:29:18.8 | -33:07:46 | 15.51 | -2 | – | – | – | – | |
| 022 | 13:29:19.0 | -33:03:32 | 15.46 | 5 | 7539 | 58 | 8 | s5 | |
| 023 | AM 1329-324ccIdentification in Arp & Madore (1987). | 13:29:19.6 | -32:40:35 | 15.09 | -5 | 14214 | 106 | 0 | QRM |
| 024 | 13:29:19.7 | -34:06:19 | 16.35 | 5 | – | – | – | – | |
| 025 | 13:29:19.9 | -33:20:32 | 16.17 | -2 | – | – | – | – | |
| 026 | AM 1329-324ccIdentification in Arp & Madore (1987). | 13:29:19.9 | -32:40:22 | 15.09 | -2 | 14801 | 49 | 0 | s10 |
| 027 | 13:29:22.4 | -32:52:14 | 15.54 | -2 | 14541 | 30 | 0 | s11 | |
| 028 | B132924.5-330715bbIdentification in Drinkwater et al. (1999). | 13:29:24.6 | -33:07:15 | 14.76 | 5 | 15292 | 43 | 0 | s2 |
| 243 | 13:29:27.5 | -32:53:17 | 16.64 | -2 | 13502 | 51 | 0 | s11 | |
| 029 | 13:29:28.6 | -32:39:48 | 15.20 | -2 | 15703 | 29 | 0 | s5 | |
| 030 | HSTGC 07269-01549ddIdentification in Lasker et al. (1990). | 13:29:29.7 | -32:53:45 | 15.19 | -2 | 14868 | 26 | 0 | s10 |
| 031 | QRM 1325-32 41eeIdentification in Quintana et al. (1995)., B132933.4-325855bbIdentification in Drinkwater et al. (1999). | 13:29:33.4 | -32:58:55 | 14.89 | -2 | 13880 | 39 | 0 | s5 |
| 032 | QRM 1325-32 37eeIdentification in Quintana et al. (1995). | 13:29:34.5 | -32:52:53 | 15.29 | 16 | 14734 | 32 | 0 | s11 |
| 033 | QRM 1325-32 38eeIdentification in Quintana et al. (1995). | 13:29:35.3 | -32:52:44 | 14.44 | 16 | 14724 | 25 | 0 | s11 |
| 034 | 13:29:37.0 | -32:50:50 | 15.80 | 5 | – | – | – | – | |
| 035 | 13:29:39.1 | -32:59:35 | 14.93 | 5 | 14592 | 51 | 0 | s7 | |
| 036 | QRM 1325-32 42eeIdentification in Quintana et al. (1995). | 13:29:40.1 | -32:54:20 | 15.72 | -2 | 14595 | 46 | 0 | QRM |
| 037 | 13:29:41.0 | -32:54:55 | 16.15 | -2 | – | – | – | – | |
| 038 | QRM 1325-32 40eeIdentification in Quintana et al. (1995). | 13:29:43.1 | -32:53:53 | 14.72 | -5 | 12516 | 26 | 0 | QRM |
| 039 | 13:29:44.0 | -33:02:47 | 16.05 | 5 | – | – | – | – | |
| 040 | AM 1329-325ccIdentification in Arp & Madore (1987). | 13:29:46.2 | -32:51:30 | 15.09 | -2 | 15410 | 29 | 0 | s5 |
| 041 | AM 1329-325ccIdentification in Arp & Madore (1987). | 13:29:46.3 | -32:51:30 | 14.94 | -2 | 15031 | 48 | 0 | s5 |
| 042 | 13:29:50.9 | -34:38:31 | 16.29 | 5 | – | – | – | – | |
| 043 | 13:29:54.5 | -32:58:58 | 15.33 | 5 | 14222 | 32 | 0 | s10 | |
| 044 | 13:29:55.6 | -33:08:46 | 15.84 | 5 | – | – | – | – | |
| 045 | 13:29:59.8 | -32:46:43 | 15.01 | 16 | 13410 | 26 | 6 | s8 | |
| 046 | B133000.5-342742bbIdentification in Drinkwater et al. (1999). | 13:30:00.4 | -34:27:42 | 15.67 | 5 | 36879 | 77 | 0 | DPP |
| 047 | 13:30:00.7 | -32:46:20 | 15.89 | 5 | 13451 | 51 | 2 | s8 | |
| 048 | 13:30:02.3 | -34:43:34 | 16.00 | 5 | – | – | – | – | |
| 049 | 13:30:02.8 | -34:26:34 | 16.32 | 5 | – | – | – | – | |
| 050 | 13:30:03.8 | -33:03:46 | 16.31 | 5 | – | – | – | – | |
| 051 | QRM 1330-32 04eeIdentification in Quintana et al. (1995)., B133004.4-325449bbIdentification in Drinkwater et al. (1999). | 13:30:04.3 | -32:54:50 | 15.04 | -2 | 15749 | 26 | 0 | s5 |
| 052 | 13:30:05.9 | -33:07:02 | 16.09 | 5 | – | – | – | – | |
| 053 | 13:30:07.9 | -32:51:31 | 15.66 | 5 | 15127 | 30 | 0 | s8 | |
| 054 | 13:30:09.6 | -32:49:32 | 15.95 | 5 | – | – | – | – | |
| 055 | B133010.9-325038bbIdentification in Drinkwater et al. (1999). | 13:30:11.3 | -32:50:38 | 14.50 | -2 | 15006 | 25 | 0 | s8 |
| 056 | 13:30:11.7 | -34:02:28 | 15.08 | 5 | 14435 | 37 | 3 | s5 | |
| 057 | QRM 1330-32 08eeIdentification in Quintana et al. (1995). | 13:30:13.0 | -32:57:32 | 14.88 | 5 | 13732 | 40 | 0 | s5 |
| 058 | 13:30:13.6 | -32:54:47 | 16.10 | 5 | – | – | – | – | |
| 059 | B133014.9-330241bbIdentification in Drinkwater et al. (1999). | 13:30:14.9 | -33:02:41 | 15.53 | 5 | 14838 | 115 | 0 | DPP |
| 060 | B133015.5-341136bbIdentification in Drinkwater et al. (1999). | 13:30:15.5 | -34:11:36 | 15.04 | 5 | 7451 | 38 | 6 | s5 |
| 061 | 13:30:24.7 | -32:57:45 | 16.25 | -2 | – | – | – | – | |
| 241 | 383 G 17 | 13:30:25.1 | -34:12:38 | 15.70 | 22 | 3471 | 10 | 0 | CFCQ |
| 062 | 13:30:30.3 | -33:41:15 | 15.70 | 5 | – | – | – | – | |
| 063 | 13:30:31.0 | -32:49:35 | 15.33 | 5 | 14490 | 33 | 0 | s10 | |
| 064 | 13:30:32.0 | -32:59:34 | 15.90 | -2 | – | – | – | – | |
| 065 | B133034.1-334134bbIdentification in Drinkwater et al. (1999). | 13:30:34.0 | -33:41:35 | 16.28 | 5 | 22010 | 143 | 0 | DPP |
| 066 | 13:30:34.5 | -33:40:49 | 15.66 | 5 | – | – | – | – | |
| 067 | 383 G 18 | 13:30:34.7 | -33:45:33 | 14.72 | 5 | 3721 | 17 | 3 | s1 |
| 068 | 13:30:45.8 | -32:57:04 | 15.68 | 5 | – | – | – | – | |
| 069 | 13:30:51.9 | -33:08:41 | 15.90 | 5 | – | – | – | – | |
| 070 | 13:30:55.0 | -32:54:46 | 15.10 | 5 | 15355 | 27 | 0 | s10 | |
| 071 | 13:30:55.9 | -32:57:00 | 16.12 | 5 | 14957 | 37 | 0 | s11 | |
| 072 | 13:30:56.0 | -32:54:34 | 15.10 | 33 | – | – | – | – | |
| 073 | 13:30:57.9 | -32:58:06 | 15.94 | 33 | – | – | – | – | |
| 074 | 13:30:58.8 | -33:21:14 | 16.22 | 5 | – | – | – | – | |
| 075 | 13:31:00.5 | -33:03:53 | 15.15 | 5 | 14595 | 78 | 0 | s1 | |
| 076 | 13:31:02.0 | -32:45:29 | 14.39 | -2 | 13361 | 45 | 0 | s1 | |
| 077 | 13:31:02.8 | -33:06:25 | 15.26 | 5 | 14999 | 41 | 0 | s5 | |
| 078 | 13:31:03.3 | -34:38:53 | 15.24 | 5 | 8177 | 83 | 7 | s5 | |
| 079 | 13:31:09.2 | -33:32:19 | 16.07 | 5 | – | – | – | – | |
| 080 | 13:31:13.4 | -33:15:07 | 16.04 | 5 | – | – | – | – | |
| 081 | 13:31:17.1 | -32:59:53 | 15.25 | 5 | 13762 | 55 | 5 | s10 | |
| 082 | 13:31:20.4 | -33:16:13 | 15.30 | 5 | 14031 | 23 | 5 | s10 | |
| 083 | 383 G 22, B133121.8-324317bbIdentification in Drinkwater et al. (1999). | 13:31:21.9 | -32:43:17 | 14.38 | 0 | 15207 | 35 | 0 | s1 |
| 084 | 13:31:26.9 | -33:48:54 | 13.97 | 5 | 3692 | 29 | 0 | s3 | |
| 085 | 13:31:30.4 | -32:58:21 | 16.10 | 5 | – | – | – | – | |
| 086 | 13:31:31.6 | -33:42:35 | 16.28 | 5 | – | – | – | – | |
| 087 | 13:31:35.9 | -34:25:02 | 15.22 | 5 | 14848 | 49 | 0 | s10 | |
| 088 | 13:31:39.9 | -32:43:02 | 15.48 | -2 | 14946 | 34 | 0 | s11 | |
| 089 | 13:31:46.6 | -32:51:59 | 15.61 | 5 | – | – | – | – | |
| 090 | 13:31:48.0 | -33:12:07 | 14.47 | 5 | 13866 | 40 | 2 | s2 | |
| 091 | B133148.9-344649bbIdentification in Drinkwater et al. (1999). | 13:31:48.6 | -34:46:43 | 15.70 | 5 | 2367 | 21 | 0 | DPP |
| 092 | 383 G 24 | 13:31:50.1 | -33:15:48 | 15.08 | 5 | 3270 | 79 | 8 | s8 |
| 093 | 13:31:50.2 | -33:46:55 | 16.21 | 5 | – | – | – | – | |
| 094 | MCG-06-30-010, 383 G 25 | 13:31:54.3 | -34:03:17 | 13.22 | 0 | 3994 | 35 | 1 | s1 |
| 095 | 13:31:56.7 | -33:19:40 | 16.14 | 5 | – | – | – | – | |
| 096 | 13:31:57.0 | -32:53:30 | 14.51 | 5 | 15452 | 36 | 2 | s5 | |
| 097 | 13:31:57.9 | -33:10:44 | 16.12 | 5 | – | – | – | – | |
| 098 | 13:31:58.7 | -32:49:24 | 15.34 | 5 | 15149 | 30 | 0 | s10 | |
| 099 | CSRG 0728ffIdentification in Buta (1995). | 13:32:02.3 | -33:37:20 | 14.28 | 0 | 3809 | 71 | 0 | s1 |
| 100 | 13:32:02.5 | -32:46:53 | 16.00 | 5 | – | – | – | – | |
| 101 | 13:32:04.3 | -33:49:39 | 15.84 | 5 | – | – | – | – | |
| 102 | 13:32:05.8 | -33:57:39 | 15.56 | 5 | – | – | – | – | |
| 103 | 13:32:08.3 | -33:40:36 | 15.47 | 5 | 3949 | 65 | 0 | s5 | |
| 104 | NGC 5215A, 383 G 29A | 13:32:15.9 | -33:13:29 | 13.27 | 16 | 3838 | 27 | 0 | DC1 |
| 105 | 13:32:16.1 | -34:01:46 | 15.71 | 5 | – | – | – | – | |
| 106 | 13:32:16.8 | -34:46:55 | 15.97 | 5 | – | – | – | – | |
| 107 | 13:32:17.0 | -34:02:01 | 15.71 | 16 | – | – | – | – | |
| 108 | B133217.4-334646bbIdentification in Drinkwater et al. (1999). | 13:32:17.1 | -33:46:46 | 14.69 | 5 | 3950 | 40 | 0 | s8 |
| 109 | NGC 5215B, 383 G 29 | 13:32:18.6 | -33:13:39 | 12.86 | 16 | 4013 | 25 | 0 | DC1 |
| 111 | 13:32:25.3 | -33:49:19 | 15.06 | 5 | 13378 | 53 | 5 | s8 | |
| 112 | MCG-05-32-043, 383 G 30 | 13:32:25.9 | -33:38:34 | 12.91 | 5 | 3617 | 34 | 5 | s11 |
| 113 | MCG-06-30-013, 383 G 31 | 13:32:29.8 | -33:57:02 | 12.85 | 5 | 7130 | 15 | 2 | DC3 |
| 114 | 383 G 32, B133231.3-335420bbIdentification in Drinkwater et al. (1999). | 13:32:31.3 | -33:54:20 | 13.79 | 5 | 7465 | 93 | 0 | s2 |
| 115 | 13:32:33.5 | -33:37:54 | 16.36 | 5 | – | – | – | – | |
| 116 | MCG-06-30-014, 383 G 33 | 13:32:34.6 | -33:56:06 | 14.49 | 5 | 7271 | 34 | 8 | s5 |
| 117 | 13:32:35.9 | -33:17:34 | 15.48 | 5 | 14294 | 29 | 0 | s11 | |
| 118 | 13:32:40.0 | -33:58:27 | 15.97 | 5 | – | – | – | – | |
| 119 | 13:32:44.0 | -34:15:33 | 15.66 | 5 | – | – | – | – | |
| 245 | 13:32:45.0 | -33:15:52 | 16.64 | 5 | 7561 | 41 | 3 | s11 | |
| 120 | 13:32:49.9 | -32:39:12 | 15.77 | 5 | – | – | – | – | |
| 121 | 13:32:58.0 | -33:59:14 | 14.77 | 5 | 3309 | 30 | 0 | s8 | |
| 122 | 13:33:01.9 | -34:23:56 | 15.71 | 5 | – | – | – | – | |
| 123 | MCG-06-30-015, 383 G 35 | 13:33:01.9 | -34:02:26 | 12.69 | 5 | 2358 | 19 | 3 | s6 |
| 124 | NGC 5220, 383 G 36 | 13:33:05.6 | -33:11:51 | 12.06 | -2 | 4213 | 20 | 0 | s6 |
| 125 | 13:33:10.5 | -32:45:08 | 15.95 | 5 | – | – | – | – | |
| 126 | MCG-05-32-048, 383 G 37 | 13:33:14.3 | -32:45:21 | 13.23 | 5 | 3563 | 31 | 3 | DC2 |
| 127 | 13:33:19.6 | -33:38:22 | 15.37 | -2 | 3542 | 43 | 0 | s10 | |
| 128 | 13:33:21.9 | -34:07:11 | 15.13 | 5 | 3829 | 30 | 0 | s10 | |
| 129 | 13:33:23.1 | -33:15:47 | 16.11 | 5 | – | – | – | – | |
| 130 | 13:33:24.2 | -33:21:49 | 14.74 | 5 | 3406 | 78 | 0 | s8 | |
| 131 | 383 G 38 | 13:33:27.3 | -32:58:17 | 13.64 | 5 | 7507 | 50 | 0 | s1 |
| 132 | 13:33:34.8 | -34:00:56 | 15.53 | 5 | – | – | – | – | |
| 133 | 13:33:36.7 | -33:25:36 | 16.34 | 5 | – | – | – | – | |
| 134 | B133337.8-325015bbIdentification in Drinkwater et al. (1999). | 13:33:37.8 | -32:50:16 | 15.53 | 5 | 15688 | 105 | 0 | DPP |
| 135 | B133341.2-334911bbIdentification in Drinkwater et al. (1999). | 13:33:41.1 | -33:49:11 | 13.85 | 5 | 3850 | 20 | 2 | s8 |
| 136 | 13:33:44.9 | -33:39:30 | 16.34 | -2 | – | – | – | – | |
| 137 | IC 4296, 383 G 39 | 13:33:47.1 | -33:42:40 | 10.33 | -5 | 3785 | 19 | 0 | s6 |
| 138 | 13:33:47.5 | -33:51:02 | 16.02 | 5 | – | – | – | – | |
| 139 | 13:33:50.5 | -32:53:34 | 15.49 | 33 | 7166 | 34 | 8 | s11 | |
| 140 | 13:33:52.6 | -34:00:24 | 16.34 | 5 | – | – | – | – | |
| 141 | IC 4299, 383 G 42 | 13:33:55.6 | -33:48:41 | 11.99 | 5 | 4045 | 52 | 0 | s1 |
| 142 | 13:33:56.4 | -33:28:30 | 16.18 | 5 | – | – | – | – | |
| 143 | 13:34:02.7 | -33:32:33 | 15.88 | 5 | – | – | – | – | |
| 144 | B133405.6-340842bbIdentification in Drinkwater et al. (1999). | 13:34:05.6 | -34:08:43 | 15.29 | 5 | 4109 | 23 | 4 | s10 |
| 145 | AM 1334-333ccIdentification in Arp & Madore (1987). | 13:34:06.2 | -33:29:49 | 13.78 | 5 | 11567 | 24 | 0 | s6 |
| 146 | 13:34:06.8 | -33:34:15 | 16.31 | 5 | – | – | – | – | |
| 147 | AM 1334-333ccIdentification in Arp & Madore (1987). | 13:34:07.1 | -33:29:27 | 14.90 | 5 | 4099 | 47 | 0 | s6 |
| 148 | 13:34:09.4 | -33:55:01 | 15.01 | 5 | 21348 | 35 | 0 | s8 | |
| 149 | CSRG 0731ffIdentification in Buta (1995)., B133411.1-333408bbIdentification in Drinkwater et al. (1999). | 13:34:10.9 | -33:34:04 | 14.07 | 5 | 14091 | 35 | 2 | s6 |
| 150 | 13:34:17.0 | -33:30:29 | 15.71 | 5 | – | – | – | – | |
| 151 | J133709.39-334731.9ggGalaxy identified by the Mount Stromlo Abell Cluster Supernova Search Team (1997) | 13:34:17.0 | -33:32:16 | 16.35 | 5 | – | – | – | – |
| 152 | B133428.4-343809bbIdentification in Drinkwater et al. (1999). | 13:34:28.3 | -34:38:06 | 15.83 | 5 | 29247 | 103 | 0 | DPP |
| 153 | 13:34:29.1 | -33:29:07 | 16.10 | -2 | – | – | – | – | |
| 154 | MCG-05-32-052, 383 G 44 | 13:34:36.6 | -32:45:10 | 13.29 | 5 | 3776 | 16 | 3 | s3 |
| 155 | 13:34:38.4 | -33:13:23 | 15.41 | 5 | 11275 | 26 | 8 | s10 | |
| 156 | 13:34:39.8 | -34:24:18 | 15.20 | 5 | 17560 | 38 | 6 | s10 | |
| 157 | 13:34:42.4 | -34:01:31 | 16.30 | 5 | – | – | – | – | |
| 158 | B133445.1-341642bbIdentification in Drinkwater et al. (1999). | 13:34:45.1 | -34:16:42 | 15.74 | -2 | 22108 | 68 | 0 | DPP |
| 159 | MCG-05-32-053, 383 G 45 | 13:34:47.6 | -33:33:22 | 12.56 | -2 | 3914 | 19 | 0 | s6 |
| 160 | B133449.6-333555bbIdentification in Drinkwater et al. (1999). | 13:34:49.7 | -33:35:53 | 15.19 | 5 | 11292 | 62 | 4 | s8 |
| 161 | 13:34:55.0 | -32:39:20 | 15.10 | 5 | 7447 | 24 | 0 | s10 | |
| 162 | 383 G 46 | 13:34:55.3 | -34:33:14 | 15.04 | 5 | 13014 | 57 | 5 | s5 |
| 163 | 13:34:55.9 | -34:14:19 | 16.28 | 5 | – | – | – | – | |
| 164 | 13:34:57.3 | -33:34:25 | 16.08 | 5 | – | – | – | – | |
| 165 | 13:35:01.1 | -33:33:21 | 14.15 | 5 | 11402 | 28 | 0 | s7 | |
| 166 | 13:35:02.0 | -34:28:10 | 16.17 | 5 | – | – | – | – | |
| 167 | 13:35:08.7 | -33:43:59 | 15.82 | -2 | 37229 | 51 | 0 | s8 | |
| 168 | 13:35:08.8 | -33:44:19 | 14.66 | 5 | 3698 | 29 | 0 | s8 | |
| 169 | MCG-05-32-054, 383 G 48 | 13:35:09.5 | -33:15:52 | 13.28 | 5 | 3702 | 25 | 3 | s4 |
| 170 | 13:35:11.7 | -33:25:48 | 16.02 | 5 | – | – | – | – | |
| 171 | MCG-05-32-055, 383 G 49 | 13:35:11.7 | -33:37:09 | 12.79 | -2 | 3925 | 27 | 0 | s11 |
| 172 | 13:35:13.4 | -34:08:33 | 16.12 | 5 | – | – | – | – | |
| 173 | B133515.2-344829bbIdentification in Drinkwater et al. (1999). | 13:35:14.8 | -34:48:20 | 15.67 | 5 | 15162 | 92 | 0 | DPP |
| 174 | 13:35:15.1 | -34:08:06 | 15.58 | 5 | – | – | – | – | |
| 175 | 13:35:15.3 | -33:51:47 | 15.51 | 5 | – | – | – | – | |
| 176 | 13:35:16.9 | -33:39:22 | 16.34 | -2 | – | – | – | – | |
| 177 | 13:35:21.5 | -33:29:11 | 16.06 | 5 | – | – | – | – | |
| 178 | 13:35:29.4 | -34:36:19 | 16.13 | 5 | – | – | – | – | |
| 179 | 13:35:32.6 | -34:35:06 | 16.19 | 5 | – | – | – | – | |
| 180 | 13:35:34.6 | -34:21:28 | 16.30 | -3 | – | – | – | – | |
| 181 | 13:35:37.6 | -32:52:04 | 16.19 | 5 | – | – | – | – | |
| 182 | 13:35:46.9 | -33:05:54 | 14.75 | 5 | 12731 | 15 | 0 | s7 | |
| 183 | 13:35:48.4 | -33:15:50 | 14.94 | 5 | 22237 | 66 | 0 | s2 | |
| 184 | 13:35:48.6 | -33:13:12 | 16.30 | 5 | – | – | – | – | |
| 185 | 13:36:02.8 | -32:38:24 | 16.29 | 5 | – | – | – | – | |
| 186 | 13:36:09.1 | -32:38:25 | 16.10 | -2 | – | – | – | – | |
| 187 | 13:36:11.0 | -32:39:17 | 16.16 | -2 | – | – | – | – | |
| 188 | 13:36:21.1 | -32:57:09 | 15.80 | 5 | – | – | – | – | |
| 189 | 13:36:25.2 | -33:09:51 | 15.15 | 5 | 12660 | 53 | 8 | s10 | |
| 190 | 13:36:30.0 | -34:06:25 | 15.61 | 5 | – | – | – | – | |
| 191 | 13:36:33.5 | -34:17:58 | 16.33 | 5 | – | – | – | – | |
| 242 | HSTGC 07274-00974ddIdentification in Lasker et al. (1990). | 13:36:34.2 | -34:01:07 | 15.85 | 5 | – | – | – | – |
| 192 | 383 G 55 | 13:36:34.7 | -33:55:59 | 14.09 | 5 | 7691 | 10 | 0 | MFB |
| 193 | B133644.2-334554bbIdentification in Drinkwater et al. (1999). | 13:36:43.7 | -33:45:47 | 15.43 | 5 | 15222 | 32 | 0 | s6 |
| 194 | 383 G 56 | 13:36:45.2 | -32:38:21 | 14.75 | 5 | 12260 | 30 | 4 | s5 |
| 195 | 13:36:45.7 | -33:55:19 | 15.66 | 5 | – | – | – | – | |
| 196 | B133656.1-332407bbIdentification in Drinkwater et al. (1999). | 13:36:56.0 | -33:24:01 | 14.62 | 5 | 15494 | 47 | 0 | s2 |
| 197 | B133656.6-324951bbIdentification in Drinkwater et al. (1999). | 13:36:56.6 | -32:49:51 | 15.42 | 5 | 15327 | 15 | 4 | s10 |
| 199 | 13:37:04.7 | -34:04:22 | 15.79 | 5 | – | – | – | – | |
| 200 | 383 G 59 | 13:37:11.2 | -32:38:32 | 15.43 | 5 | 7364 | 28 | 6 | s5 |
| 201 | B133712.1-324853bbIdentification in Drinkwater et al. (1999). | 13:37:12.1 | -32:48:53 | 15.89 | 5 | 11841 | 59 | 0 | DPP |
| 202 | 13:37:14.6 | -33:50:08 | 16.05 | 5 | – | – | – | – | |
| 203 | 13:37:21.4 | -33:40:28 | 14.67 | 5 | 15088 | 31 | 0 | s2 | |
| 204 | 13:37:34.6 | -33:44:14 | 15.78 | -2 | – | – | – | – | |
| 205 | 13:37:35.9 | -32:42:56 | 15.70 | 5 | – | – | – | – | |
| 206 | B133737.8-334408bbIdentification in Drinkwater et al. (1999). | 13:37:37.8 | -33:44:08 | 16.04 | 5 | 14867 | 61 | 0 | DPP |
| 207 | MCG-05-32-063, 383 G 60 | 13:37:38.5 | -33:24:09 | 12.81 | 5 | 3890 | 40 | 3 | s1 |
| 208 | 13:37:39.8 | -33:44:22 | 14.95 | -3 | 14928 | 35 | 4 | s7 | |
| 209 | 13:37:45.6 | -33:44:17 | 14.32 | -3 | 14840 | 28 | 0 | s7 | |
| 210 | 13:37:45.8 | -34:08:18 | 16.20 | 5 | – | – | – | – | |
| 211 | 13:37:55.0 | -34:06:26 | 15.82 | 5 | – | – | – | – | |
| 212 | B133801.9-332524bbIdentification in Drinkwater et al. (1999). | 13:38:02.2 | -33:25:19 | 15.57 | 5 | 15167 | 66 | 0 | DPP |
| 213 | 13:38:03.8 | -33:04:57 | 14.59 | 5 | 12184 | 56 | 7 | s9 | |
| 214 | 13:38:07.7 | -33:50:57 | 15.99 | 5 | – | – | – | – | |
| 215 | 13:38:08.3 | -33:56:00 | 15.61 | 5 | – | – | – | – | |
| 216 | 13:38:10.1 | -34:04:55 | 16.30 | 5 | – | – | – | – | |
| 217 | B133812.4-340713bbIdentification in Drinkwater et al. (1999). | 13:38:12.9 | -34:07:04 | 16.28 | 5 | 15485 | 98 | 0 | DPP |
| 218 | 13:38:13.9 | -33:16:47 | 16.09 | -2 | – | – | – | – | |
| 219 | 13:38:16.3 | -32:47:54 | 15.40 | 5 | 4494 | 44 | 8 | s11 | |
| 220 | 13:38:21.9 | -34:35:37 | 16.32 | 5 | – | – | – | – | |
| 221 | 13:38:26.4 | -34:07:16 | 15.40 | -2 | 16005 | 27 | 0 | s10 | |
| 222 | 13:38:28.5 | -33:15:16 | 15.89 | 5 | – | – | – | – | |
| 223 | 13:38:30.4 | -34:38:14 | 15.64 | -5 | – | – | – | – | |
| 224 | 13:38:34.9 | -34:06:53 | 15.08 | 5 | 16013 | 27 | 0 | s8 | |
| 225 | 13:38:39.3 | -33:19:46 | 16.17 | 5 | – | – | – | – | |
| 244 | 13:38:39.5 | -33:41:15 | 17.13 | -5 | 15288 | 32 | 0 | s11 | |
| 226 | B133839.8-340745bbIdentification in Drinkwater et al. (1999). | 13:38:40.4 | -34:07:37 | 15.75 | 5 | 16922 | 36 | 0 | s8 |
| 227 | B133840.8-334114bbIdentification in Drinkwater et al. (1999). | 13:38:41.0 | -33:41:14 | 15.49 | 5 | 15425 | 44 | 6 | s11 |
| 228 | 13:38:46.3 | -34:13:12 | 15.65 | 5 | – | – | – | – | |
| 230 | 13:38:47.7 | -34:47:10 | 16.21 | 5 | – | – | – | – | |
| 229 | 13:38:47.7 | -34:03:40 | 16.34 | 5 | – | – | – | – | |
| 231 | 13:38:48.4 | -34:10:44 | 14.49 | -5 | 15620 | 77 | 0 | s1 | |
| 232 | B133849.2-334906bbIdentification in Drinkwater et al. (1999). | 13:38:49.4 | -33:49:05 | 15.96 | 5 | 14610 | 47 | 0 | DPP |
| 233 | 13:38:52.9 | -33:57:47 | 15.56 | 5 | – | – | – | – | |
| 234 | B133857.2-325558bbIdentification in Drinkwater et al. (1999). | 13:38:57.2 | -32:56:02 | 15.63 | 5 | 11945 | 65 | 0 | DPP |
| 235 | 13:39:01.1 | -33:50:50 | 15.59 | -2 | – | – | – | – | |
| 236 | 13:39:05.1 | -33:19:43 | 15.65 | 5 | – | – | – | – | |
| 238 | 13:39:06.2 | -33:48:14 | 16.10 | -2 | – | – | – | – | |
| 237 | 13:39:06.2 | -33:43:54 | 16.30 | 5 | – | – | – | – | |
| 239 | 13:39:08.2 | -33:05:30 | 16.02 | 5 | – | – | – | – | |
| 240 | 383 G 63 | 13:39:10.6 | -34:17:18 | 14.72 | 5 | 14547 | 28 | 7 | s8 |
References. — CFCQ: Cote et al. (1997) ; DC1: da Costa et al. (1986) ; DC2: da Costa et al. (1987); DC3: da Costa (1992), private communication; DPP: Drinkwater et al. (1999); MFB: Matthewson et al. (1992);QRM: Quintana et al. (1995).; T98: Theureau et al. (1998)
| Parameter | Units | A3565 | A3560 |
|---|---|---|---|
| (1950.0) | 13h 33m 04 | 13h 30m 12 | |
| (1950.0) | -33∘ 31′ 50 | -32∘ 53′ 26 | |
| 313.41∘ | 312.87∘ | ||
| 28.18∘ | 28.92∘ | ||
| Ng | 29 | 32 | |
| kms-1 | 3759 9 | 14645 20 | |
| kms-1 | 3567 9 | 14452 20 | |
| kms-1 | 228 (+38, -26) | 588 (+92, -63) | |
| vbi-weight | kms-1 | 3586 45 | 14470 123 |
| kms-1 | 236 69 | 614 68 | |
| Rh | Mpc | 0.370.01 | 0.340.09 |
| Rp | Mpc | 0.530.03 | 1.030.04 |
| tc | Hubble times | 0.04 | 0.02 |
| MVT | M⊙ | 2.72 (+1.01, -0.71) | 1.64 (+0.93, -0.77) 1014 |
| Mp | M⊙ | 3.29 0.17 1013 | 4.90 0.19 1014 |
| (M/L) | (M/L)⊙ | 143 | 760 |
| Gal Id. | Other Id. | R.A. | Dec. | ||
|---|---|---|---|---|---|
| B1950.0 | B1950.0 | kms-1 | kms-1 | ||
| (1) | (2) | (3) | (4) | (5) | (6) |
| HSTGC 07272-01686 | 13:21:56.0 | -34:02:46 | 15074 | 25 | |
| HSTGC 07268-00028 | 13:22:17.0 | -33:05:27 | 13783 | 26 | |
| HSTGC 07272-00317 | 382 G 60 | 13:22:37.0 | -33:32:12 | 8004 | 22 |
| HSTGC 07268-01809 | MGP 1133aaIdentification in Metcalfe, Godwin & Peach (1994). | 13:23:59.0 | -31:44:14 | 14008 | 51 |
| HSTGC 07268-01860 | MGP 1145aaIdentification in Metcalfe, Godwin & Peach (1994). | 13:24:03.0 | -31:44:56 | 14792 | 31 |
| HSTGC 07272-00553 | 13:24:58.0 | -33:44:35 | 15023 | 26 | |
| HSTGC 07268-02068 | 383 G 01 | 13:25:14.0 | -33:25:52 | 8091 | 16 |
| HSTGC 07272-00677 | 13:25:19.0 | -33:46:53 | 14426 | 26 | |
| HSTGC 07268-01590 | MGP 2691aaIdentification in Metcalfe, Godwin & Peach (1994). | 13:27:06.0 | -31:53:01 | 3886 | 40 |
| HSTGC 07265-01949 | 444 G 60 | 13:27:43.0 | -31:19:06 | 14489 | 29 |
| HSTGC 07269-00325 | MGP 2953aaIdentification in Metcalfe, Godwin & Peach (1994). | 13:27:44.0 | -32:00:24 | 4044 | 20 |
| HSTGC 07277-01636 | 13:28:11.0 | -35:54:12 | 7218 | 34 | |
| HSTGC 07269-00374 | MGP 3249aaIdentification in Metcalfe, Godwin & Peach (1994). | 13:28:30.0 | -31:48:39 | 12956 | 23 |
| WMMA 248bbThe galaxy wwma 248 is a background object some 2′ to the south of HSTGC 07269-01680. | 13:28:44.8 | -32:45:13 | 13697 | 57 | |
| HSTGC 07269-01680 | 13:28:45.0 | -32:43:27 | 3579 | 31 | |
| HSTGC 07269-01750 | AM 1328-325ccIdentification in Arp & Madore (1987). | 13:28:49.0 | -32:59:08 | 16579 | 35 |
| HSTGC 07269-01424 | 383 G 12 | 13:28:52.0 | -33:07:23 | 7738 | 21 |
| HSTGC 07269-00860 | 13:28:56.0 | -32:38:15 | 14780 | 48 | |
| HSTGC 07269-01083NW | 13:29:23.6 | -32:34:30 | 14017 | 24 | |
| HSTGC 07269-01083SE | 13:29:24.0 | -32:34:33 | 14366 | 25 | |
| HSTGC 07269-00070 | 444 G 70 | 13:29:56.0 | -31:42:35 | 11106 | 31 |
| HSTGC 07273-01687 | IRAS 13321-3514ddIdentification in IRAS Faint Source Catalog. | 13:32:06.0 | -35:14:35 | 15840 | 29 |
| WMMA 246eeSerendipitous galaxy located between WMMA 117 and WMMA 245 of Table 4. Coordinates estimated from the Digital Sky Survey. | 13:32:45.0 | -33:16:34 | 65529 | 71 | |
| HSTGC 07269-01344 | 13:33:05.0 | -32:30:14 | 7483 | 38 | |
| HSTGC 07273-01829 | 13:33:28.0 | -34:51:28 | 4267 | 30 | |
| WMMA 247ffSerendipitous galaxy located between WMMA 145 and WMMA 147. | 13:34:06.3 | -33:29:36 | 11479 | 49 | |
| HSTGC 07269-00876 | CSRG 0732ggIdentification in Buta (1995). | 13:34:21.0 | -32:12:21 | 13660 | 50 |
| HSTGC 07265-02190 | 13:34:48.0 | -31:31:20 | 11831 | 28 | |
| HSTGC 07273-00119 | AM 1334-351ccIdentification in Arp & Madore (1987). | 13:34:55.0 | -35:14:50 | 15268 | 24 |
| HSTGC 07277-00869 | 383 G 47 | 13:34:57.0 | -35:47:46 | 3629 | 21 |
| HSTGC 07266-00111 | CSRG 0737ggIdentification in Buta (1995). | 13:36:30.0 | -31:25:26 | 11574 | 25 |
| HSTGC 07266-00139 | IRAS 13365-3116ddIdentification in IRAS Faint Source Catalog. | 13:36:31.0 | -31:16:40 | 6932 | 47 |
| HSTGC 07270-00593 | 445 G 03 | 13:36:41.0 | -31:51:03 | 6969 | 43 |
| HSTGC 07278-01640 | PL 1hhIdentification in Postman & Lauer (1995). | 13:37:19.0 | -35:25:19 | 15638 | 52 |
| HSTGC 07270-00628 | 13:37:52.0 | -31:53:58 | 11784 | 25 | |
| HSTGC 07270-00562 | 445 G 09 | 13:37:57.0 | -32:24:18 | 11436 | 27 |
| HSTGC 07270-00284 | 13:38:03.0 | -33:04:55 | 12155 | 116 | |
| HSTGC 07270-00724 | 445 G 11 | 13:38:35.0 | -31:45:01 | 6634 | 60 |
| HSTGC 07274-01160 | 13:39:49.0 | -33:44:39 | 5726 | 31 | |
| HSTGC 07278-01018 | 383 G 62A | 13:39:03.0 | -35:26:50 | 11467 | 33 |
| HSTGC 07278-01224 | 383 G 62 | 13:39:02.4 | -35:26:35 | 8789 | 37 |
| HSTGC 07278-01206 | 383 G 64 | 13:39:13.0 | -36:05:50 | 11474 | 44 |
| HSTGC 07270-00993 | 13:40:07.0 | -31:38:04 | 11639 | 29 | |
| HSTGC 07274-01486 | 13:40:26.0 | -33:51:32 | 15073 | 40 | |
| HSTGC 07278-01133 | 13:40:41.0 | -36:09:57 | 4285 | 41 | |
| HSTGC 07266-00818 | 13:42:12.0 | -31:23:01 | 4678 | 37 | |
| HSTGC 07270-02135 | 383 G 73 | 13:42:20.0 | -33:25:44 | 11851 | 26 |
| HSTGC 07270-01022 | 13:42:24.0 | -32:23:49 | 9665 | 28 | |
| HSTGC 07270-02249 | 13:43:42.0 | -33:17:30 | 7521 | 29 | |
| HSTGC 07270-01038 | 13:44:37.0 | -31:53:31 | 12749 | 37 | |
| HSTGC 07274-00031 | 383 G 80 | 13:44:50.0 | -34:43:13 | 11504 | 23 |
| HSTGC 07270-01147 | 445 G 33 | 13:45:00.0 | -32:12:46 | 12229 | 29 |
| HSTGC 07283-00985 | 13:45:13.0 | -32:15:36 | 11745 | 29 | |
| HSTGC 07279-01872 | IRAS F13454-3132ddIdentification in IRAS Faint Source Catalog. | 13:45:24.0 | -31:31:50 | 11428 | 42 |