Metallicity Effects in NLTE Model Atmospheres of Type Ia Supernovae
Abstract
We have calculated a grid of photospheric phase atmospheres of Type Ia supernovae (SNe Ia) with metallicities from ten times to one thirtieth the solar metallicity in the C+O layer of the deflagration model, W7. We have modeled the spectra using the multi-purpose NLTE model-atmosphere and spectrum-synthesis code, PHOENIX. We show models for the epochs 7, 10, 15, 20, and 35 days after explosion. When compared to observed spectra obtained at the approximately corresponding epochs these synthetic spectra fit reasonably well. The spectra show variation in the overall level of the UV continuum with lower fluxes for models with higher metallicity in the unburned C+O layer. This is consistent with the classical surface cooling and line blocking effect due to metals in the outer layers of C+O. The UV features also move consistently to the blue with higher metallicity, demonstrating that they are forming at shallower and faster layers in the atmosphere. The potentially most useful effect is the blueward movement of the Si II feature at 6150 Å with increasing C+O layer metallicity. We also demonstrate the more complex effects of metallicity variations by modifying the 54Fe content of the incomplete burning zone in W7 at maximum light. We briefly address some shortcomings of the W7 model when compared to observations. Finally, we identify that the split in the Ca H+K feature produced in W7 and observed in some SNe Ia is due to a blending effect of Ca II and Si II and does not necessarily represent a complex abundance or ionization effect in Ca II.
1 Introduction
Type Ia supernovae (SNe Ia) are recognized for their near uniformity as standard candles. This has led to the use of SNe Ia in cosmology (Branch, 1999; Garnavich et al., 1998; Riess et al., 1998; Perlmutter et al., 1999). The development of empirical calibrations between peak brightness and light curve shape (Phillips, 1993; Hamuy et al., 1996; Riess et al., 1996; Perlmutter et al., 1997a, b; Tripp & Branch, 1999), have enhanced the usefulness of SNe Ia as distance indicators. Nevertheless theoretical modelers have yet to agree on the source of these apparently systematic variations. A primary concern is the evolutionary lifetime of SNe Ia progenitors and the possibility of significant deviations of distant SNe Ia from their well observed counterparts in the local galactic neighborhood. If galactic chemical evolution occurs slowly, then more distant SNe arise from a younger, metal poor population. On the other hand, the metallicity variations in the local sample may already span the range of the entire observational sample.
We probe the possible effects of progenitor metallicity variations on the observed spectra, by modifying the parameterized deflagration model, W7 (Nomoto et al., 1984; Thielemann et al., 1986). Using base fits to observations (§ 2.3) we have scaled all elements heavier than oxygen in the unburned C+O layer of W7 to simulate the effects of various metallicities in the progenitor system. Höflich et al. (1998) explored this question by modifying the pre-explosion metal content of a particular SNe Ia model and noted the differences in final composition, light curves, and spectra. They found that the composition of the partially burned layers of the ejecta yielded larger quantities of 54Fe. A similar effect can be seen in the lowered 54Fe abundance when W7 is calculated using a pure C+O mixture without other metals (Iwamoto et al., 1999). We have modified the 54Fe abundance of the partially burned layers of W7, to replicate this effect. While Höflich et al. (1998) focused mainly on the effects of metallicity variations on the light curve and energetics, here we concentrate exclusively on its effects on the observed spectra, particularly at early times where the formation of the spectrum occurs in the unburned C+O layer, which is most sensitive to initial progenitor metallicity.
2 Methods
2.1 Abundance Modification
To model the effects of metallicity on SNe Ia, we have modified the base W7 model at several epochs. W7, while clearly not the complete model for SNe Ia, is a good starting point for spectral modeling. The composition structure of W7 as a function of velocity does reasonably well in reproducing the observed spectra of SNe Ia (Harkness, 1991a, b; Branch et al., 1985; Nugent et al., 1997). By making separate calculations to consider the direct (C+O metallicity) and the indirect explosive nucleosynthetic consequences (54Fe enhancement), our computational methods allow us to probe these effects of progenitor metallicity independently. Höflich et al. (1998) changed the composition before computing the hydrodynamics and explosive nucleosynthesis of the model. This gives them consistent nucleosynthesis and energetics within the context of their chosen input physics. However, it is difficult to separate effects in spectra that arise from different consequences of the initial metallicity variation.
To modify the metallicity of the unburned C+O layer we have scaled the number abundances of elements heavier than oxygen in the velocity range 14800–30000 km s-1 by a constant factor , such that for all species heavier than oxygen, the new number abundance , is given by
The mass fractions are then renormalized,
in each layer. For all epochs we have used C+O metallicity factors, , of 10, 3, 1, 1/3, 1/10, and 1/30. These effects are discussed in detail in § 3.
The nucleosynthesis results of Höflich et al. (1998) show that modifying the metallicity of the progenitor white dwarf changes the quantity of 54Fe produced in the incomplete burning zone in a manner approximately proportional to the metallicity. This is due to excess neutrons in the progenitor over a pure C+O mixture, particularly 22Ne (see for example Arnett, 1996; Nomoto et al., 1984; Iwamoto et al., 1999, and references therein). To simulate this effect in W7, we have scaled the 54Fe abundance in the incomplete burning zone of W7, 8800–14800 km s-1, in the same manner as the C+O layer metallicity,
The mass fractions are then renormalized in each layer. We have used 54Fe abundance factors, , of 3, 1, 1/3, 1/10, and 1/30 for the epochs 20 and 35 days after explosion. For the remaining epochs we have only computed models for 1/10 54Fe abundance (). These effects are discussed in detail in § 4.
Finally, we simulate the full effects of progenitor metallicity on the output spectra, by combining the two effects, C+O layer metallicity and incomplete burning zone 54Fe abundance, into a single series of models. For each model we have used the same factor for both C+O metallicity and 54Fe abundance (). These factors are the same as for the 54Fe abundance modifications above. These effects are discussed in detail in § 4.
2.2 Computational Methods of PHOENIX
The calculations were performed using the multi-purpose stellar atmospheres program PHOENIX 9.1 (Hauschildt & Baron, 1999; Baron & Hauschildt, 1998; Hauschildt et al., 1997a, b, 1996). PHOENIX solves the radiative transfer equation along characteristic rays in spherical symmetry including all special relativistic effects. The non-LTE (NLTE) rate equations for several ionization states are solved including the effects of ionization from non-thermal electrons from the -decay energy of the 56Ni core. The atoms and ions calculated in NLTE are: He I (11 levels), He II (10), C I (228), O I (36), Na I (3), Mg II (18), Si II (94), S II (85), Ti II (204), Fe II (617), and Co II (255). Each model atom includes primary NLTE transitions, which are used to calculate the level populations and opacity, and weaker secondary NLTE transitions which are are included in the opacity and implicitly affect the rate equations via their effect on the solution to the transport equation. In addition to the NLTE transitions, a number of LTE line opacities for atomic species not treated in NLTE are treated with the equivalent two-level atom source function, using a thermalization parameter, , as in Nugent et al. (1997) for LTE lines for all models in this paper. The atmospheres are iterated to energy balance in the co-moving frame,
where, is the deposited energy from radioactive decay, and have their usual meaning and . This equation neglects the explicit effects of time dependence in the radiation transport equation, however the term on the right hand side implicitly includes these effects. The models are parameterized only by the day, which determine the radii and amount of radioactive decay, and by the luminosity parameter, , which is defined as,
where is the instantaneous deposition of radioactive decay -ray energy. The deposition of -rays is determined by solving a grey transport equation (Nugent, 1997; Nugent et al., 1997; Sutherland & Wheeler, 1984) as a function of time. This approach has been shown to be of sufficient accuracy for our purposes when compared to detailed Monte-Carlo calculations (Swartz et al., 1995). We use two different inner boundary conditions for our models. For days 7, 10, and 15, which are optically thick at the core, we use a diffusive inner boundary condition. For days 20 and 35 which have lower total optical depth we use a ‘nebular’ inner boundary. This boundary condition takes the downward intensity of any ray and assumes that it passes unimpeded through the core of the atmosphere, becoming the upward intensity on the other side, with only the necessary Lorentz transformation. Additional details on the use of PHOENIX in modeling SNe Ia atmospheres can be found in Nugent (1997).
2.3 Baseline Models
To perform numerical experiments on the metallicity effects in the spectra of SNe Ia, we need reasonable base models for each epoch. For each day, an observed spectrum of SN 1994D was fitted with a W7 model of appropriate age. Several models were computed with various luminosity parameters, , to fine tune the spectral shape. A separate paper fitting W7 to SN 1994D photospheric era spectra (Lentz et al. in preparation) shows the comparisons to observations. Höflich & Khokhlov (1996) find (their ) in the range . When stored radiative energy is being released and when radiative energy is being stored.
The maximum light (epoch day 0 for the observations) fit for SN 1994D to W7 (with ) at day 20 after the explosion is the same as in Nugent et al. (1997). For the two model fits at days 10 (which we compare to day -9 with respect to B maximum) and 15 (compared to day -4 with respect to B maximum) for W7 we have used luminosity parameters of and respectively. For these two models the fits are generally good, but with all of the pre-maximum spectra, the red edge of the Si II feature at 6150 Å does not extend far enough to the red. For model day 7 (fit to day -12) we chose the the model with luminosity . This model fits the luminosity and most features well; however, like the day 10 models the Ca H+K feature not extend blueward enough when compared to the earliest observations. Hatano et al. (1999) have modeled the same spectra and found that the Ca H+K feature requires ionized calcium with velocities up to km s-1. We have conducted experiments extending the density profile of W7. This did not provide enough optical depth in the Ca H+K feature to affect the line profile. Neither do our models reproduce the secondary feature at 4700 Å that Hatano et al. (1999) ascribe to Fe II absorption in the C+O layer. For our post-maximum model, day 35 (15 days after maximum), we fit the observation with a model with luminosity, . This model fits generally; however, the large feature at 4800 Å (probably Fe II) is not seen in the observations. The observed Na I D-line feature is missing, probably due to deficiencies in the sodium model atom, which has already been improved in the latest version of PHOENIX. Here, we are interested in small differential effects so it was essential that all models be run with the code version frozen.
3 Metallicity of Unburned C+O Layer
The simplest effect of metallicity on the spectral formation in SNe Ia is the change in the metal content of the unburned C+O layer neglecting changes in the density structure and deeper layers. In this section we examine these effects independently of other effects of progenitor metallicity on SNe Ia. Since ongoing supernova searches are expected to discover SNe early, and early spectra probe the outermost layers only, this approach is sensible and yields physical insight that is somewhat model independent.
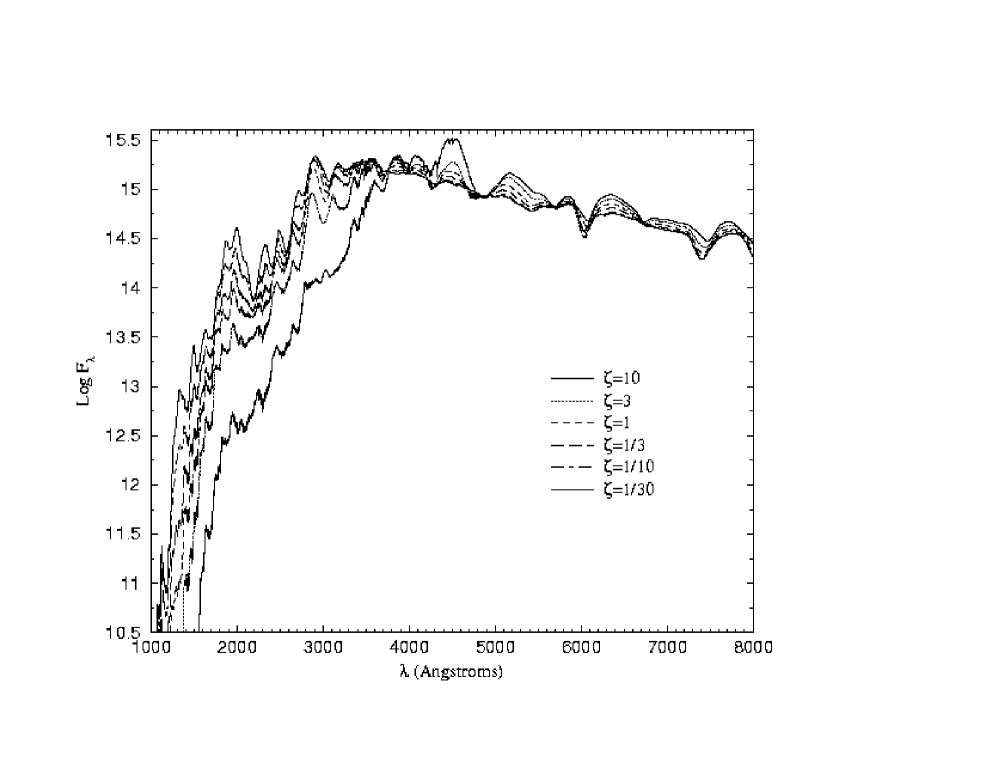
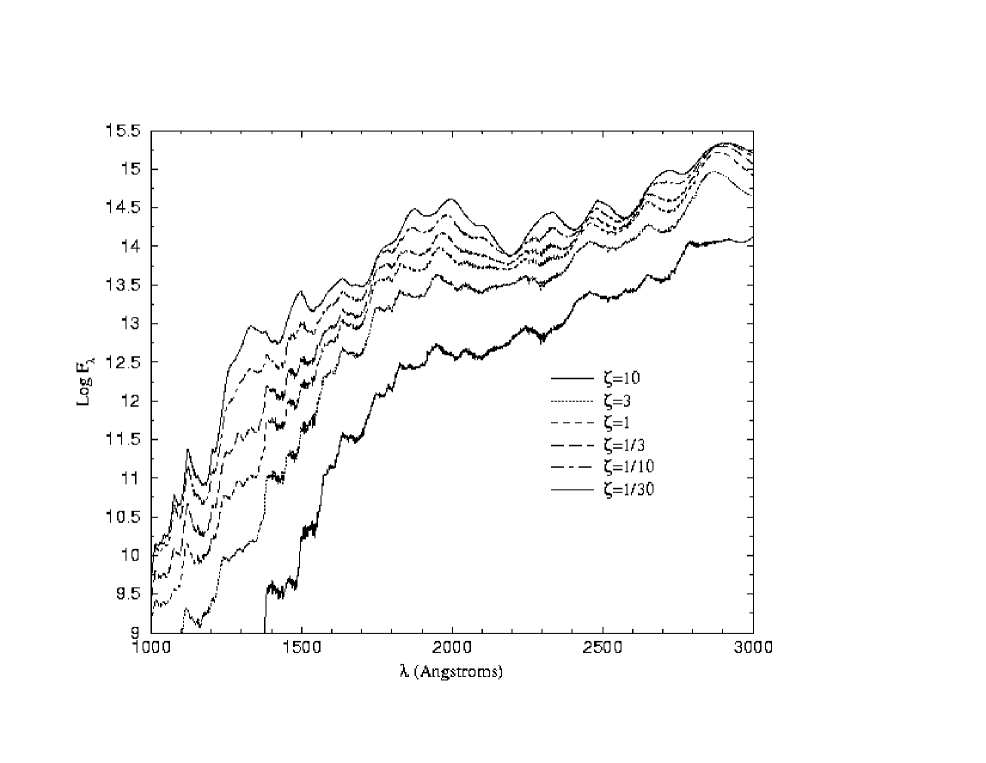
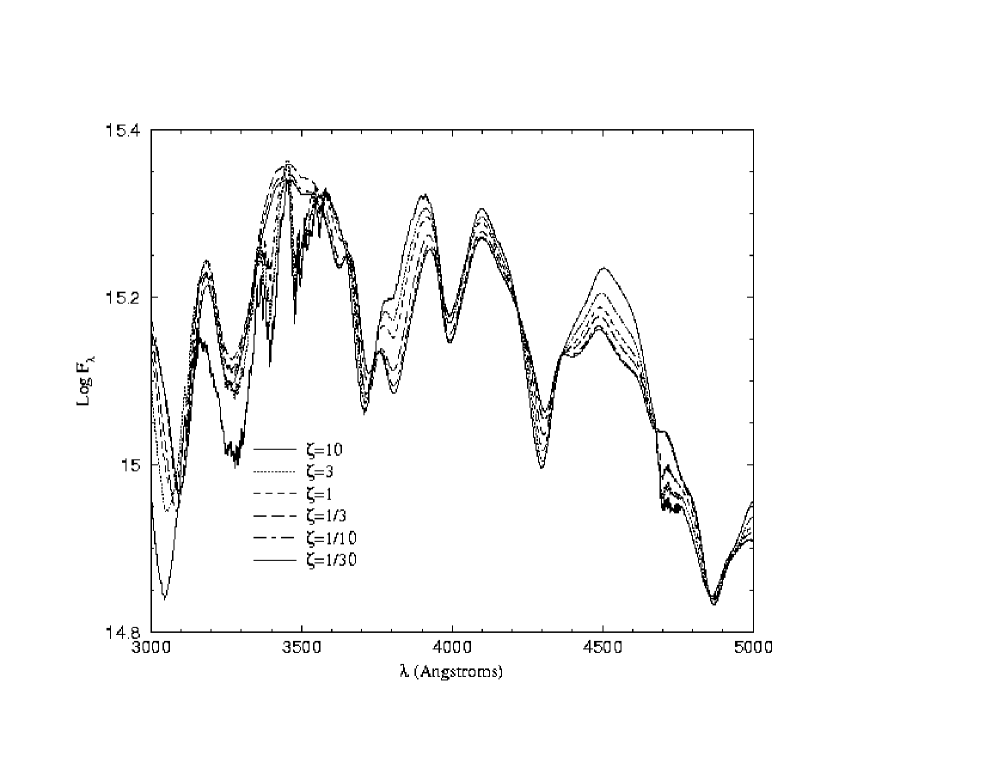
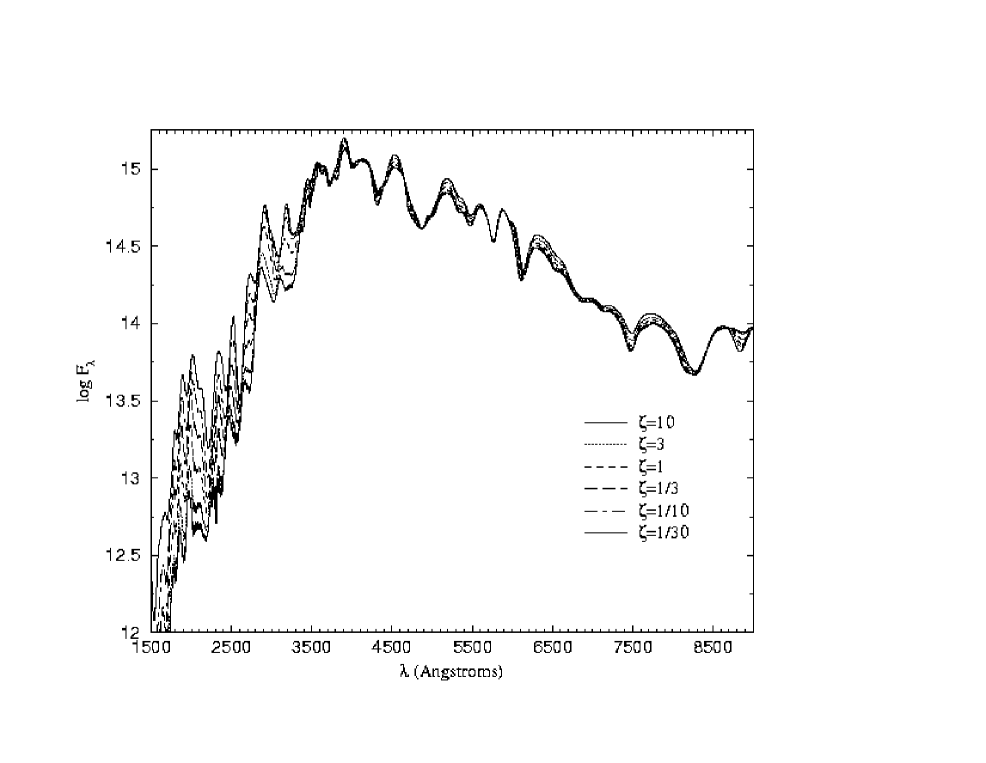
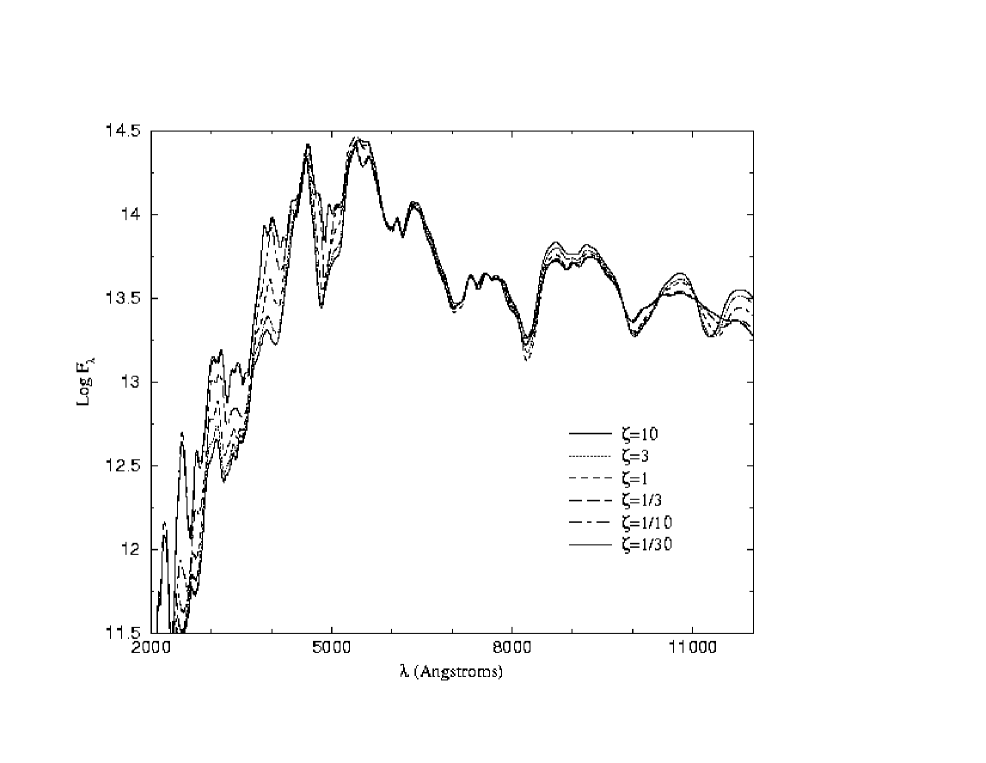
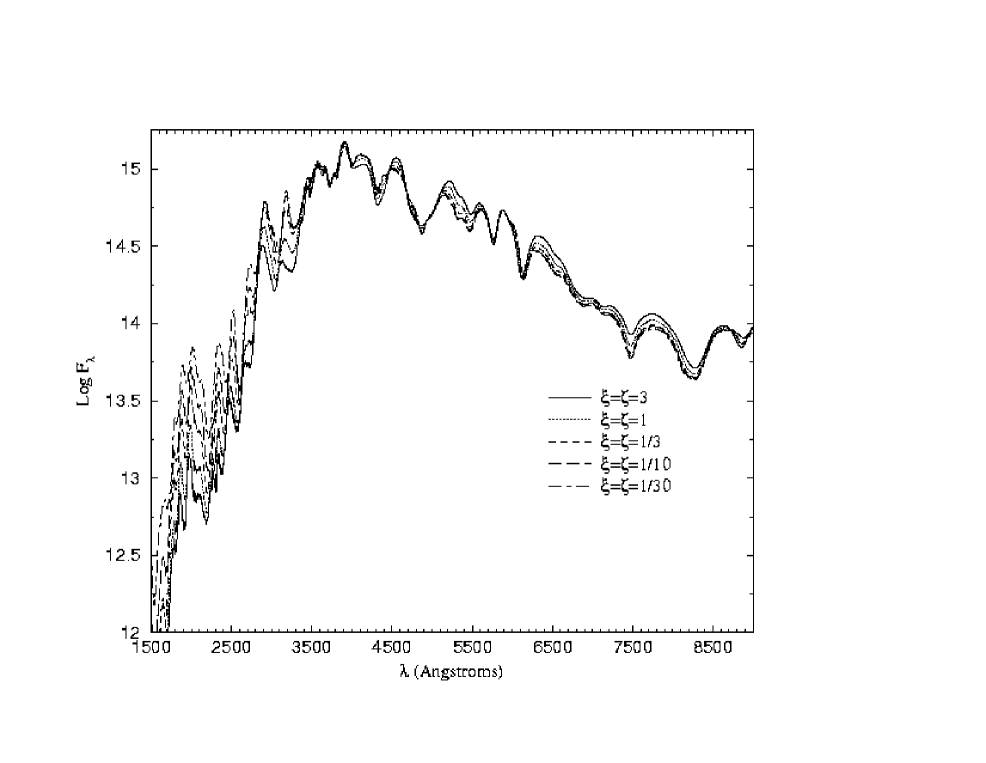
When we look at the overall UVOIR synthetic spectra (Figures 1, 6, 8, 11, and 13) of the models with variations in the C+O layer metallicity, we see two consistent and significant effects: shifts in the UV pseudo-continuum level (expanded view for day 7 in Figure 2) and variations in the Si II line at 6150 Å (expanded views in Figure 5).
The general effect in the UV is the increase in the UV pseudo-continuum level with decreasing metallicity. Simultaneous is the redward (blueward) shift of most UV features with decreasing (increasing) metallicity. In the UV, the line-forming region is in the C+O layer. As the metallicity decreases, the line forming region must reach deeper into the atmosphere to have the same line opacity, resulting in smaller line velocities. Modification of the C+O layer metal abundance gives a classic surface cooling effect, lower temperatures for higher metallicity. The higher temperatures of the lower metallicity C+O atmospheres give higher thermal fluxes, moving the UV pseudo-continuum higher with lower metallicity. The surface cooling and the resulting shifts in UV pseudo-continuum are evident at every epoch. There is the complementary effect of additional metals increasing the line blocking. We make no attempt to separate these two effects in this paper.
The Si II line at 6150 Å (Figure 5) shifts blueward with increases in metallicity for epochs through day 20. These shifts demonstrate that some line formation in this feature takes place in the C+O layer. The earlier epochs show large variations in the total depth of the feature which implies that the line forms less in the incomplete burning zone with its large, unchanging silicon abundance, and more in the C+O layer where the silicon abundance changes. At later epochs these conditions are reversed, resulting in smaller changes with C+O layer metallicity variation. These effects are discussed further in § 5.1.
The Mg II “h+k” feature at 2600 Å (Figure 2) does not move to the blue or red as the metallicity varies. The decrease in Mg II h+k feature strength with increasing metallicity is caused by the increasing UV line blanketing from background line opacity in the C+O layer. The Mg II absorption occurs mostly in the deeper, partially burned layer that is highly enriched in magnesium. We have confirmed this hypothesis by calculating diagnostic output spectra without using any background opacity (see Baron et al., 1999, for a discussion of the method). These diagnostic spectra suggest that this feature (and the feature near 2800 Å) may actually be due to a complicated blend of Mg II UV 1-4 transitions: h+k (UV 1) , (UV 2) , (UV 3) , and (UV 4) .
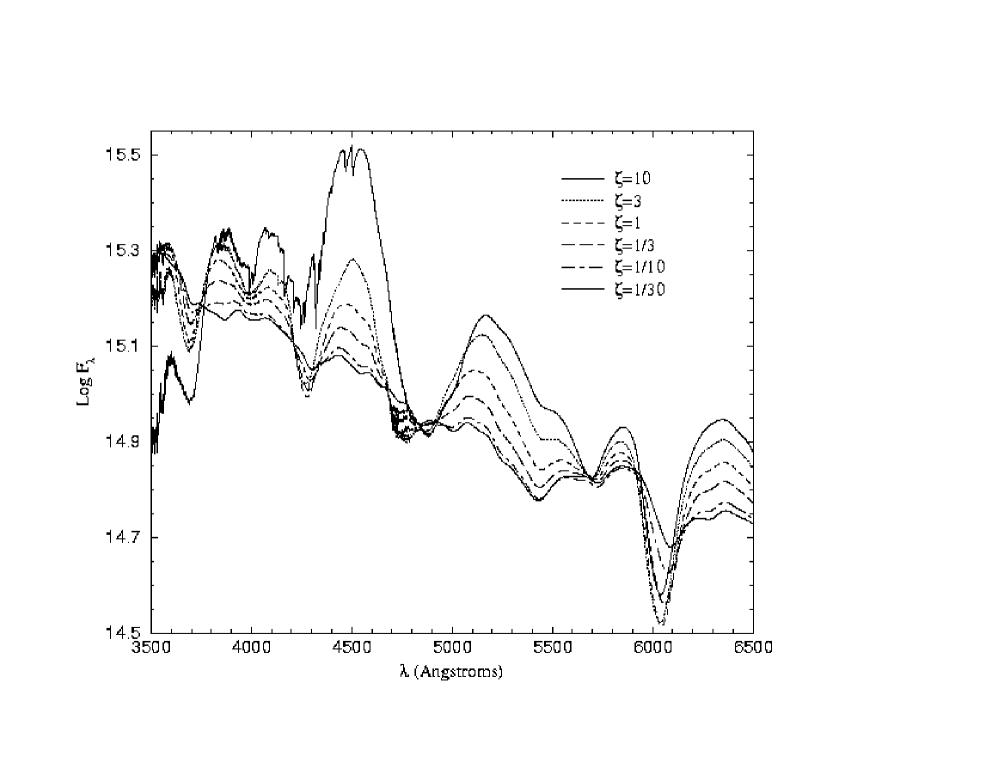
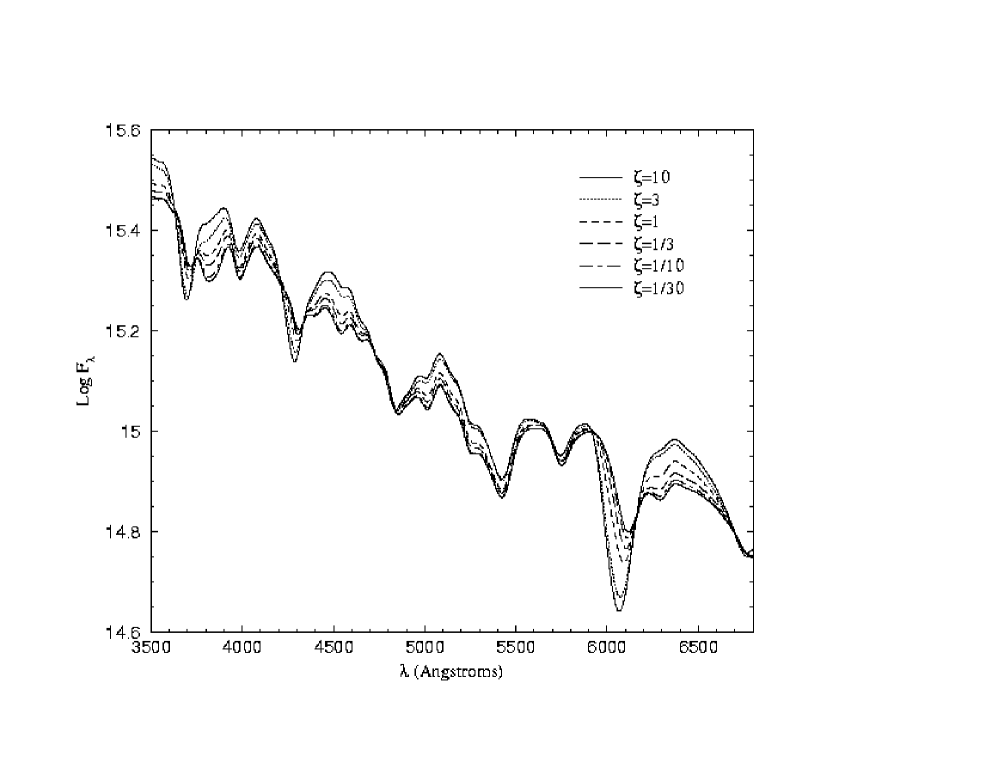
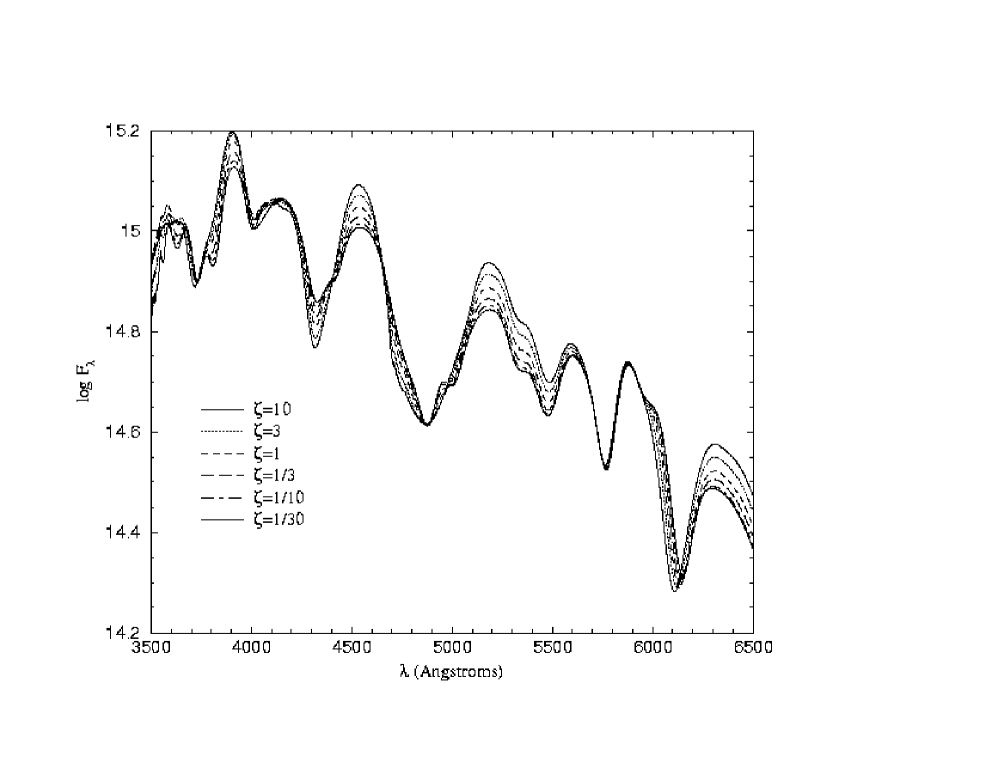
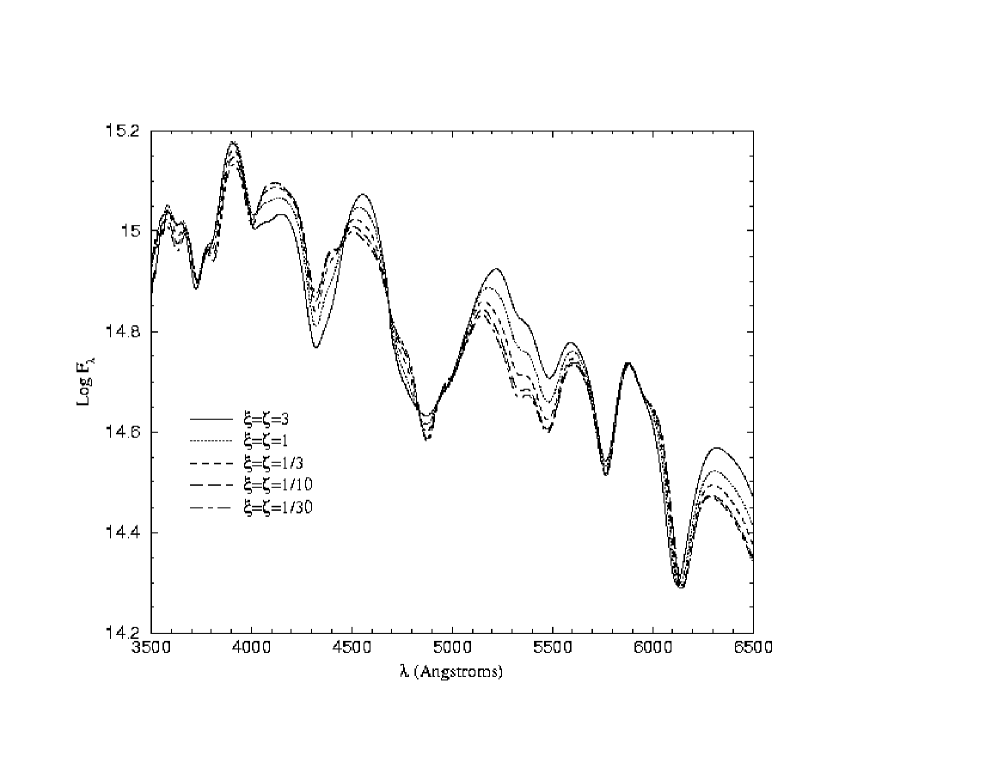
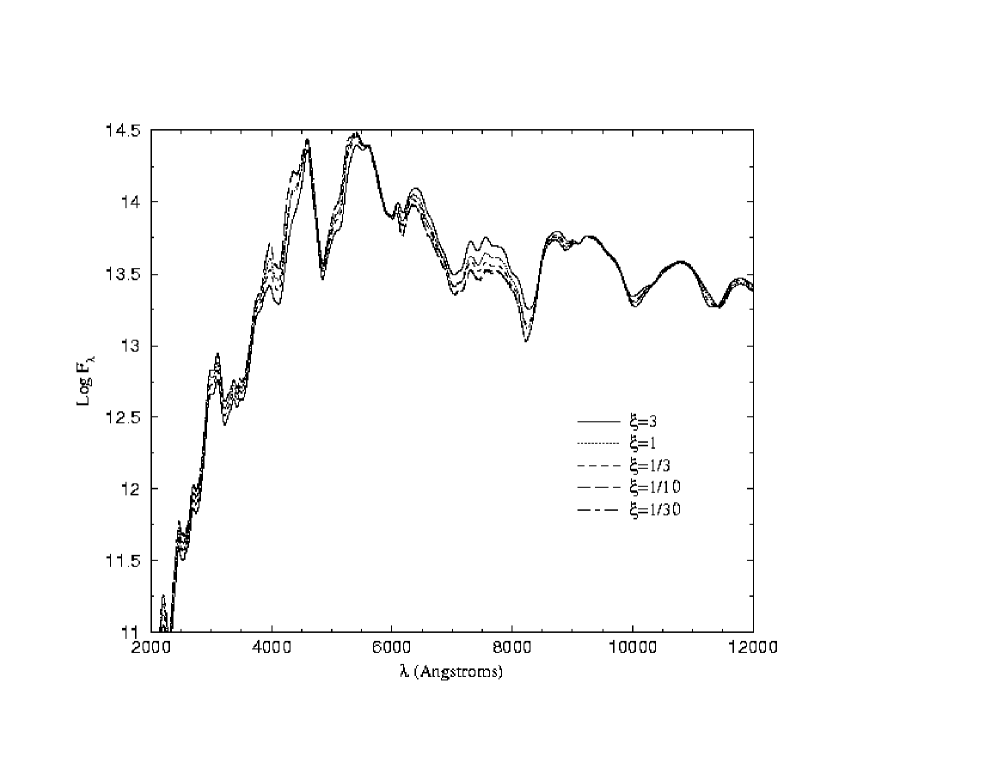
3.1 Day 7
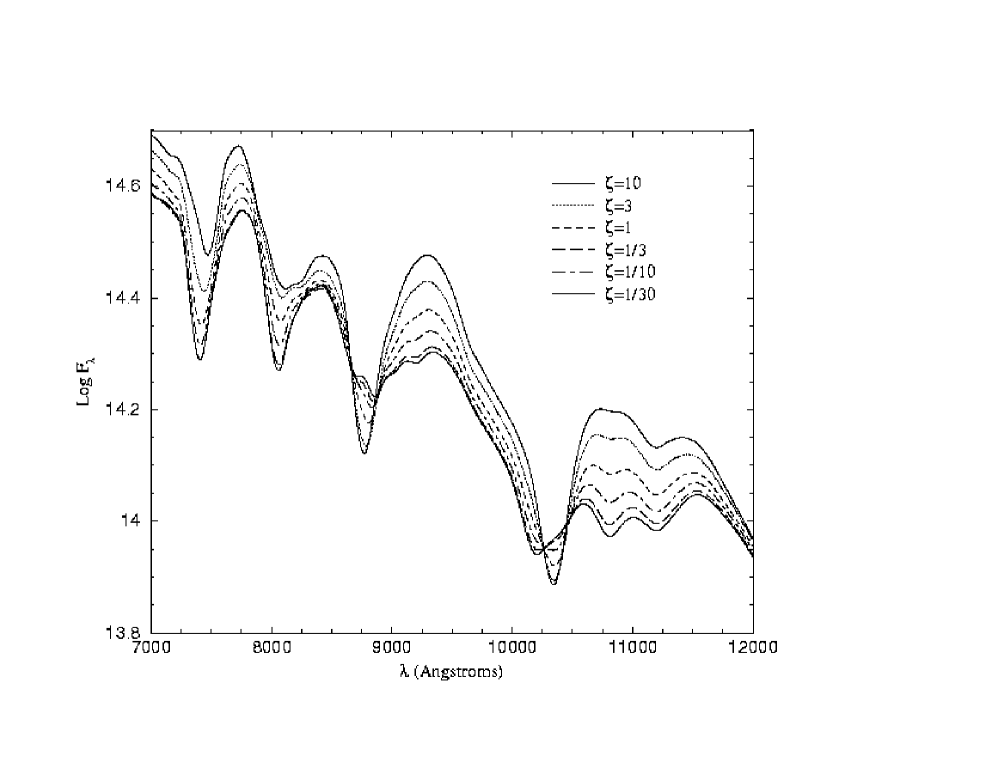
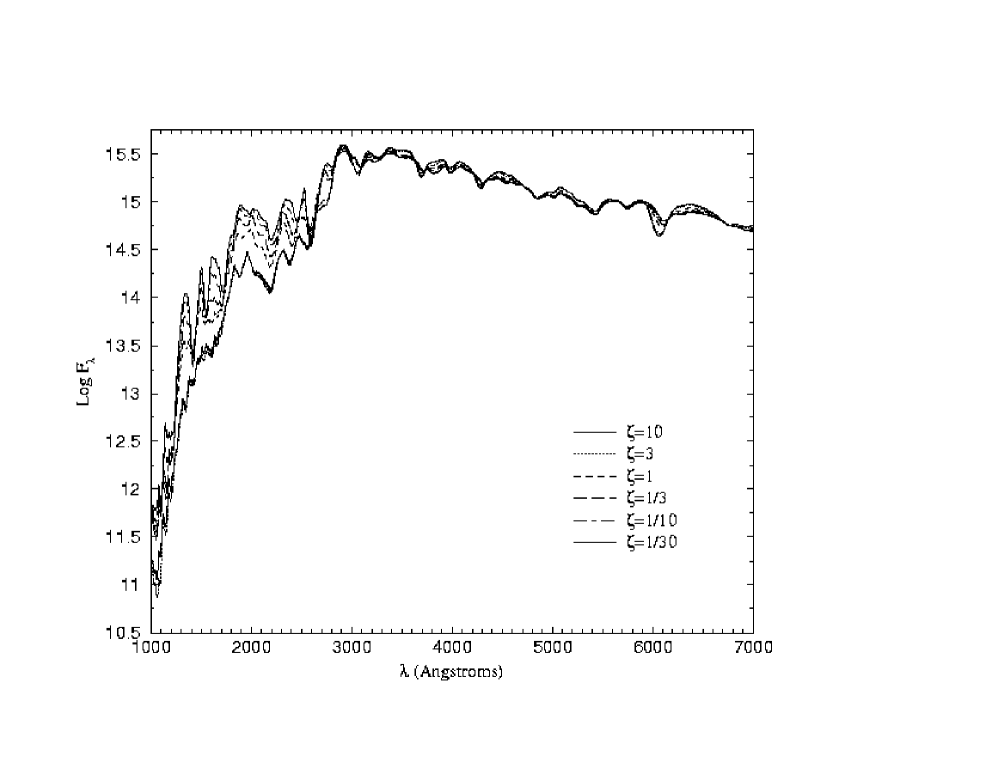
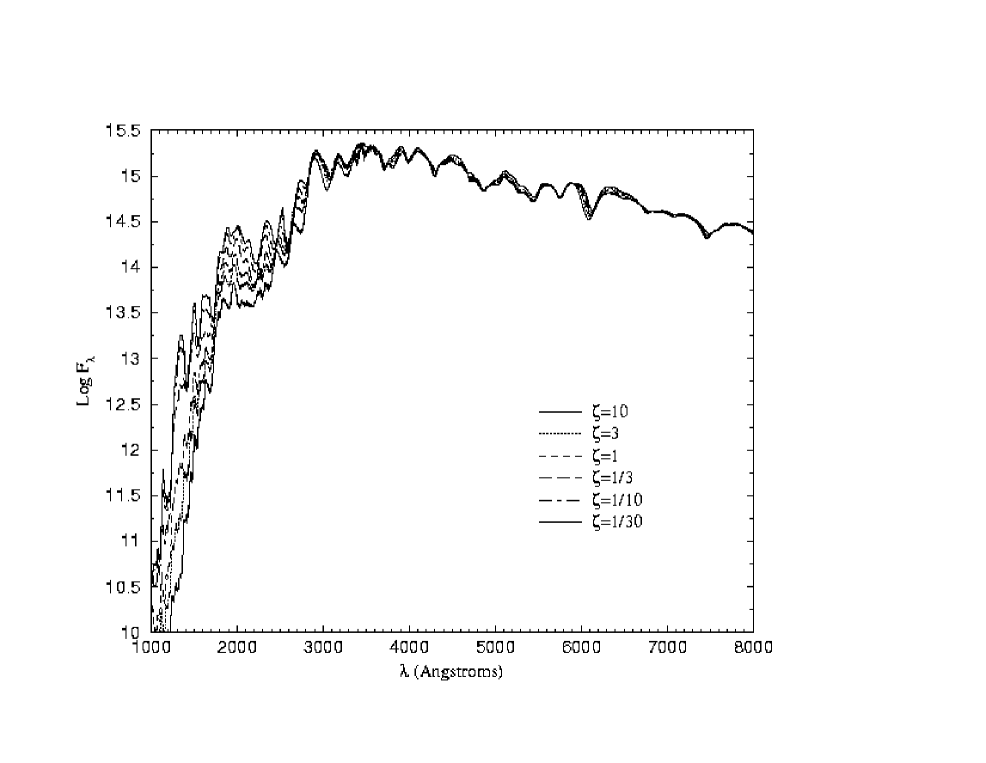
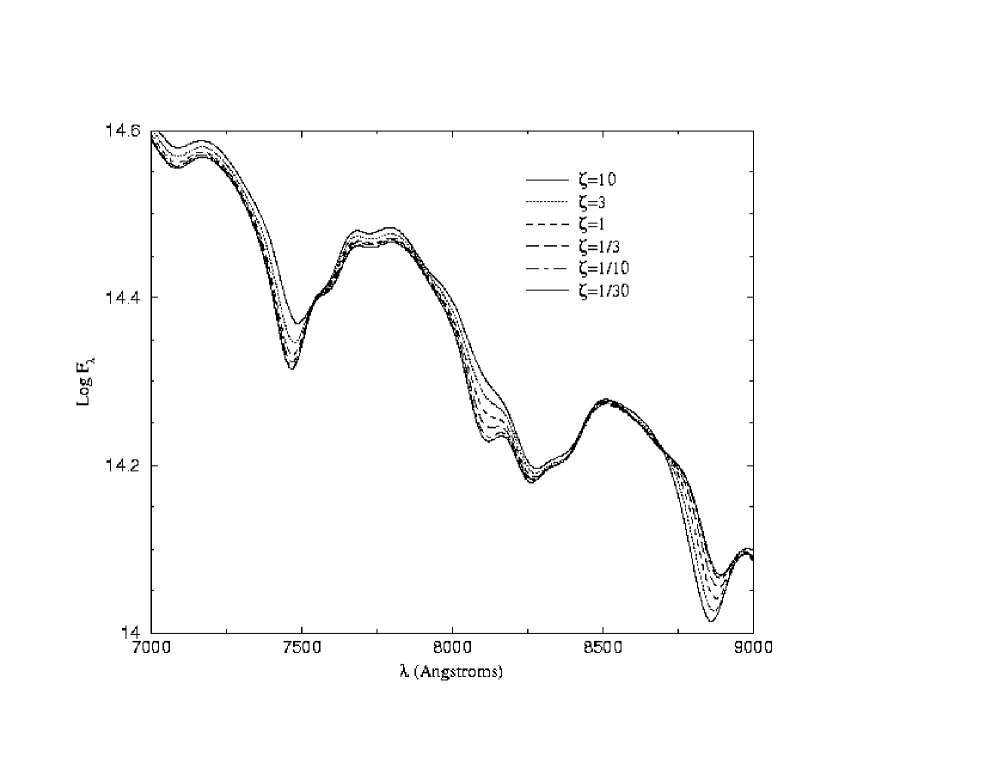
Our grid of synthetic spectra of W7 on day 7 with C+O metallicity variations are shown in Figure 1. The case is likely extreme and is shown for illustrative purposes only, we don’t consider it further at this epoch. The UV spectra (Figure 2), show variations in the pseudo-continuum due to surface cooling, line blocking, and feature shifts due to changes in the feature formation depth (velocity). The pseudo-continuum level in the optical and IR vary with metallicity. Lower metallicities have lower pseudo-continuum fluxes. Figures 3 and 4 display optical and infrared spectra which illustrate this effect more clearly. This is due to backwarming. Figure 3 shows that the line features at 3650 Å (Ca II H+K), 4250 Å (Fe II, Mg II, & Si III), 4700 Å (Fe II), and 5650 Å (Si II) nearly disappear as the metallicity drops to 1/30 of normal. The 4700 Å Fe II feature is weak and doesn’t extend far enough to the blue in the base model fits (§ 2.3). Increasing the metallicity by even a factor of 10 does not extend the feature blueward enough (to sufficiently large velocities) to match the observations. The same is true of the Ca II H+K lines. This indicates that more mass extending to higher velocities is needed to fit this feature. The Si II feature at 6150 Å (Figure 5a) shows the blueward movement of the feature minimum and blue-edge wall with increasing metallicity. The slope of the red edge of the feature changes and at the lowest metallicities the feature is not strong enough to form the red emission wing of the P Cygni feature. The infrared spectra (Figure 4) show several features that weaken with lower metallicity, Mg II Å and Si I complexes at and Å (cf. Millard et al., 1999), as well as two features that strengthen with lower metallicity. These two O I features (7400 Å and 8150 Å) weaken as the oxygen abundances decreases in favor of higher Z metals.
3.2 Day 10
Our grid of synthetic spectra of W7 on day 10 with metallicity variations in the C+O layer (Figure 6) display similar variations to those in the day 7 spectra (Figure 1). The UV variations again show the blue-shifted features and lower continua with increasing metallicity. The optical pseudo-continuum effects (Figure 7) are still present, but smaller. We again see lines that deepen with increased metallicity such as 3650 Å (Ca II H+K), 4250 Å (Fe II, Mg II, & Si III), and 6100 Å (Si II), but these effects are less dramatic than at day 7. The Si II feature (Figure 5b) still shows the changing depth and slopes of the line edges with metallicity, but, at day 10 the depth of the Si II feature in the lowest metallicity model is larger than in the same model on day 7, relative to the highest C+O layer metallicity in the respective epoch. These effects on the optical lines indicate that line formation for certain strong lines is now taking place in layers below the C+O layer. The effects of line formation below the C+O layer becomes more important as the supernova atmosphere expands and becomes less opaque.
3.3 Day 15
Our grid of synthetic spectra of W7 on day 15 with C+O metallicity variations (Figure 8) are again similar to those in the day 7 and 10 spectra (Figures 1 & 6). The decreasing effects of C+O layer metallicity are apparent. The UV pseudo-continuum variation with metallicity remains strong. The optical (Figure 9) and the near infrared (Figure 10) show the backwarming optical/IR pseudo-continuum flux effect which occurred in the optical at day 10, and extended well into the IR at day 7. Features which increased in strength with increasing C+O metallicity are a blend of Fe II, Mg II, & Si III at 4250 Å, the multi-species blend at 3300 Å, Mg II at 8850 Å, and an unidentified feature at 10400 Å (possibly Si I). The feature at 3300 Å is a blend of weak lines that forms in the C+O layer. Figure 9 illustrates the blue shifting of features as changes in metal content move the depth (and thus velocity) of line formation.
The two component feature at 3700–3900 Å is usually labeled Ca II H+K. Nugent et al. (1997) have identified this ‘Ca split’ as arising from a blend of Ca II H+K with Si II . We have calculated a series of diagnostic spectra at this epoch using the same temperature structure, but without background opacity. We have confirmed the identification of the blue wing with the Si II line. When spectra are calculated without any other line opacities, Ca II forms a pair of features. The blue Ca II absorption forms from the line, the red absorption from the H+K lines. The Si II feature falls on the peak between the two Ca II absorptions. As the Si II feature strengthens, the flux displaced by its absorption ‘fills-in’ the Ca II H+K absorption creating a ‘split’. With enough Si II only the blue absorption feature remains, while the red feature becomes an inflection. The lack of a split in some SNe Ia indicates that either the Si II feature is weaker or the Ca II H+K is stronger, preventing the formation of a split. This helps to illustrate that in supernovae of all types, features are often the result of more than one multiplet, or even ionic species.
The Si II feature at 6150 Å (Figure 5c) shows much smaller, but still significant, effects due to C+O metallicity. The blue edges are parallel and the red edges nearly so. The depth contrast is now much smaller than before. This is strong evidence that the feature is forming primarily below the C+O layer at this epoch. Figure 10 shows the displacement of oxygen by metals in the O I lines at 7450 Å, 8100 Å, and 8250 Å, the latter two of which are superimposed on the stronger Ca II ‘IR-triplet’ which, like the H+K absorption, forms in the calcium rich incomplete burning zone and is unaffected by the C+O metallicity.
3.4 Day 20
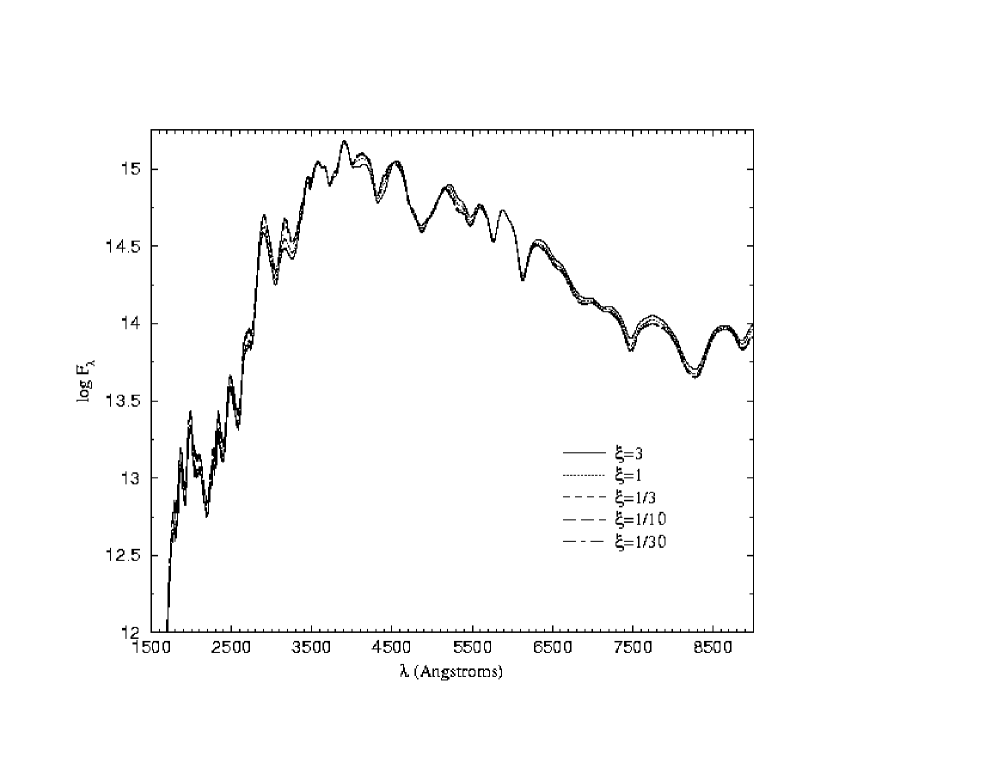
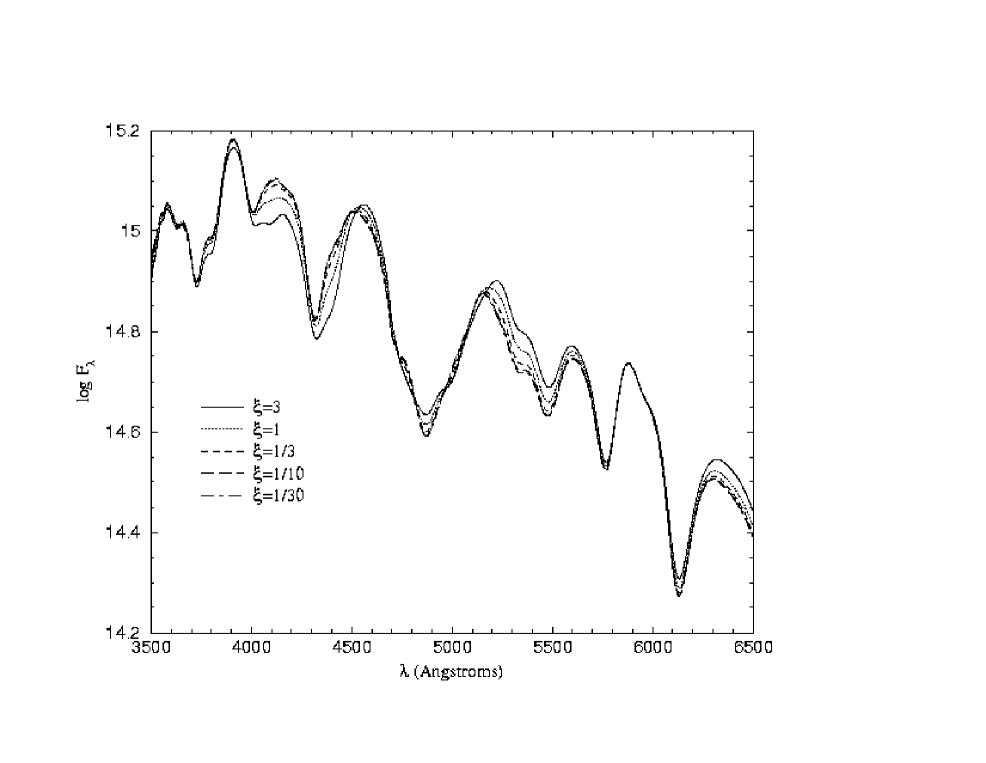
Our grid of synthetic spectra of W7 on day 20, approximately maximum B magnitude, with C+O metallicity variations (Figure 11) shows the continuing reduction in importance of the C+O layer metallicity as the atmosphere becomes more optically thin. The UV pseudo-continuum and feature shift effects are still strong. The only remaining features which display C+O layer metallicity effects in the optical (Figure 12) are the Ca II H+K, the 4250 Å (Fe II, Mg II, & Si III), and 6150 Å Si II features. As at day 15, the ‘Ca split’ remains, the blue component increasing in strength and the red component decreasing with increasing C+O metallicity. The Si II feature at 6150 Å (Figure 5d) now shows parallel edges (both blue and red) for the various C+O layer metallicities. The relatively small changes in the line strength indicate that the feature forms mostly in the deeper, silicon rich layers, but some measurable effects due to C+O layer metallicity are still evident.
3.5 Day 35
Our grid of synthetic spectra of W7 on day 35 with C+O metallicity variations are plotted in Figure 13. The UV features still show the same pseudo-continuum and line shifting behavior seen in the previous epochs. This illustrates that even at this epoch the pseudo-continuum formation in the UV is still in the unburned C+O layer. The Si II feature at 6150 Å has only small variations which can not be separated from the pseudo-continuum effects. It should be noted that the Si II feature at this epoch fits the observations rather poorly.
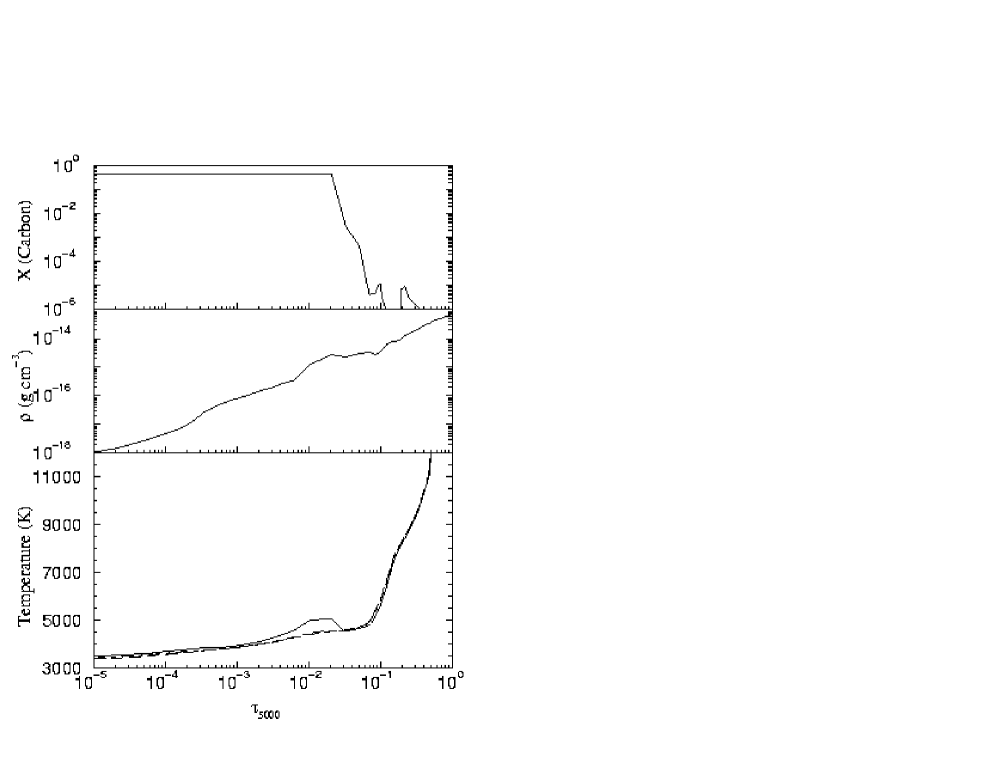
In the optical we see the blue-shifting of the 4800 Å (Fe II) feature with increasing metallicity without significant changes to the overall width, shape, or depth of the feature. This indicates that it forms mostly at deeper layers, with smaller effects from the C+O layer. When looking for a base fit for this epoch, we find that while the line shapes near 5000 Å are better with somewhat hotter models, those models had poor overall spectral shape or color. To diagnose this sudden change in model behavior, we have plotted the temperature profile of the three models with the lowest metallicity, the density profile, and the carbon abundance (Figure 14). We can see that the model has a definite temperature inversion. This inversion corresponds to the position of the density spike in W7 arising from the deflagration wave. The higher density coincides with the change from the more efficient cooling available by intermediate mass elements to that of the less efficient cooling of C+O creating the temperature inversion. In models with higher metal content the effectiveness of cooling by metals in the C+O layer provides the needed cooling to prevent the formation of an inversion.
4 54Fe Content of Incomplete Burning Zone
4.1 Pre-Maximum Light Epochs
We have computed models with 54Fe abundance reductions of 1/10 in the intermediate burning zone and models with the combined 1/10 C+O metallicity and 1/10 54Fe abundance reductions for the epochs 7, 10, and 15 days. When we compared the 54Fe reduced abundance models with the related models containing the same C+O metallicities (normal and 1/10 normal, respectively) we found no changes in feature strength. Some slight differences in pseudo-continuum levels were seen in the day 10 and 15 comparisons. These may be due to weaker versions of the 54Fe abundance caused backwarming described in § 4.2. Since each comparison pair includes two models with different composition in the incomplete burning zone this may slightly affect the temperature structure.
4.2 Day 20
Our grid of synthetic spectra of W7 on day 20, approximately maximum B magnitude, with incomplete burning zone 54Fe abundance variations is shown in Figure 15. Some small vertical displacements of the UV flux, without blue- or red-shift, can be understood by the effects of surface cooling/backwarming in the incomplete burning zone. As intermediate mass elements are replaced by 54Fe, the larger line opacity of iron cools the 54Fe rich models. Since this does not affect the temperature gradient in the C+O layer, the temperature shift remains constant throughout the C+O layer.
In the optical (Figure 16) we can see a few features that decrease with increasing 54Fe, such as the Si II and S II in the 4850 Å feature, the S II “W” at 5300 Å, and the Si II feature at 6150 Å. This is caused by displacement of the species forming the line by additional 54Fe. Several features can be seen to strengthen with greater 54Fe abundance. This indicates that they are formed at least in part by iron in the incomplete burning zone. These features included the feature at 4100 Å that erodes the peak of a neighboring feature and the red wing of the 4300 Å feature.
Our grid of synthetic spectra of W7 on day 20 with incomplete burning zone 54Fe abundance variations and C+O layer metallicity are shown in Figure 17. The effects of the combined modifications mostly separate into the effects seen in Figures 11 & 15. The UV displacements in flux and the effects on the Si II 6150 Å feature in the combined models reflect the effects of metallicity variation in the C+O layer alone. The S II “W” at 5300 Å and the “peak erosion” line at 4100 Å show the primary effect of 54Fe abundance on the optical spectra (Figure 18) when both the 54Fe abundance and the C+O layer metallicity are varied simultaneously. The effect of the combined modifications on the Ca II H+K feature are small. The 4350 Å feature in the combined modification has the combination effects of deeper red wing strength with increasing 54Fe abundance and a deeper blue wing (Mg II) with increasing C+O layer metallicity. The changes in the C+O layer metallicity and in the 54Fe abundance of the incomplete burning zone each have effects which are separate from one another and combined effect is essentially the sum of the two effects.
4.3 Day 35
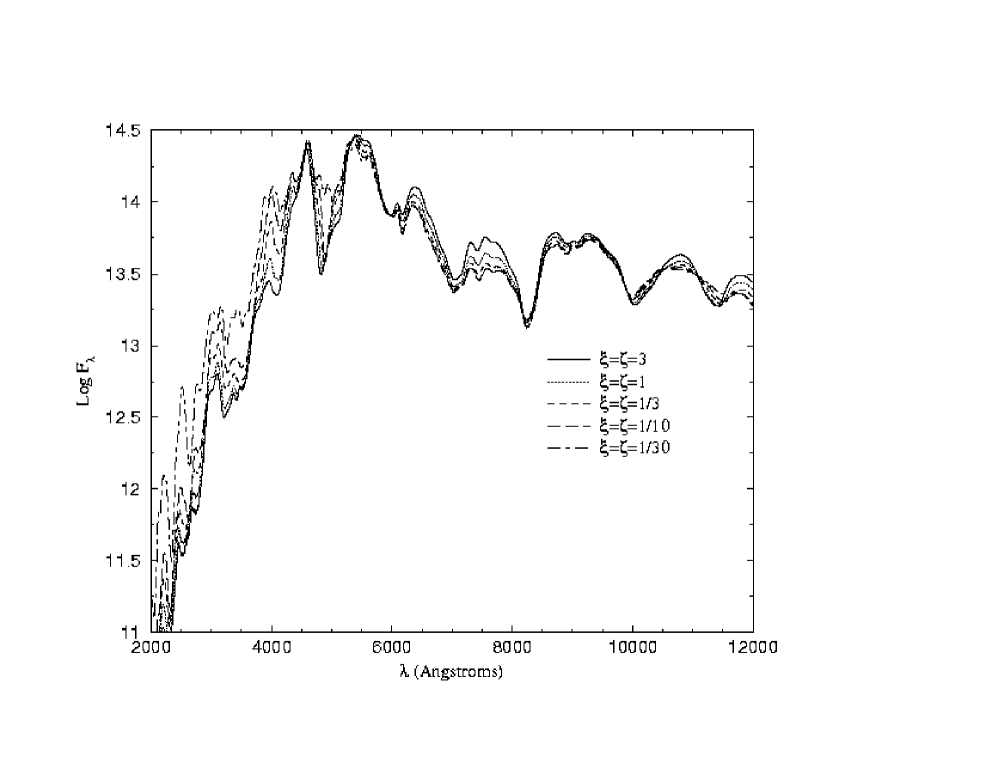
Our grid of synthetic spectra of W7 on day 35 with incomplete burning zone 54Fe abundance variations are shown in Figure 19. The UV pseudo-continuum varies due to the ‘surface’ cooling and additional line blocking in the incomplete burning zone. The O I feature at 8000 Å and the Si II feature at 6150 Å become weaker as oxygen and silicon are displaced by 54Fe. There are several significant effects in the infrared, however, observations which extend far enough into the IR to compare with real SNe Ia are not available.
Our grid of synthetic spectra of W7 on day 35 with combined incomplete burning zone 54Fe abundance and C+O layer metallicity variations are shown in Figure 20. The effects of the combined modifications mostly separate in the the effects shown in Figures 13 & 19. The UV pseudo-continuum variation, changes near the 5000 Å Fe II feature, and the changes to the 11000Å feature reflect the C+O metallicity modification alone. The small shift in the Si II feature at 6150 Å and the surrounding pseudo-continuum show the contributions of 54Fe abundance modification.
5 Discussion
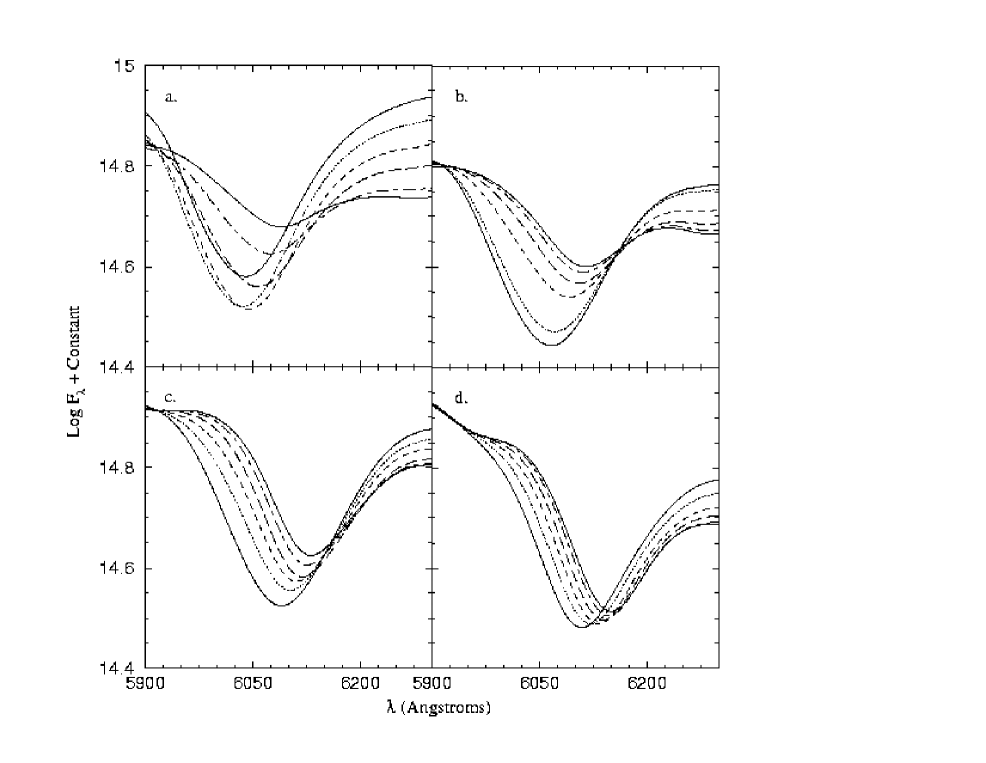
5.1 Evolution of Si II
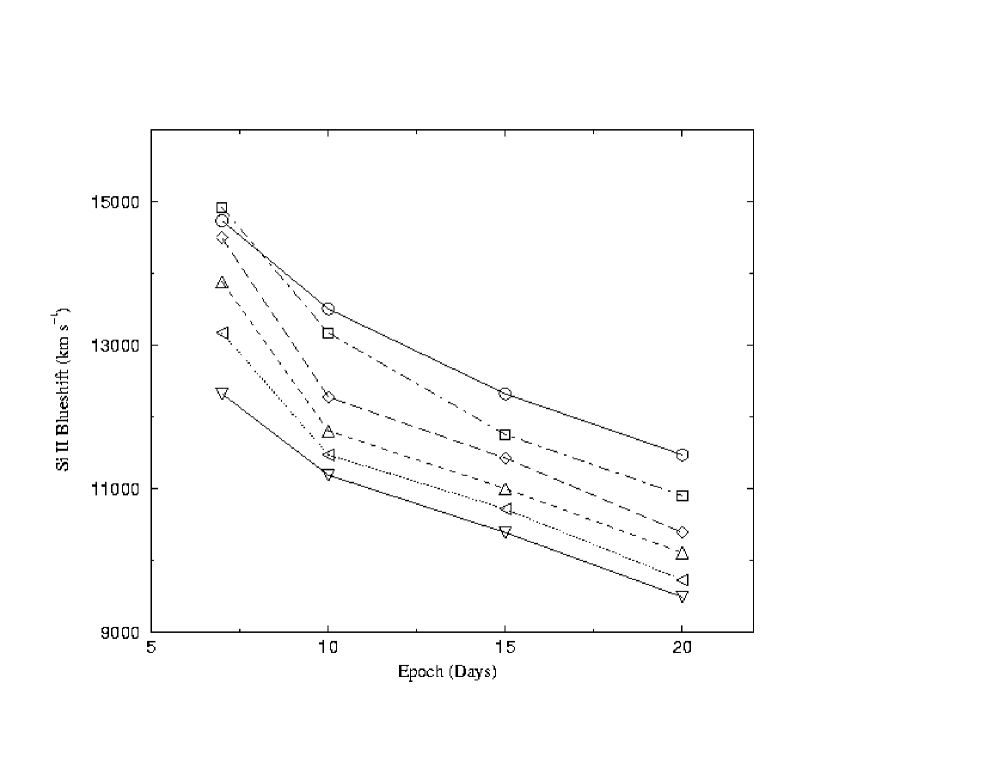
Figure 5 shows the evolution of the Si II 6150 Å feature to maximum light. The feature grows stronger and steeper as line formation of the Si II feature moves into the silicon rich layers of W7. As line formation moves into the silicon rich zones, the effects of C+O layer metallicity on line formation, are reduced, but not eliminated. The blue-shift velocities of the deepest points of the Si II feature are plotted for these models in Figure 21. Except for the extreme case, , the blue-shift velocities increase monotonically with C+O layer metallicity through day 20. The increasing opacity from the C+O layer moves the feature blueward. The velocity shifts due to metallicity are degenerate with changes that could be expected from silicon rich material extending to higher velocities. However, the effects of primary line formation in the C+O versus silicon rich layers can be distinguished by line shapes. These general trends and spreads in blueshift velocities are similar to those seen in the data by Branch & van den Bergh (1993). They found that the slower blueshift velocities tended to be found in earlier galaxy types. A similar study correlating blueshift velocities, peak magnitude (or a suitable proxy), and a more quantitative estimate of the pre-supernova environment metallicity will be the subject of future work.
5.2 Other Features and Effects
The UV pseudo-continuum shows the effects of metallicity through the surface cooling of the C+O layer, additional line blocking and the shifting of lines which form at faster moving layers with higher metallicity. The UV pseudo-continuum displacement is relatively constant and still present at 35 days after explosion. The UV displacement over the entire range of models is typically dex. For the more likely range of metallicities, 1/3 to 3 times solar, the change is up to dex or 0.5 magnitude. Unfortunately, we cannot use near-UV flux as a metallicity indicator. The UV flux is diagnostic of the temperature, density, and radius (velocity) of the C+O layer, but is not uniquely determined for any one quantity. The related backwarming causes pseudo-continuum shifts in the optical and near infra-red for the early epoch spectra. This backwarming shift in continua fades in strength as pseudo-continuum formation moves to deeper layers. A smaller surface cooling/backwarming effect exists in the partially burned layers from changes in 54Fe abundance, beginning at day 20.
Höflich et al. (1998) also report a change in UV pseudo-continuum for models with different metallicity by noting decreases in the U band magnitude with increasing metallicity. They show a change in flux in the UV spectra presented, but the change occurs in the opposite direction with metalicity to that which we find here. This is due to the difference in the density structures between delayed detonation models (DDs) they employ and that of the parameterized deflagration model W7 that we use here. In the DD model the lower metallicity model forms the UV pseudo-continuum at a smaller radius and so the flux is lower for smaller metallicities, since the radial effect wins out over the opacity.
Some features which had significant impact from C+O metallicity at early epochs are nearly unaffected at later epochs. At day 7 we find that most of the optical features nearly disappear when the metal content is dropped to 1/30 normal. This indicates that much of line formation for these features takes place in the C+O layer. In later epochs the impact of the C+O layer metallicity on most optical features becomes quite small, since line formation occurs mostly in the deeper layers.
The influence of 54Fe abundance in the incomplete burning zone is very small at early epochs, since significant spectrum formation occurs in the C+O layer. At maximum light and later, 54Fe abundance variations change Fe feature strengths, have some small temperature based effects on the pseudo-continuum, and change the strength of certain features from species, e.g. sulfur, which are displaced by 54Fe abundance changes.
We have confirmed the Nugent et al. (1997) identification of Si II as a component of the Ca II ‘split’. To the blue of the Ca II H+K feature is the emission peak from another Ca II line. When the Si II line forms, the Si II absorption falls on that peak and the emission from the Si II line forms a peak in the center of the ‘split’. For models with a strong Si II feature, the absorption minimum of the red wing of the Ca II H+K will seem to disappear. For W7, changes in metallicity alter the strength of the Si II line and thus, the shape of the Ca ‘split’ feature. In real SNe Ia, other factors may prevent the formation of a ‘split’ such as stronger Ca II H+K, weaker Si II, or temperature effects. Jha et al. (1999) show spectra for several normal SNe Ia. The Ca II H+K feature in the observations display a range of morphologies similar to those seen in our synthetic spectra. We do not require any abundance or ionization effect to produce this feature. While this interpretation is strictly correct in the model W7, we suspect it also produces the observed feature in SNe Ia, however, detailed comparisons of the calculated velocities to those of the observed features are required.
6 Conclusions
By calculating a series of model atmospheres with abundance variations around the base W7 model for SNe Ia, we have demonstrated unexpected and complex effects on the output spectra. The UV spectra show lower flux and blueshifting lines as surface cooling, additional line blocking, and outward movement of the line-forming region occur with higher metallicity in the unburned C+O layer. We have demonstrated, at epochs well before maximum light that line formation occurs largely in the C+O layer for species that will later form in newly synthesized material. The ‘splitting’ of the Ca II H+K feature we can now better understand as a blend of a Si II feature with the stronger Ca II lines, without abundance or ionization effects in the W7 model. We have shown that the strength, profile, and velocity of the SNe Ia characteristic Si II 6150 Å feature are affected by C+O layer metallicity. This provides a mechanism for the variation in the blueshift of the Si II feature without variations in the explosion energy. For exploding white dwarfs of different metallicities Höflich et al. (1998) and Iwamoto et al. (1999) find changes in nucleosynthesis. We tested these effects on spectra by varying the 54Fe abundance in the incomplete burning zone. We have found that the 54Fe abundance has negligible effect on pre-maximum spectra and relatively little effect afterwards. The effects of progenitor metallicity variations can mostly be separated into effects due to 54Fe, and those due to C+O metallicity.
Previous spectral studies (Branch et al., 1985; Harkness, 1991a, b; Nugent et al., 1995, 1997) have shown that W7 has the appropriate composition structure to reproduce photospheric era spectra. In preparing the base fits for this paper we have found that the quality of the fits decreases away from maximum light. The temperature structure inversion in the lowest metallicity model at day 35 demonstrates the importance of changes (%) in the temperature structure. We see that density/temperature structures are important in fitting spectral features. In forthcoming work we will present the results of numerical experiments to alter the density structure of W7 to make the model better correspond to the observations.
We have shown through parameterized abundance modifications of the SNe Ia model W7 that pre-explosion metallicity can have detectable effects on the output spectra at every epoch. Due to the uncertainty in hydrodynamic models and severe blending of lines in SNe Ia spectra, we cannot give a prescriptive analysis tool for measuring the pre-explosion metallicity of SNe Ia. However, hopefully this can contribute to the understanding of the diversity of SNe Ia, and the ways that various progenitor metallicity effects can affect SNe Ia. Studies computing detailed spectra of hydrodynamic models that include progenitor metallicity in the evolution of the star and the hydrodynamics and nucleosynthesis of the supernova should show what effects overall progenitor metallicity have in creating SNe Ia diversity.
References
- Arnett (1996) Arnett, W. D. 1996, Supernovae and Nucleosynthesis (Princeton, NJ: Princeton University Press)
- Baron et al. (1999) Baron, E., Branch, D., Hauschildt, P. H., Filippenko, A. V., & Kirshner, R. P. 1999, ApJ, in press
- Baron & Hauschildt (1998) Baron, E. & Hauschildt, P. H. 1998, ApJ, 495, 370
- Branch (1999) Branch, D. 1999, Ann. Rev. Astr. Ap., 36, 37
- Branch et al. (1985) Branch, D., Doggett, J. B., Nomoto, K., & Thielemann, F.-K. 1985, ApJ, 294, 619
- Branch & van den Bergh (1993) Branch, D. & van den Bergh, S. 1993, AJ, 105, 2231
- Drell et al. (1999) Drell, P. S., Loredo, T. J., & Wasserman, I. 1999, ApJ, submitted
- Garnavich et al. (1998) Garnavich, P. M. et al. 1998, ApJ, 493, L53
- Hamuy et al. (1996) Hamuy, M., Phillips, M. M., Schommer, R. A., Suntzeff, N. B., Maza, J., & Aviles, R. 1996, AJ, 112, 2391
- Harkness (1991a) Harkness, R. 1991a, in Proceedings of the ESO/EPIC Workshop on SN 1987A and other Supernovae, ed. I. J. Danziger & K. Kjär (Munich: ESO), 447
- Harkness (1991b) —. 1991b, in Supernovae, ed. S. E. Woosley (New York: Springer-Verlag), 454
- Hatano et al. (1999) Hatano, K., Branch, D., Baron, E., & Fisher, A. 1999, ApJ, 525, in press
- Hauschildt & Baron (1999) Hauschildt, P. H. & Baron, E. 1999, J. Comp. Applied Math., in press
- Hauschildt et al. (1997a) Hauschildt, P. H., Baron, E., & Allard, F. 1997a, ApJ, 483, 390
- Hauschildt et al. (1996) Hauschildt, P. H., Baron, E., Starrfield, S., & Allard, F. 1996, ApJ, 462, 386
- Hauschildt et al. (1997b) Hauschildt, P. H., Schwarz, G., Baron, E., Starrfield, S., Shore, S., & Allard, F. 1997b, ApJ, 490, 803
- Höflich & Khokhlov (1996) Höflich, P. & Khokhlov, A. 1996, ApJ, 457, 500
- Höflich et al. (1998) Höflich, P., Wheeler, J. C., & Thielemann, F.-K. 1998, ApJ, 495, 617
- Iwamoto et al. (1999) Iwamoto, K., Brachwitz, F., Nomoto, K., Kishimoto, N., Hix, W. R., & Thielemann, F.-K. 1999, ApJ, submitted
- Jha et al. (1999) Jha, S. et al. 1999, ApJ Suppl., astro-ph/9906220, in press
- Millard et al. (1999) Millard, J., Branch, D., Baron, E., Hatano, K., Fisher, A., Filippenko, A. V., Kirshner, R. P., Challis, P. M., Fransson, C., Panagia, N., Phillips, M. M., Sonneborn, G., Suntzeff, N. B., Wagoner, R. V., & Wheeler, J. C. 1999, ApJ, in press
- Nomoto et al. (1984) Nomoto, K., Thielemann, F.-K., & Yokoi, K. 1984, ApJ, 286, 644
- Nugent et al. (1997) Nugent, P., Baron, E., Branch, D., Fisher, A., & Hauschildt, P. 1997, ApJ, 485, 812
- Nugent et al. (1995) Nugent, P., Baron, E., Hauschildt, P., & Branch, D. 1995, ApJ, 441, L33
- Nugent (1997) Nugent, P. E. 1997, PhD thesis, University of Oklahoma
- Perlmutter et al. (1997a) Perlmutter, S. et al. 1997a, in Thermonuclear Supernovae, ed. P. Ruiz-Lapuente, R. Canal, & J. Isern (Dordrecht: Kluwer), 749
- Perlmutter et al. (1997b) Perlmutter, S. et al. 1997b, ApJ, 483, 565
- Perlmutter et al. (1999) —. 1999, ApJ, 517, 565
- Phillips (1993) Phillips, M. M. 1993, ApJ, 413, L105
- Riess et al. (1998) Riess, A. et al. 1998, AJ, 116, 1009
- Riess et al. (1996) Riess, A. G., Press, W. H., & Kirshner, R. P. 1996, ApJ, 473, 88
- Sutherland & Wheeler (1984) Sutherland, P. & Wheeler, J. C. 1984, ApJ, 280, 282
- Swartz et al. (1995) Swartz, D., Sutherland, P., & Harkness, R. 1995, ApJ, 446, 766
- Thielemann et al. (1986) Thielemann, F.-K., Nomoto, K., & Yokoi, K. 1986, A&A, 158, 17
- Tripp & Branch (1999) Tripp, R. & Branch, D. 1999, ApJ, in press