On the Continuum Shape of Broad Absorption Line Quasars
1. Introduction
In optically selected QSO samples, 10% are broad absorption line (BAL) QSOs (Weymann et al. 1991). BAL QSOs can be subdivided into high- and low-ionization (hi-BALs and lo-BALs) where hi-BALs have absorptions from high ionization species (N v, C iv, and Si iv) and lo-BALs, which make up only 10% of the BAL QSO population, have additional absorptions from low-ionization species (Al iii, Al ii, and sometimes Mg ii). In some cases lo-BALs also have Fe ii and Fe iii absorptions (iron lo-BALs).
Becker et al. (1997) reported the discovery of two new iron lo-BALs from radio-selected samples (FIRST survey; Becker et al. 1995) with one of the objects (1556+3517) showing severe extinction in the spectrum. Goodrich (1997) pointed out that a significant number of BAL QSOs are missed in optically selected samples due to attenuation of the continuum and that the true fraction of BAL QSOs might be as high as 30% instead of 10%. This could mean that these heavily reddened objects are more common among QSOs than previously thought.
The continuum shape of BAL QSOs is often flat or distorted compared to that of non-BAL QSOs (Weymann et al. 1991). Sprayberry and Foltz (1992) showed that the composite spectra of high- and low-ionization BAL QSOs can be brought into coincidence by dereddening the lo-BAL composite spectrum relative to the hi-BAL composite with appropriate extinction laws. This method shows only the tendency for lo-BALs to be redder than hi-BALs on average.
The present work describes a systematic method for estimating the amount of extinction for individual hi- and lo-BAL spectra. The systematic method for deriving extinction for all BAL QSO types allows a homogeneous comparison of the whole data set, which can also be extended to non-BAL QSO spectra. Section 2 describes the observational data and section 3 will introduce the dereddening procedure for BAL QSOs followed by results and discussions in section 4. Conclusions are shown in section 5.
Table 1. Main parameters of the program quasars.
| Object | BAL type | Extinction type | Ref. | |||
|---|---|---|---|---|---|---|
| 00040147 | 1.706 | hi–lo | 1.16 | 1.68 | silicate/SMC | b |
| 00180047 | 1.816 | hi | 1.37 | 1.72 | – | b |
| 00250151 | 2.072 | hi | 1.25 | 1.51 | SMC-LMC | a |
| 00510019 | 1.705 | hi | 1.23 | 1.31 | SMC-LMC | b |
| 00540200 | 1.868 | hi | 1.28 | 1.39 | LMC | b |
| 00592735 | 1.584 | iron | 1.09 | 1.33 | SMC | a,e |
| 01450416 | 2.029 | hi | 1.22 | 1.44 | SMC-LMC | a |
| 08403633∗ | 1.225 | iron | 1.01 | 1.16 | SMC | c,d,f |
| 09325010 | 1.914 | hi–lo | 1.30 | 1.75 | – | a |
| 10090222 | 1.343 | hi–lo | 1.11 | 1.57 | silicate/SMC | b |
| 12051436 | 1.629 | hi | 1.27 | 1.46 | SMC-LMC | a |
| 12081535 | 1.956 | hi | 1.37 | 1.44 | LMC-MW | a |
| 12121445 | 1.621 | hi | 1.22 | 1.44 | SMC-LMC | a |
| 12161103 | 1.615 | hi | 1.41 | 1.42 | LMC-MW | a |
| 12281216∗ | 1.408 | hi | 1.32 | 1.44 | LMC | b |
| 12390955 | 2.014 | hi | 1.27 | 1.96 | – | a |
| 13033080∗ | 1.760 | hi | 1.42 | 1.47 | LMC-MW | a |
| 13310108∗ | 1.867 | lo | 0.88 | 1.38 | silicate | a |
| 15563517∗ | 1.487 | iron | 0.60 | 0.27 | SMC | c |
| 16414115 | 2.005 | hi | 1.25 | 1.45 | SMC-LMC | a |
| 21542005 | 2.028 | hi | 1.38 | 1.68 | – | a |
| 22011834 | 1.817 | lo | 0.94 | 1.10 | silicate | a |
| 22022007 | 2.188 | lo | 1.21 | 1.83 | – | b |
| 22250534∗ | 1.981 | hi–lo | 1.15 | 1.09 | SMC-LMC | a |
| 23500045 | 1.626 | hi–lo | 1.28 | 1.53 | SMC-LMC | a |
| 23580216 | 1.854 | lo | 0.78 | 1.08 | silicate | b |
a: Weymann et al. (1991);
b: Korista et al. (1993);
c: Brotherton et al. (1997);
d: Becker et al. (1997)
e: Ogle (1997, private communication);
f: Wills (1998, private communication).
∗ Spectrum shown in figure 5.
2. Observational Data
The observational data consist of a total of 26 BAL QSO spectra; 15 objects are from Weymann et al. (1991), 8 from Korista et al. (1993), 2 from Brotherton et al. (1997), 1 from Ogle (1997, private communication) and parts of spectra from Becker et al. (1997) and Wills (1998, private communication) have kindly been made available by the authors. From the sample we chose only those spectra which had spectral coverage of all three bands defined below in order to do the colour measurements.
We divide the quasars into hi- and lo-BAL types (hi and lo in table 1), similar to the classification in Weymann et al. (1991). However, the classification for hi- and lo-BALs is somewhat ambiguous and for those cases where it is not clear which group an object belongs to we indicated this with “hi–lo”. Additionally we use the classification of the iron lo-BALs (iron in table 1) which was introduced by Becker et al. (1997). Table 1 (columns 1, 2, and 3) lists the names of the program BAL QSOs, the redshifts and the classifications of the objects.
3. Dereddening Procedure
The extinction laws used here are the Milky Way (MW), Large Magellanic Cloud (LMC), and Small Magellanic Cloud (SMC) from Pei (1992), the attenuation curve from Calzetti et al. (1994) and theoretical extinction curves for astronomical silicate with different grain sizes from Laor and Draine (1993).
3.1. The Unreddened Continuum
Sprayberry and Foltz (1992) established the idea for the existence of dust extinction in BAL QSOs by showing that lo-BALs are reddened relative to hi-BALs. We take a more general approach by comparing BAL QSOs with a representative non-BAL QSO sample. By comparing BAL QSO spectra with a single spectral shape we assume that all BAL QSOs are reddened relative to the representative spectrum, which can be understood as an “intrinsic quasar spectrum”. We refer to subsection 4.1 for discussion of the intrinsic quasar spectrum.
For the present investigation the following spectra are taken into consideration for determining the continuum shape of an unreddened QSO spectrum: (a) the composite spectrum from Francis et al. (1991; hereafter FSED), (b) the composite spectrum Zheng et al. (1997; hereafter ZSED), and (c) an artificially steepened FSED (hereafter FSED-plus) with the spectral index (defined by ) corresponding to between 1250 and 2100 Å and between 2100 and 3100 Å. We note that spectra of BAL QSOs are included in the composite spectrum from Francis et al. (1991) but the final spectral slope of the composite was chosen to have the median slope and thus the BAL continuum will hardly affect the final shape.
The spectral slopes of FSED-plus result from the following consideration: A comparison (e.g. figure 9 in Zheng et al. 1997) shows that FSED and ZSED have an almost identical continuum shape between 1250 Å and 2100 Å with . However, longward of 2100 Å the Francis et al. (1991) composite spectrum is harder with , whereas the Zheng et al. (1997) remains flat (). Examination of the distribution of spectral slope (Francis et al. 1991, figure 1) shows that has a wide spread around the median value of . Thus we can consider (soft spectrum) as a lower bound and (hard spectrum) as the upper bound for the spectral index for wavelengths Å. Our choice of FSED-plus together with the composite spectra FSED and ZSED should cover most of the range in the spectral index.
For the sake of clarity later in figure 5 we approximate the continuum shape of the composite spectrum FSED as a broken power-law with for 1200 Å 2100 Å and for 2100 Å. Note that all measurements are carried out on the composite spectra and not on the approximate power-law.
3.2. Definition of the Bands
We define three bands in the spectrum at restframe of the quasar around 1750 Å, 2100 Å, and 3000 Å. Measurement of the continuum level of BAL QSO spectra is difficult, since BAL spectra have numerous absorption lines of high- and low-ionization elements that arise in the broad and narrow line region of the quasar. Therefore, windows, which seem relatively free from either emission or absorption, were defined within the bands as follows:
- B1750:
-
at 1715–1735 Å and 1760–1780 Å
- B2100:
-
at 1980–2010 Å, 2125–2145 Å, and 2185–2195 Å
- B3000:
-
at 2880–2930 Å and 3030–3090 Å
The total coverage of the bands is Å with separation of 350 Å and 900 Å between the bands. This is sufficient to trace extinction effects in the UV region where the extinction curves rise steeply. However, the necessity for a wide spectral coverage restricts the number of objects which can be analyzed. Note that B2100 is located near to the 2175 Å feature of the Galactic extinction curve.
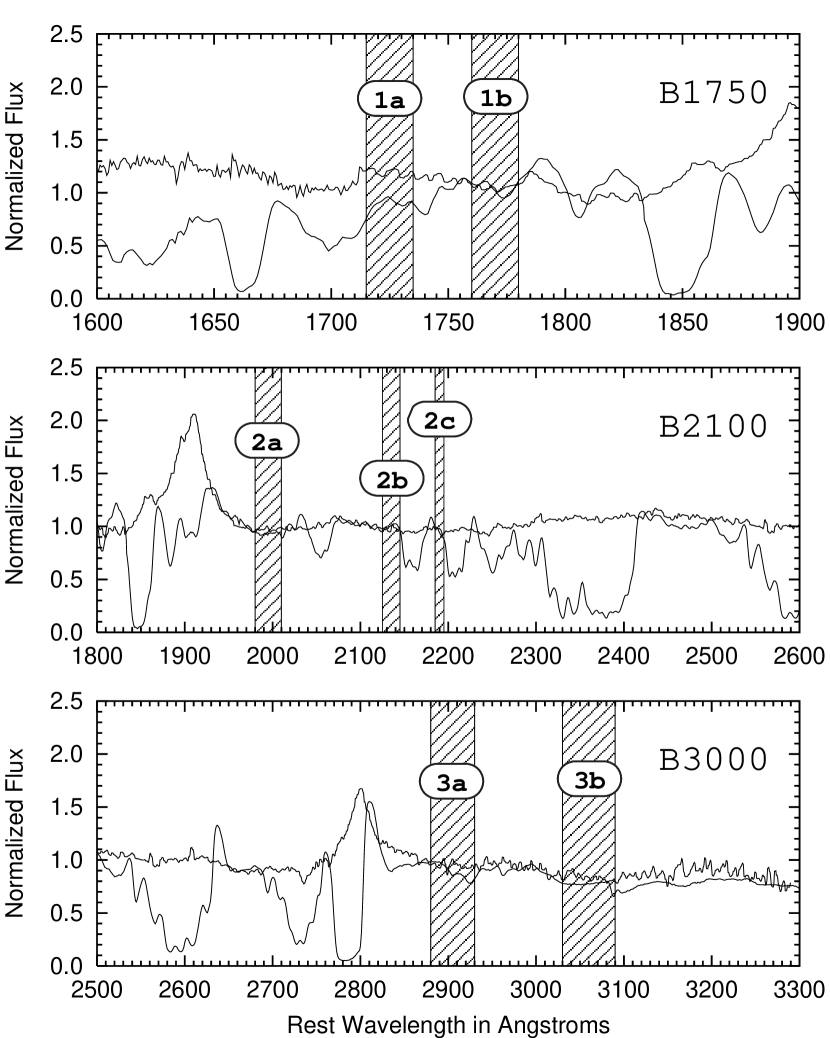
Figure 1 shows the position of the windows in the individual bands. As an example we show two BAL spectra, one which has relatively strong absorption lines of low and high ionization species (lo-BAL 0840+3633) and another, which has only high ionization lines (hi-BAL 22250534).

The choice of the windows can be summarized as follows:
Band around 1750 Å: (figure 1, upper panel) This band lies
between C iv and the semiforbidden emission line of C iii].
Two windows (1a) at 1715–1735 Å and (1b) 1760–1780 Å cover a
total of 40 Å.
The strong absorption lines are the singlet Al ii , the
doublets Si ii and
Al iii .
The Si ii line is only Å away (which corresponds
to a velocity of km s-1)
from window (1b) but the blueshift of broad absorption lines of Si ii seldom exceed velocities of 4 000 km s-1 and thus are unlikely to
affect the measurement in this window.
Al iii shows much stronger BALs.
However it is unlikely for the width of the absorption line to exceed
13 000 km s-1 which would diminish measurements in (1b).
The weaker features are absorptions from multiplet lines of Fe ii and
possibly Ni iii.
In strongly absorbed quasar spectra these weak emissions and absorptions
may have an effect on window (1a).
The emission-like feature around 1790 Å is caused by the Fe ii uv
191 transition.
Band around 2100 Å: (figure 1, middle panel) The second band lies between C iii] and Mg ii. Three windows at 1980–2010 Å, 2125–2145 Å, and 2185–2195 Å cover a total of 60 Å. This definition is close to the one used by Weymann et al. (1991). Window (2a) is positioned before the rise of the semiforbidden line emission of C iii] on the red side. The soft rise between (2a) and (2b) with its peak around 2070 Å is likely caused by emission from the Fe ii multiplet. This iron multiplet also shows BALs in some quasars but its absorption is unlikely to reach window (2a) which is 9 000 km s-1 away. The well-known strong multiplets of Fe ii uv 1, 64 (around 2600 Å) and Fe ii uv 2, 3, 35, 36 (around 2400 Å) produce deep blueshifted BALs in 0840+3633. The series of three strong absorptions is likely caused by Fe ii (around 2250 Å) and possibly Ni ii (around 2210 Å and 2170 Å). Windows (2b) and (2c) are set to avoid these spectral features.
Band around 3000 Å: (figure 1, lower panel) The third band is on the red side of Mg ii. Two windows at 2880–2930 Å and 3030–3090 Å cover a total of 110 Å. The main feature here is the emission lines of Mg ii . The continuum level around Mg ii is raised by numerous Fe ii multiplets and the Balmer continuum of hydrogen. Although the continuum to the red of Mg ii seems smooth, there appears a weak emission feature around 3000 Å, possibly caused by Fe ii, which varies in strength from object to object. Window (3a) is placed between Mg ii and this emission feature and (3b) is placed to the red side of the emission.
3.3. Calibration of the Diagnostic Diagram
The measurement of the fluxes , , and in the bands is obtained by integrating the spectrum over the windows and dividing it by the total width of the bands, i.e. average flux per Å. Although the windows have been carefully chosen, it is important to check e.g. for overlapping BALs when measuring the bands and to correct the measure if necessary.
Table 1 (columns 4 and 5) gives the derived colour indices which are defined as and . The two-colour diagnostic diagram (TCDD) is obtained by plotting colour indices as ()-pairs. The errors (shown in figure 2) are estimated by dividing the maximum difference of flux in a band with the square root of the number of bins within the integration interval.

The effects of reddening with the various extinction laws, including SMC, LMC, and MW type from Pei (1992) and astronomical silicate from Laor and Drain (1993), are investigated by applying them to the composite spectra from Francis et al. (1991) and Zheng et al. (1997). After reddening the composite spectra the intensities in the bands are determined with the same procedure as for the observed spectrum.
For simplicity, we use single grain size for the extinction curve of astronomical silicate where the following sizes are used (given is the logarithm of grain sizes in m): 3, 2, 1.5, 1.35, 1.25, and .75.
Numerous multiplet lines of iron-group elements can either depress the continuum or produce emission features in the bands and influence the measurements of the colour indices. Unfortunately, at this stage model calculations of the low-ionization region cannot provide hints of whether the continuum level in the bands is lowered or raised. At present, our definition of the colour indices provides a homogeneous measurement for all quasars, including lo-BALs, and yields a robust estimate of the continuum shape.
4. Results and Discussions
The extinction of the quasars can be obtained from the TCDD once the comparison spectrum for the diagram is chosen (see subsection 4.1). In order to distinguish the type of extinction more accurately we introduce a classification scheme for the determination of the extinction type in subsection 4.2. The information obtained from the TCDD is used to deredden the spectra and we show examples for six of the program quasars at the end of this section.
4.1. The Two-Colour Diagnostic Diagrams
Figure 2 shows the positions of the program quasars in the TCDD together with lines produced from FSED-plus (panel a), FSED (panel b), and ZSED (panel c) applying empirical extinction laws.
Figure 3 shows the same program quasars as in figure 2 but this time lines are produced by applying theoretical extinction curves of astronomical silicate with different grain sizes to FSED-plus, FSED, and ZSED (panels a, b, and c respectively). By comparing figures 2 and 3 it becomes apparent that intermediate and large grain sizes mimic the lines in figure 2 that are produced by SMC and LMC extinction law respectively. The region above the line produced by SMC in panel b of figure 2 may be explained by reddening FSED using extinction curves of astronomical silicate with small grain sizes.
The first thing to notice in figure 2 is that the bulk of observations have values which are higher than those derived from ZSED at the top where the curves join (figure 2 panel c). We attribute this to a poor representation of the flux around 3000 Å where the composite is derived from only a few quasars. The position of FSED in the TCDD, on the other hand, is at one of the bluest positions in the diagram (panel b). FSED-plus is further to the blue in the diagram (panel a) as expected since we chose a value resulting in the hardest (bluest) spectrum in our comparison.

Nonetheless, the upper sequence of observations (see e.g. figure 2 panel b, to the left of the SMC-line) implies the existence of a yet bluer quasar spectrum. Such an intrinsic spectrum would have a spectral slope which is harder than the Francis et al. (1991) composite. The artificially hardened FSED-plus is only one way to represent the intrinsic spectrum, however, it should be reminded that FSED-plus is only a hypothetical spectrum whereas FSED and ZSED are derived from observations and is therefore less desirable. Another method of obtaining the intrinsic spectrum of quasars is to take the steepest spectra from a quasar survey and construct a composite spectrum. If such an intrinsic spectrum exists it would mean that almost all quasar spectra observed are reddened by dust.
4.2. Determination of the Extinction Types
From the discussion above we conclude that the ZSED and FSED-plus are less suitable for representing the intrinsic shape of BAL QSOs. Therefore, the determination of the amount and type of extinction will be carried out using FSED.
Figure 4 shows the TCDD with lines for the case of Francis et al. (1991) composite spectrum when empirical extinction laws are applied. From the position of the curves that are produced using the SMC, LMC, and MW extinction laws we define the following classification for the extinction type: SMC, SMC-LMC, LMC, and LMC-MW. Additionally we define the “silicate” type for objects on the left of the SMC-line. We subdivide the regions between SMC, LMC, and MW and decide upon the positions of the objects in the TCDD between the extinction types. In cases where it does not seem clear whether the spectrum has silicate or SMC type extinction this was marked with “silicate/SMC” in table 1. Note that mainly provides information about the amount of dust while generally distinguishes between extinction types.
The lo-BALs with iron absorptions (00592735 and 08403633; open squares in figure 4) lie on the SMC-line. Within its errors, even the iron lo-BAL 15563517, which suffers severe extinction, lies near the SMC-line (see panel b of figure 2). An alternative solution for iron lo-BALs gives astronomical silicate with grain size of about 0.05 m. However, better agreement of the continuum level at shorter wavelengths between C iv and Si iv is achieved when the spectra are dereddened with the SMC extinction law.
The lo-BALs without iron absorption (13310108, 22022007 and 2358+0216; open circles in figure 4) have a peculiar continuum shape which neither of the empirical extinction laws can explain. In this case astronomical silicate with small grain size of about 0.03 to 0.04 m best reproduces the extinction in all three bands.
The hi–lo and hi-BALs, on the other hand, have a wider distribution near to the “origin” of the curves in the TCDD. However their small amount of extinction makes it difficult to uniquely distinguish the type of extinction.
Table 1 (column 6) shows the determined extinction type for each object. For those objects which have positions above the silicate-line (grain size 0.001 m) no extinction type could be derived and they have been marked with “–” in table 1.
Remarkable is that most of the observations in the TCDD do not lie on the curve produced with the MW extinction law. There are only two quasars that have extinction type LMC-MW in our sample. Since is very sensitive to the 2175 Å feature, we can conclude from the lack of MW type extinction objects that the 2175 Å bump is virtually absent in BAL QSOs. For the same reason, theoretical extinction curves of graphite grains (Laor, Drain 1993), which have pronounced features at around 2200 Å, are unsuitable for dereddening of BAL QSO spectra.
There is a clear division of the determined extinction laws (table 1) between lo-BALs and hi-BALs. This can be due to different viewing angles amongst various types of BAL QSOs (Yamamoto 1998) which means that the areas where the extinction occurs are in separate regions where different dust composition, grain size distribution, and physical conditions might affect the extinction law. It might also be due to a strong selection effect of the lo-BALs since only a few objects are known.
4.3. Extinction with Spatial Distribution of Dust
The spatial distribution of dust is regarded as important for determining the effect of extinction on the spectrum in the case of galaxies (e.g. Witt et al. 1992; Calzetti et al. 1994). In the case of quasars, however, there is only one continuum source with most of the continuum-forming region being too hot for dust to survive. Therefore, the uniform dust-screening model commonly used for stars might be the most suitable configuration of dust for investigations of extinction effects in quasars.
To demonstrate the robustness of the TCDD in the case of more arbitrary spatial distribution of the dust in extended regions, we apply the attenuation curve (AC) from Calzetti et al. (1994) to FSED. Figure 4 illustrates that the AC-line lies on the left side close to the SMC-line and shows that a more complicated configuration than simple screening does not significantly affect the shape of the lines in the diagram. We expect that more realistic treatment of the dust distribution around quasars and solution of the radiative transfer problem are unlikely to endanger our assumption of the dust screen model where the absorption occurs outside the BAL region.
4.4. Dereddening of Quasar Spectra
The method employed by Sprayberry and Foltz (1992) to show evidence for extinction in BAL QSOs used only composite spectra from Weymann et al. (1991). We show in our diagram (figure 4) that the composite spectra they used, namely the hi- and lo-BALs, are both affected by dust. This means that estimation of the extinction in lo-BALs was done with respect to the intrinsically reddened composite spectrum of hi-BALs and can only be regarded as a hint for dust extinction in quasars.
In our case the type and amount of intrinsic reddening of BAL QSOs are obtained from the TCDD by looking for the observed points’ nearest positions to the lines produced by the extinction laws. Since we apply only standard extinction laws (SMC, LMC, MW, and astronomical silicate) we assign, for simplicity, one type for the cases where positions in the TCDD indicate an intermediate type of extinction.
Several trials of the dereddening process were made for each object with the suggestion offered by the TCDD as first guess. In most cases, the extinction predicted by the TCDD gave satisfactory results. Then the spectra in the region around C iv and Si iv were examined for the quality of the fit and the amount of extinction slightly readjusted by eye to match the continuum level between C iv and Si iv. A more systematic fit would be possible if another band could be defined in this region. However, the continuum in this region is subjected to the C iv broad absorption line, whose maximal width strongly varies from object to object. This makes it impossible to define a band between C iv and Si iv that would serve for all BAL QSOs as a measure of the continuum level.
4.5. Examples of Dereddened Spectra
Six objects are chosen (marked with asterisk in table 1) for presentation of the dereddened spectra as follows: the object with the highest extinction (15563517) to show that the recovery of the spectrum works correctly for extreme cases; at intermediate extinction, representatives of various extinction types are chosen (22250534, 08403633, and 13310108, which we have determined to be LMC, SMC, and silicate type respectively) to show that spectra dereddened with the predicted extinction types indeed recover the overall shape of the spectrum; two are taken from the region with the highest population density in TCDD (12281216 and 13033080) with one of the objects near to the MW-line in figure 4.
Figure 5 shows dereddened and observed spectra together with the corresponding power-law continua. Numerous emission lines significantly change the local shape of the quasar continuum which cannot be presented with the power-law and therefore we show FSED in panel (a) as a guide of the continuum level.


The iron lo-BAL 08403633 in panel (a) was dereddened with SMC type extinction. The successful recovery of the spectrum shows that strong Mg ii and Fe ii absorption lines do marginally affect the measurements of the flux. It is striking to see that even the heavily extinct spectrum of 15563517 (panel b) can be recovered with the extinction values determined from the TCDD. The ratio of the flux in B2100 in this case between observed and dereddened spectrum is a factor of . For these two objects adjustment of to values slightly smaller than suggested by the TCDD was necessary.
The dereddened spectrum of the weakly extinct hi-BAL 12281216 (panel c) almost exactly matches FSED. The significantly stronger reddened hi-BAL 22250534 (panel d) for which the LMC type extinction curve was applied also is in good agreement when compared with FSED. Note that FSED is only shown in panel (a) of figure 5.
Dereddening of the hi-BAL 13033080 (panel e), which was classified as LMC-MW, with a MW type extinction law gave somewhat better results than did the LMC type. In the TCDD (figure 4) this object is closest to the MW-line for which measurable extinction could be derived. We show one example for astronomical silicate type extinction from our sample — 13310108 (panel f). In this case, dereddening with the extinction values derived from the TCDD also leads to satisfactory results. We note that dereddening of 13310108 with SMC type extinction law, as figure 2 (panel a) would suggest, cannot recover the region around C iv whereas the steep change in the silicate extinction curve in this region gives a better fit.
In general, better fits were achieved with the empirical extinction laws. The only exceptions from the whole quasar sample were 13310108, 22022007, and 2358+0216, for which only astronomical silicate with a grain size smaller than for the other objects could recover the hump-like shape of the continuum at around 1750 Å.
5. Conclusions
26 BAL QSOs have been analyzed in this paper for which we have defined bands to measure the flux and constructed a two-colour diagnostic diagram (TCDD). Based on the TCDD we introduced a classification scheme for the determination of the extinction type and estimation of the amount of extinction for individual objects. Using this information we can deredden observed spectra with standard extinction laws (SMC, LMC, MW, and astronomical silicate). From our investigation we draw the following conclusions:
For low-ionization BAL QSOs, the SMC type extinction law is appropriate for dereddening while the range of extinction laws for high-ionization BAL QSOs varies from Milky Way, LMC to SMC.
The TCDD also indicates that the Milky Way type extinction curve is not applicable for most of the BAL QSOs.
The Francis et al. (1991) composite spectrum is more suitable than Zheng et al. (1997) composite spectrum for the representation of the continuum shape of BAL QSOs.
The similarity of the shapes of BAL QSOs’ dereddened continua to those of non-BAL QSOs suggests that both types of quasar have the same kind of continuum source. This means that a representative non-BAL (normal) QSO spectrum such as the composite spectrum from Francis et al. (1991) might be appropriate for determining the continuum shape of incident radiation for the broad line region.
There is a hint of the existence of an “intrinsic” continuum shape of quasars that is bluer than the Francis et al. (1991) composite spectrum. This would imply that all quasars observed might have spectra that are reddened by dust.
We are grateful to M. S. Brotherton, P. M. Ogle, B. J. Wills, and R. J. Weymann for making available the observational data. We also like to thank P. J. Francis for having made available the composite spectrum from Francis et al. (1991). For valuable comments on the manuscript we thank E. J. Wampler, V. Korchagin, T. Nakajima, A. Kučinskas, and M. Iye. Finally, we would like to thank Y. McLean and T. Hoffmann for careful reading of the manuscript. This work was supported by the Japan Society for the Promotion of Science.
References
Becker R.H., Gregg M.D., Hook I.M., McMahon R.G., White R.L., Helfand D.J. 1997, ApJ 479, L93
Becker R.H., White R.L., Helfand D.J. 1995, ApJ 450, 559
Brotherton M.S., Tran H.D., van Breugel W., Dey A., Antonucci R. 1997, ApJ 487, L113
Calzetti D., Kinney A.L., Storchi-Bergmann T. 1994, ApJ 429, 582
Francis P.J., Hewett P.C., Foltz C.B., Chaffee F.H.,Weymann R.J., Morris S.L. 1991, ApJ 373, 465 (FSED)
Goodrich R.W. 1997, ApJ 474, 606
Korista K.T., Voit G.M., Morris S.L., Weymann R.J. 1993, ApJS 88, 357
Laor A., Draine B.T. 1993, ApJ 402, 441
Pei Y.C. 1992, ApJ 395, 130
Sprayberry D., Foltz C.B. 1992, ApJ 390, 39
Weymann R.J., Morris S.L., Foltz C.B., Hewett P.C. 1991, ApJ 373, 23
Witt A.N., Thronson H.A. Jr, Capuano J.M. Jr 1992, ApJ 393, 611
Yamamoto T. M. 1998, PhD Thesis, The University of Tokyo
Zheng W., Kriss G.A., Telfer R.C., Grimes J.P., Davidsen A.F. 1997, ApJ 476, 469 (ZSED)