08 (09.01.1; 09.04.1; 09.18.1)
\offprintsC. Moutou
11institutetext: (1) European Southern Observatory
Alonso de Cordoba 3107, Santiago, Chile
cmoutou@eso.org
(2) Astronomy Department, Ohio State University
174 West 18th Avenue, Columbus OH 43210, USA
sellgren@astronomy.ohio–state.edu
(3) Institut d’Astrophysique Spatiale, CNRS
Université Paris Sud, bâtiment 121
F-91405 Orsay, France
leger@iaslab.ias.fr,verstra@ias.fr
Upper limit on C60 and C features in the ISO-SWS spectrum of the reflection nebula NGC 7023 ††thanks: ISO is an ESA project with instruments funded by ESA Member States (especially the PI countries: the United Kingdom, France, the Netherlands, Germany), and with the participation of ISAS and NASA.
Abstract
We present here the 7.0 – 8.7 m spectrum of the bright reflection nebula NGC 7023. Our observations are made with the Short Wavelength Spectrometer (SWS) on the European satellite Infrared Space Observatory (ISO). The vibrational bands of the ionized fullerene C are expected at 7.11 and 7.51 m, while those of the neutral fullerene C60 are expected at 7.0 and 8.45 m. We estimate an upper limit in NGC 7023 for the C abundance of 0.26% of the interstellar abundance of carbon, while C60 contains 0.27% of interstellar carbon.
keywords:
Interstellar medium: molecules, extinction1 C60 and related compounds in the interstellar medium
Kroto et al. (1985) proposed that the fullerene molecule C60 and related species play an important role in interstellar physics and chemistry. This argument is based on the stability of the “buckyball” structure of fullerene compounds, as observed in the laboratory and confirmed by ab-initio calculations (see also Kroto 1987, 1988 and references therein). The formation mechanisms invoked to produce such spherical carbonaceous structures are usually based on reactions in circumstellar shells, with precursors such as acetylene and corannulene (Goeres and Seldmayr 1992; Kroto and Jura 1992; Bettens et al. 1997). Another way of obtaining fullerenes, together with polycyclic aromatic hydrocarbons (PAHs), is the photoerosion of larger hydrogenated amorphous carbon grains (Scott et al. 1997). Fullerene or fullerane species have been searched for at various wavelengths in interstellar spectra. They have also been proposed as explanations for many unidentified interstellar bands: the extinction bump at 2175 Å, the diffuse interstellar bands, the infrared emission features, and the extended red emission (Webster 1993a,b,c, 1996).
The C60 UV absorption spectrum shows a band at 3860 Å (Heath et al. 1987). Snow and Seab (1989) and Somerville and Bellis (1989) have searched for this feature without any clear evidence of its presence. They derived a C60 upper limit of the order of 0.01% of the cosmic carbon abundance in the diffuse medium, and approximately 0.7% of the carbon abundance in Mira stars.
More recently, Clayton et al. (1995) have searched for the infrared (IR) emission feature of C60 at 8.6 m in the spectra of R Coronae Borealis stars. No feature was seen in these carbon-rich, hydrogen-deficient stars to a level of 2% of the continuum. According to these authors, only the evolved carbon star IRC+10216 possibly shows a 8.6 m band that may be assigned to C60.
What is the dominant ionization state of C60 in the interstellar environment? We consider recent ionization models for PAHs (Bakes and Tielens 1995; Salama et al. 1996; Dartois and d’Hendecourt 1997). The comparison between PAHs and C60 is relevant, as the ionization potentials for C60 and PAHs of the same size are similar (see Table 2 in Leach 1995). The models conclude that a 60 atom PAH would be mostly neutral (PAH) and anionic (PAH-) in the diffuse medium, and cationic (PAH+) in more irradiated clouds such as reflection nebulae near a hot star. Only the model of Bakes and Tielens takes into account the second ionization stage (PAH++). In the standard PDR model they adopt, 50% of the 60 atom species would be singly ionized, 35% would be neutral and 15% doubly ionized. In the case of NGC 7023, the radiation field is 10 times fainter than in this model, so that the fraction of C is even lower and we shall ignore it hereafter. Laboratory work by Petrie et al. (1993) has shown that C is the most stable species among 60 atom fullerenes, because of its “exceptional unreactivity” with other interstellar material.
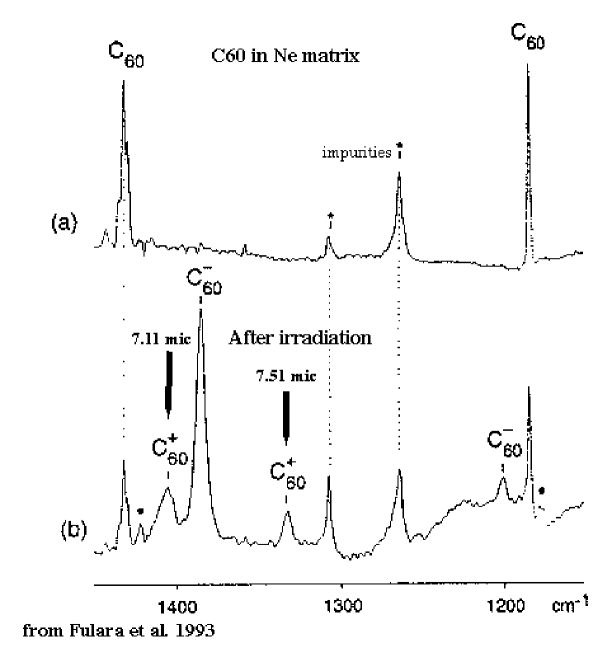
The cation C has been proposed as a diffuse interstellar band (DIB) carrier (Léger et al. 1988). It possesses electronic modes at wavelengths shorter than 1 m, identified by laboratory spectra in rare-gas matrices (Fulara et al. 1993), which were expected to be observed in absorption in the interstellar medium. Foing and Ehrenfreund (1994, 1997) have observed absorption features at 9577 and 9632 Å along a few lines of sight, which could correspond to these modes. This assignment of the two near-IR bands to C, however, is debated (Maier 1994, Jenniskens et al. 1997) and we will discuss this point carefully in section 2.
The C species would re-emit any energy absorbed from a neighboring star through its four IR modes. Two of these modes have been measured in the laboratory to fall at 7.11 and 7.51 m (Fulara et al. 1993). The goal of this paper is to search for the vibrational signature of C in the high signal-to-noise spectrum of the reflection nebula NGC 7023. We will also search for C60 bands, measured in the laboratory at 7.0 and 8.45 m (Krätschmer et al. 1990).
2 Abundance of C from its electronic transitions
The laboratory spectrum of C shows two electronic bands at 9583 and 9645 Å (10435 and 10368 cm-1) in a Neon matrix (Fulara et al. 1993). The corresponding absorption bands have been searched for in the interstellar medium (ISM), taking into account the wavelength shift induced by the matrix polarisability. The two new interstellar bands observed at 9577 and 9632 Å (10442 and 10382 cm-1) by Foing and Ehrenfreund (1994, 1997) have been tentatively assigned to the cation fullerene C. To deduce the abundance from the observations requires an estimation of the oscillator strength. The most reliable estimates ( = 0.003 – 0.006 from Fulara et al. 1993) lead to a total abundance of 0.6 to 1.2% of cosmic carbon in this species alone (Moutou et al. 1996a), if the C/H ratio is taken as the solar value (3.7 10-4). With a more recent estimate of the interstellar C/H value (2.6 10-4, Cardelli et al. 1996), C would contain 0.85 – 1.7% of carbon. This is significant in comparison with the estimated abundance of PAHs in the interstellar medium, which is 10 – 15% of cosmic carbon (Joblin et al. 1992, Sellgren et al. 1995, Jones et al. 1996, Dwek et al. 1997).
More recent observations of the 9577 and 9632 Å DIBs (Jenniskens et al. 1997) lead to a lower value of the measured equivalent width, and thus to a lower abundance range for C: 0.25 to 0.52% of interstellar carbon (with C/H from Cardelli et al. 1996). The reason for this disagreement is a different evaluation of the telluric contribution in the DIB profiles. Maier (1994) and Jenniskens et al. (1997) are both very cautious concerning the C identification, on the basis of: i) the absence of weaker bands in the ISM near 9400 Å, which are expected from the laboratory spectrum; ii) the difference in the intensity ratio of the two bands in the laboratory and in interstellar spectra; and iii) the larger shift in wavelength from the Neon matrix to the ISM compared to the wavelength shift between rare-gas matrices and the gas phase measured in similar molecules.
As an attempt to clarify this situation, we propose an alternate determination of the C abundance through its vibrational emission bands. Ionization models (Bakes and Tielens 1995) predict the neutral C60 abundance to be of the order of 0.7 times the C abundance.

3 C in the infrared
The IR laboratory spectrum of C has been measured in a Neon matrix (Fulara et al. 1993) and exhibits two bands at 7.11 and 7.51 m (1406 and 1331 cm-1). We reproduce the laboratory spectrum in Figure 2, courtesy of the authors. Two other bands are expected for symmetry reasons, but they have not been measured so far because their wavelengths are longer than the 16.7 m (600 cm-1) cutoff of the Fulara et al. experiment. The C features have widths of 0.05 m (10 cm-1) in the Neon matrix at low temperature. The ratio of the integrated cross-section of the 7.11 m band to the integrated cross-section of the 7.51 m band is measured to be 2.2 (Fulara et al. 1993).
The modes of neutral C60 are already known to lie at 7.0 and 8.45 m (1435 and 1190 cm-1; Krätschmer et al. 1990). Temperature-dependence studies have shown that at 1000 K a shift of 20 cm-1 could be expected (Nemes et al. 1994), compared to the cold neon matrix.
In a similar way, Joblin et al. (1995) have shown that the widths of PAH features measured in emission at high temperature in the laboratory are broadened by 0 to 0.1 m (0 to 20 cm-1) compared to absorption bands in a 4 K Neon matrix. They also emphasize that the observed wavelengths of PAH features shift to longer wavelength with increasing emission temperature. The amount of the wavelength shift varies between different vibrational modes of a PAH, but the redshift is in the range of 0 to 0.1 m (0 to 20 cm-1) compared to PAHs at low temperature. No experimental studies have been published for ionic PAH species. It can nevertheless be expected that C features are broadened and shifted by 0 to 20 cm-1 as well. The two C features we wish to detect are therefore expected to lie at 7.1 – 7.2 m and at 7.5 – 7.6 m.
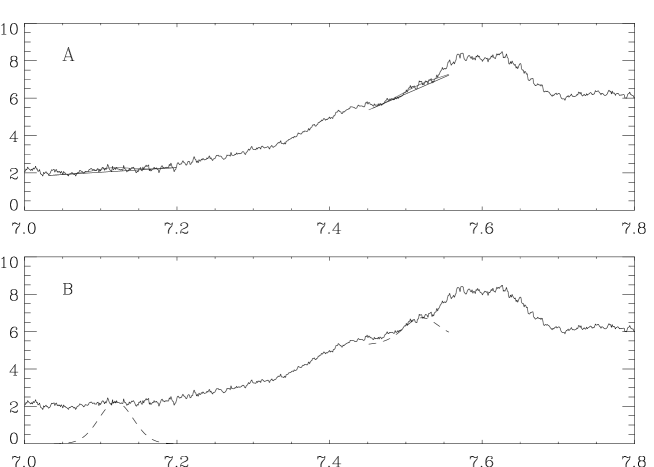
We have considered here two cases which are illustrated in Figure 3. In Case A, we assume that other carbonaceous species, such as PAHs or very small grains, emit the 6.2, 7.7, and 8.6 m emission features, and that the combined emission of these features can be treated as a local continuum. We will not address here the nature of these emitters. For Case A, we have searched for C features at 7.1 – 7.2 m and at 7.5 – 7.6 m as weak features above the local continuum defined by the blue side of the broad 7.7 m feature profile. In Case B, we assume that the broad 6.2, 7.7, and 8.6 m features are each made of many overlapping bands from individual aromatic molecules, and that two of the bands contributing to this emission complex could be due to C. The deduced abundance for C would be dramatically different between these two cases, as is shown in Figure 3. For both Case A and Case B, we adopt Gaussian profiles with a FWHM of 0.05 m for the two C bands, and we place the constraint on any possible C features that the ratio of the integrated cross-section of the 7.11 m band to the integrated cross-section of the 7.51 m band equal the laboratory value of 2.2 (Fulara et al. 1993). This constraint limits the maximum contribution of C, by requiring that in Case B the stronger of the two C features not exceed the total observed flux at 7.11 m in NGC 7023.
4 Observations and data reduction
The exciting star of the reflection nebula NGC 7023 is the Be star HD 200775, which has an effective temperature of 17000 K (Strom et al. 1972). For detailed reviews of previous studies of this object, see Lemaire et al. (1996) and Martini et al. (1997). Our SWS observations are higher spectral resolution than previously published mid-IR spectra of NGC 7023 from the Kuiper Airborne Observatory (Sellgren et al. 1985) and from ISO with ISOPHOT-S and ISOCAM (Laureijs et al. 1996; Cesarsky et al. 1996).
The data presented here were taken by the SWS spectrometer on board the ISO satellite (Kessler et al., 1996) during revolution 455 (February 13th, 1997). We used the partial grating scan mode (AOT6, band 2C) of the SWS instrument (de Graauw et al. 1996). The position angle of the major axis of the SWS rectangular aperture (14′′ 20′′ for the wavelength range observed here) was 258.5∘. The aperture is thus located at the southern edge of the northwestern filament observed by ISOCAM (as seen in the 6.2 to 11.3 m feature ratio, Cesarsky et al., 1996) and is parallel in orientation to this filament. In the SWS grating spectrometer, light is dispersed along the major axis.
Data gathered by the SWS spectrometer have a high redundancy: 12 detectors and two grating scan directions (UP and DOWN hereafter), for a total of 24 individual spectral scans. There are two grating steps per spectral resolution element (m); each spectral resolution element is thus observed independently 48 times.
To reduce the data, we used the current SWS-IA version running at the Institut d’Astrophysique Spatiale (last update: October 1997). The data reduction steps are summarized in de Graauw et al. (1996). The flux calibration was done with the file CAL25-2C-020. In the following, we detail our modifications to the standard reduction scheme in order to improve the signal-to-noise (S/N) ratio.
First, we removed glitches due to cosmic rays from the spectra. For the band 2C detectors, glitches rarely affect more than a single read-out (2 seconds). To detect glitches, we subtract a continuum (a sliding boxcar on 15 points, with 2- outliers rejected) from each of the 24 individual scans, to create individual high-frequency (HF) scans. The individual HF scans, which now contain unresolved lines, glitches and noise, are combined by wavelength. The combined HF spectrum has 48 points per resolution element; we smooth it with a 15-point sliding boxcar to improve our S/N on the combined HF signal while retaining enough spectral sampling to detect true HF features in the spectrum such as unresolved emission lines. We subtract the combined HF signal from each HF individual scan, leaving individual residual scans which in principle only contain noise and glitches. We finally remove glitches from each individual residual scan by 3- clipping, with determined locally from a 10-point sliding boxcar. Between 10 and 20% of the data points were identified as glitches.
Second, we removed correlated noise, due to weaker glitches (not necessarily due to cosmic rays like, e.g., electrical noise) which occur in all 12 detectors at the same time. Correlated noise is not always detected by the above glitch removal technique, and can result in a false spectral feature which appears broader than the spectral resolution (see Sellgren et al. 1999). To eliminate correlated noise, we subtracted a continuum from each scan to create individual HF scans, as described above, but then combined the HF scans in the time domain (at each reset point) rather than in the wavelength domain. We next subtracted from each individual HF scan the mean HF signal (after sigma-rejection) of all 12 detectors taken at each reset point. The individual continuum is subsequently restored into each corrected HF scan. Unresolved lines remain unaffected by this method as our sampling is dense enough. By applying this signal decorrelation, we reduced the rms noise by 5 to 15%.
The two operations described above, to correct for glitches and correlated noise, were performed just after flux calibration. As they were performed on the HF part of the signal they do not depend on flatfield quality.
The third step in the data reduction is the flatfielding. We used the standard SWS flatfielding routine to scale all individual scans to a reference. The reference is defined by a linear fit to all 12 DOWN scans. The scaling factor for each individual scan is defined as the reference divided by a linear fit to the individual scan. If an individual scan has some fit points close to zero, the scaling factor becomes large and the amplification of noise in the scan adversely affects the flatfield quality. To avoid this, we added a constant value (100 Jy) to all individual scans, performed the flatfield correction (multiplication by the scaling factors), then subtracted this constant value to produce the final flux level. The final average spectrum was produced with a sliding boxcar on a given binsize (0.0042 m or mean resolving power of 1900, Valentijn et al., 1996).
In order to be sure that the residual error includes any true differences between the UP and DOWN scans, we performed a second reduction in which we separated the UP and DOWN scans just before the flatfield operation. The two scan directions were then flatfielded completely independently. This was used only to calculate the residual error (UP DOWN)/2.
5 Estimate of the C upper limit
We will now derive an upper limit on the C and C60 abundances, for both Case A and Case B. For this purpose, we compare the observed spectrum of NGC 7023 to a calculated emission spectrum of C. This is more rigorous than extracting a relative value of C emission compared to the PAH emission, especially in the 7 – 8 m domain, where the spectroscopic match of PAHs to the interstellar data is not yet proved. We will first show the detailed calculation for C, and then apply it to C60.
5.1 Assumptions
The C absorption spectrum we adopt for modeling purposes reproduces the bandwidths and relative intensities measured in laboratory experiments (Fulara et al. 1993). We use the wavelengths and relative intensities of the long-wavelength modes in C60 (at 17.3 and 18.9 m) to approximate these modes in C, since the long-wavelength modes of C are predicted but not yet measured. We assume the wavelengths of the C modes do not depend on temperature, because we cannot predict this dependence (although any wavelength shift is probably less than 0.1 m). It is important to note that the power emitted in the C features does not depend on the absolute value of the IR cross-section. The reason for this is energy conservation; the total absorbed power is equal to the total emitted power, independent of the cooling time between UV photons.
According to the thermal model (Sellgren 1984, Léger et al. 1989), the excitation of a species after a single UV or visible photon absorption raises its vibrational temperature to a high value, determined by its size via the heat capacity. The emission results from the cooling by vibrational decay. To calculate the IR emission spectrum of C, we thus have to model its absorption of stellar light and its emission in the 7 m bands.
The total power absorbed by C molecules near a star is given by:
| (1) |
where is the illuminating stellar flux as a function of frequency , is the UV absorption cross-section per carbon atom for a C molecule, and is the number of carbon atoms in the observed source which are contained within C molecules.
The UV absorption cross-section of the C cation is not directly known from laboratory experiments. We therefore use the value measured from experiments on neutral PAHs, normalized to one carbon atom, as it seems to be similar for graphite and PAHs and thus characteristic of sp2 hybridized carbon (Joblin et al. 1992, Verstraete & Léger 1992). We note that the absorption cross-section for an ionized species is expected to be larger than for a neutral one, especially in the visible (Leach 1987). Our assumption thus probably underestimates the actual absorption, which is suitable for determining an upper limit of the species abundance.
The emitted spectral energy distribution, , depends on the infrared absorption cross-section as a function of wavelength, and the details of how the molecule cools after absorption of a visible or UV photon, as described by Léger et al. (1989). We define , the fraction of the total C emitted energy which is emitted in the C bands at 7.11 and 7.51 m, as
| (2) |
where the frequency limits and indicate an integration just over the 7.11 and 7.51 m bands. The total C emitted energy will include emission in the C bands at 7.11 and 7.51 m, emission in the C long-wavelength modes (approximated by the C60 modes at 17.3 and 18.9 m), and possibly also some unknown amount of fluorescence. Such fluorescence is observed in some neutral aromatic species (Negri & Zgierski 1994). The C fluorescence quantum yield is not known, and so we assume it is negligible. Including a finite amount of C fluorescence would have the effect of increasing our upper limit on the C abundance. Our calculations, ignoring fluorescence, find that the fraction of the total emitted energy from C is 35% at 7.11 m, 15% at 7.51 m, 10% at 17.3 m, and 40% at 18.9 m. This gives = 50% as the fraction of total C emitted energy resulting from emission at 7.11 and 7.51 m.
Energy conservation requires that = . To convert the emitted power spectrum from C to an observed total intensity spectrum, , we compare the power absorbed and re-emitted in the C bands to the power absorbed and re-emitted by dust grains, and . We derive from the integration of the SWS01 and LWS01 spectra of NGC 7023 (Sellgren et al. 1999), over the wavelength range 3 – 200 m. Our value of Idust given in Table 1, 1.0 10-3 W m-2 sr-1, is compatible with previous measurements (Whitcomb et al. 1981).
The power thermally emitted by the entire grain population is related to the total stellar flux absorbed by dust by:
| (3) |
where is the total number of hydrogen atoms, is the grain extinction cross-section normalized to one hydrogen atom, and is the grain albedo. We adopt the extinction curve of the diffuse interstellar medium and the associated albedo as given in Désert et al. (1990). We integrated over ten points in the UV-visible range.
The fraction of carbon locked up in C, , is then given by:
| (4) |
The first term in this equation is , the fraction of total C energy emitted at 7.11 and 7.51 m. The second term is the ratio of stellar flux absorbed per hydrogen atom by dust to the stellar flux absorbed per carbon atom by C. This term is effectively the ratio of the dust absorption cross-section to the C absorption cross-section, weighted by the stellar flux. The stellar flux is approximated by a black body emission spectrum at the effective temperature of HD 200775, i.e. 17,000 K. The third term is the interstellar carbon abundance, , as measured by Cardelli et al. (1996) in the local interstellar medium. The last term is our observed upper limit on the 7.11 and 7.51 m C emission, , divided by the observed total infrared emission from dust, . Our adopted values for all these terms used in Equation 4 are summarized in Table 1.
| 7.7 10-24 W C-1 | |
| 1.35 10-27 W H-1 | |
| 1.0 10-3 W m | |
| (Case A) | 2.0 10-7 W m |
| (Case B) | 1.9 10-6 W m |
| 2.6 10-4 |
5.2 Case A
Let us consider Case A, as presented in the top panel of Figure 3, where the two C bands are small bumps on top of a local continuum. We adopt a second-order local continuum and we fit each small bump with a Gaussian of 0.05 m FWHM. The residual emission at 7.11 and 7.51 m, after continuum subtraction, is only significant at the 2.5- level and thus we consider this to be an upper limit on the maximum integrated energy of any C features. We estimate this upper limit to be 2.0 10-7 W m-2 sr-1 for the sum of both bands. The deduced upper limit for Case A is 0.027% of carbon atoms contained in C towards NGC 7023 (equation 4).
5.3 Case B
We now consider the other extreme, Case B, where we place an upper limit on C as illustrated in Figure 3b. We again adopt Gaussians of width similar to those measured in the laboratory (FWHM 0.05 m), for both the 7.11 and 7.51 m bands, and require that the ratio of the integrated cross-section of the 7.11 m band to the integrated cross-section of the 7.51 m band equal the laboratory value of 2.2 (Fulara et al. 1993). These requirements for our Case B upper limit imply that all the emission at 7.11 m, but only part of the emission at 7.51 m, is due to C in the observed spectrum of NGC 7023.
For Case B, the upper limit on the total energy emitted by C at 7.11 and 7.51 m is 1.9 10-6 W m-2 sr-1. This leads to an upper limit on the C abundance of 0.26% of the interstellar carbon in NGC 7023.
5.4 Comparison of C abundances from different methods
Our Case B method gives an upper limit on the C abundance (0.26% of interstellar carbon) which is just compatible with the C abundance (0.25 – 0.52% of interstellar carbon) inferred from the DIBs observed at 9577 and 9632 Å by Jenniskens et al. (1997). Our Case B results, however, are significantly lower than the C abundance (0.85 – 1.7% of interstellar carbon) inferred from the DIB observations of Foing and Ehrenfreund (1994, 1997). Our upper limit on the C abundance from Case A (0.027% of interstellar carbon) is a factor of ten below the C abundances inferred from any of the DIB observations. We note that the identification of the 9577 and 9632 Å DIBs with C, however, is still debated (Foing and Ehrenfreund 1994, 1997; Maier 1994; Jenniskens et al. 1997). We also note that if the C fluorescence quantum yield, , is not negligible, it would raise both our Case A and Case B upper limits by a factor of (1 )-1.
In Case B, we assume that C is one of many narrow (FWHM 0.05 m) aromatic bands blended together to emit features at 6 – 9 m, as has been proposed in the PAH model (Léger & Puget 1984, Allamandola et al. 1985). If this view of the origin of the interstellar emission features at 6 – 9 m is correct, then this has the interesting implication that different aromatic species would be required to account for the entire 6 – 9 m emission complex. It is not clear, however, whether such a mix of aromatic molecules could also account for the underlying smooth continuum at 1 – 14 m, particularly in wavelength regimes where PAHs do not have vibrational transitions.
Our Case B upper limit on the C abundance is set simply by the total observed flux at 7.11 m in NGC 7023. If there are additional aromatic molecules which contribute to the observed flux at 7.11 m, as seems likely, then our upper limit to the C abundance of 0.26% of interstellar carbon is an overestimate.
5.5 Neutral C60
We also searched for the neutral C60 features near 7.0 – 7.1 and 8.45 – 8.6 m (Krätschmer et al. 1990, Nemes et al. 1994). We found no resolved emission features at the expected wavelengths. We estimate an upper limit on the neutral C60 abundance using the Case B method, by assuming that all of the the observed flux in NGC 7023 at 7.0 m is due to C60. We require that the ratio of the integrated cross-section of the 8.45 m band to the integrated cross-section of the 7.0 m band matches the experimental ratio of 0.75, and we assumed that the features were Gaussians with a width of 0.05 m. We find an upper limit on (Case B) of 2.0 10-6 W m. We follow the same procedure for C60 as for C, as our calculation did not make any corrections for the ionization state of the fullerene. This implies a Case B upper limit for the abundance of the neutral C60 molecule of of 0.27% of interstellar carbon.
Ionization models predict that the neutral C60 abundance should be 0.7 times the C abundance in the highly illuminated environment of a B star (Bakes and Tielens 1995). Our Case B upper limits on the abundances of C60 and C, respectively 0.27% and 0.26% of interstellar carbon, do not contradict the predictions of ionization models, as we do not detect either molecule in NGC 7023.
6 Conclusions
We have searched for the vibrational emission bands of C, at 7.11 and 7.51 m, and of C60, at 7.0 and 8.45 m, using a new ISO spectrum of the reflection nebula NGC 7023. We do not detect emission from either fullerene molecule, and we place upper limits on their abundances. Our upper limit on the C abundance, from the lack of observed vibrational emission, is independent of other estimates based on assigning diffuse interstellar bands at 9577 and 9632 Å to electronic absorption bands of C (Jenniskens et al. 1997, Foing & Ehrenfreund 1994, 1997).
If we assume that all of the flux observed toward NGC 7023 at 7.11 m is due to C, then we derive an upper limit on the C abundance of 0.26% of interstellar carbon toward NGC 7023. This upper limit is just compatible with the Jenniskens et al. (1997) observations, which imply 0.25 to 0.52% of interstellar carbon is in C, and is significantly below the C abundance inferred from Foing & Ehrenfreund (1994, 1997). If we instead assume that C would produce only a small bump on a local continuum due to the blue wing of the 7.7 m interstellar emission feature, then our upper limit on the C abundance, 0.027% of interstellar carbon, is a factor of ten less than the estimates from the 9577 and 9632 Å DIBs.
The apparent lack of C toward NGC 7023 is unlikely to be due to the ionization state of the fullerene. Our upper limit on C60, 0.27% of interstellar carbon, is comparable to our upper limit on C. Ionization models of aromatic hydrocarbons predict that the fraction of C is negligible in NGC 7023 (Bakes & Tielens 1995). These models also predict that the C fraction should be higher in NGC 7023 than in the diffuse medium where Foing & Ehrenfreund (1994, 1997) and Jenniskens et al. (1997) made their observations.
There are several possible explanations for why C is not detected toward NGC 7023 in the amount inferred from the near-IR DIB observations. It is possible that we have overestimated the fraction of energy absorbed by C which is re-radiated near 7 m, for instance if the C far-infrared modes are stronger than expected from data on C60, or if fluorescence is non-negligible. Also, while the 9577 and 9632 Å DIBs have not yet been observed toward the central star in NGC 7023, other DIBs are observed to be anomalously weak toward this star (Snow et al. 1995; Oudmaijer et al. 1997). Jenniskens et al. (1997) observe that the 9577 and 9632 Å DIBs follow the behavior of other DIBs (Jenniskens et al. 1994) in being significantly fainter in dense molecular clouds with strong UV irradiation. A third explanation is that the 9577 and 9632 Å DIBs are not due to C, as argued by Maier (1994) and Jenniskens et al. (1997).
New laboratory data will be critical to answering some of these questions. It is essential to obtain the near-IR gas-phase spectrum (0.94 to 1.0 m) of C, in order to confirm or deny the assignment of the 9577/9632 Å DIBs to C. It is important to measure the broadening and wavelength shift induced by temperature effects on the vibrational bands of C, which we can only estimate from laboratory measurements on similar molecules. It would also be useful to observe the full-range IR absorption spectrum of C to measure the relative cross-sections of all four vibrational bands.
We conclude that C60 related species do not appear
to be a dominant form of carbonaceous
species in the interstellar medium.
Confirmation of this result, as well as further searches for fullerene or
fullerane species in interstellar spectra, should be pursued at various
wavelengths.
Additional searches for the fullerene bands near 7 m in
circumstellar environments,
where C60 and related molecules could be formed,
could be particularly fruitful.
Acknowledgements: The Infrared Space Observatory is a project of the European Space Agency. We particularly thank the SWS operational team at Vilspa for their efforts to provide the calibration and data reduction systems. We gratefully acknowledge NATO Collaborative Research Grant 951347.
References
- [1] Allamandola, L.J., Tielens, A.G.G.M., & Barker, J.R., 1985, ApJL 290, L25
- [2] Bakes E.L.O. and Tielens A.G.G.M., 1995, ”The Diffuse Interstellar Bands”, eds. AGGM Tielens and TP Snow, p.315
- [3] Bettens R.P.A. & Herbst E. 1997, ApJ 478, 585
- [4] Cardelli J.A., Meyer D.M., Jura M. & Savage B.D., 1996, ApJ 467, 334
- [5] Cesarsky. D., Lequeux J., Abergel A. et al., 1996, A&A 315, L305
- [6] Clayton G.C., Kelly D.M., Lacy J.H., Little-Marenin I.R., Feldman P.A. & Bernath P.F. 1995, AJ 109, 2096
- [7] Dartois E. and d’Hendecourt L., 1997, A&A 323, 534
- [8] Désert F.X., Boulanger F. & Puget J.L., 1990, A&A 237, 215
- [9] de Graauw T., Haser L.N., Beintema D.A. et al., 1996, A&A 315, L49
- [10] Dwek E., Arendt R.G., Fixen D.J. et al., 1997, ApJ 475, 565
- [11] Foing B. and Ehrenfreund P., 1994, Nature 369, 296
- [12] Foing B. and Ehrenfreund P., 1997, A&A 317, L59
- [13] Fulara J., Jakobi M & Maier J.P., 1993, Chem. Phys. Letters 211, 227
- [14] Goeres, A. and Seldmayr, E. 1992, A&A 265, 216
- [15] Heath J.R., Curl R.F. & Smalley R.E. 1987, J. Chem. Phys. 87, 4236
- [16] Jenniskens P., Ehrenfreund P. and Foing B., 1994, A&A 281, 517
- [17] Jenniskens P., Mulas G., Porceddu I. & Benvenuti P. 1997, A&A 327, 337
- [18] Joblin C., Léger A., Martin P., 1992, ApJ 393, L79
- [19] Joblin C., Boissel P., Léger A., d’Hendecourt L., Défourneau D., 1995, A&A 299, 835
- [20] Jones A.P., Tielens A.G.G.M. & Hollenbach D.J., 1996, ApJ 469, 740
- [21] Kessler M., et al. 1996, A&A 315, L27
- [22] Krätschmer W., Lamb L.D. & Fostiropoulos K., 1990, Nature 347, 354
- [23] Kroto H.W., Heath J.R., O’Brien S.C., Curl R.F. & Smalley R.E., 1985, Nature 318, 162
- [24] Kroto H.W., 1987, in ”PAHs and Astrophysics”, eds. A. Léger, L. d’Hendecourt and N. Boccara, p.27
- [25] Kroto H.W., 1988, Science 242, 1139
- [26] Kroto H.W & Jura M., 1992, A&A 263, 275
- [27] Laureijs R.J., Acosta-Pulido J., Abraham P. et al. 1996, A&A 315, L313
- [28] Leach S. 1987, in ”PAHs and Astrophysics”, eds. A. Léger, L. d’Hendecourt and N. Boccara, p.99
- [29] Leach S., 1995, in ”The Diffuse Interstellar Bands”, eds. A.G.G.M. Tielens and T.P. Snow, p. 281
- [30] Léger, A., Puget, J.L. 1984, A&A 137, L5
- [31] Léger A., d’Hendecourt L., Verstraete L. & Schmidt W. 1988, A&A 203, 145
- [32] Léger A., d’Hendecourt L. & Défourneau D. 1989, A&A 216, 148
- [33] Lemaire J.L., Field D., Gerin M., Leach S., Pineau des Forêts Rostas, F. & Rouan D., 1996, A&A 308, 895
- [34] Maier J.P. 1994, Nature 370, 423
- [35] Martini P., Sellgren K. & Hora J.L., 1997, ApJ 484, 296
- [36] Moutou C., Léger A., d’Hendecourt L. & Maier J., 1996a, A&A 311, 968
- [37] Negri, F. & Zgierski, M.Z., 1994, J. Chem Phys 100, 1387
- [38] Nemes L., Ram S.R., Bernath P.F., et al., 1994, Chem. Physics Letters 218, 295
- [39] Oudmaijer R.D., Busfield, G., & Drew, J.E. 1997, MNRAS 291, 797
- [40] Petrie S., Javahery G. & Bohme D.K., 1993, A&A 271, 662
- [41] Salama F., Bakes E.L.O, Allamandola L.J. & Tielens A.G.G.M., 1996, ApJ 458, 621
- [42] Scott A., Duley W.W. & Pinho G.P., 1997, ApJ 489, L193
- [43] Sellgren K., 1984, ApJ 277, 623
- [44] Sellgren K., Allamandola L.J., Bregman J.D., Werner M.W. & Wooden D.H., 1985, ApJ 299, 416
- [45] Sellgren K., Brooke T. Y., Smith R. G., & Geballe T. R., 1995, ApJL 449, L69
- [46] Sellgren K. et al. 1999, in preparation
- [47] Snow T.P., Bakes E.L.O., Buss R.H., & Seab C.G. 1995, A&A 296, L37
- [48] Snow T.P. & Seab C.G. 1989, A&A 213, 291
- [49] Somerville W.B. & Bellis J.G. 1989, MNRAS 240, 41
- [50] Strom S.E., Strom K.M., Yost J., Carrasco L., Grasdalen G., 1972, ApJ 173, 353
- [51] Valentijn E.A., Feuchtgruber H., Kester D.J.M et al., 1996, A&A 315, L60
- [52] Verstraete L. and Léger A., 1992, A&A 266, 513
- [53] Webster A., 1993a, MNRAS 263, L55
- [54] Webster A., 1993b, MNRAS 264, 121
- [55] Webster A., 1993c, MNRAS 264, L1
- [56] Webster A., 1996, MNRAS 282, 1372
- [57] Whitcomb S.E., Gatley I., Hildebrand R.H., Keene J., Sellgren K. & Werner M.W., 1981, ApJ 246, 416