email: ehh@astro.noa.gr)
Discovery of metal line emission from the Red star in IP Peg during outburst maximum
Abstract
Observations of the eclipsing dwarf nova IP Peg during outburst reveal metal lines in emission, such as Mg II 4481 Å. Analysis using Doppler tomography locates emission of helium and metal lines on the inner Roche lobe of the secondary star. Such multi-line Roche-lobe imaging presents a new tool in mapping the red star’s ionization structure.
Key Words.:
cataclysmic variables, accretion disc, IP Pegasi1 Introduction
Cataclysmic variables are interacting binaries where a white dwarf and a red dwarf orbit each other within a few hours. Line emission from the red star is now regularly detected (Harlaftis and Marsh 1996, and references therein). During outburst of the eclipsing dwarf nova IP Peg, irradiation from the hot central regions of the disc is most likely responsible for the line emission located on the red star (Marsh and Horne 1990). During quiescence, H line emission from the red star of IP Peg is transient and its origin is unresolved (Harlaftis et al. 1994). The fast rotation of the red stars in cataclysmic variables and the regular irradiation of their atmosphere by the hot accretion disc present a physical situation which may affect, in the long term, the atmospheric stratification of the companion star and its subsequent evolution. Techniques for mapping either the surface of cool single stars from the absorption lines (Cameron 1999) or the surface of the red star in cataclysmic variables from the emission lines (Marsh and Horne 1988; Rutten and Dhillon 1994) have been developed. These techniques can be used in probing the ionization structure of the upper atmosphere of the red star. Here, we report on spectrophotometric observations of IP Peg, obtained with the 2.5m INT at La Palma, during maximum of the November 1996 outburst, which were aimed to probe the structure of the, recently discovered, spiral arms in the disc of IP Peg (Harlaftis et al. 1999). As a by-product of the observations, we discover metal lines in emission from the secondary star.

2 Doppler tomography
IP Peg is a well-studied, double-eclipsing dwarf nova, which shows semi-periodic outbursts every 3 months. For details on the observations and data reduction see Harlaftis et al. (1999). Average spectra, in the range 4354–4747 Å, at four characteristic binary phases are displayed in Fig. 1. In addition to the Bowen blend and He II 4686 lines, weak He I lines at 4388, 4471, 4713 Å Mg II 4481 Å and Ti II 4418 Å are also observed (see also trailed spectra in Fig. 2). These lines display a sharp peak at phase 0.5 indicating a component from the companion star. We adopt the binary ephemeris from Wolf et al. (1993) , where is the inferior conjunction of the white dwarf.
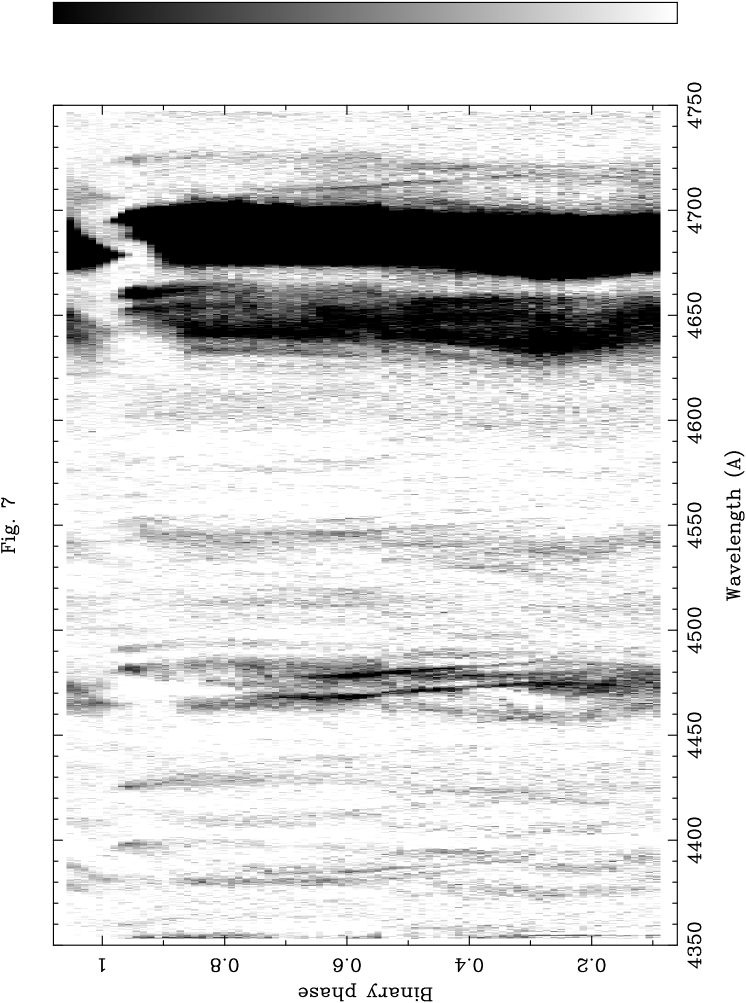
The trailed spectra over the full wavelength range are shown in Fig. 2 with the aim to display the motion of the weak lines (the intensity scale is adjusted so that He II line appears saturated). The disc and red star emission components are seen in the lines of He I 4388, He I 4472, Mg II 4481, the Bowen blend and the He I 4713. The red star component is the sharp ‘S’-wave moving from red to blue at phase 0.5. It can also be traced in the He II 4542 and the Ti II 4418 lines. Note that the Mg II ‘S’-wave component disappears earlier (binary phase 0.7) than that of the neighbouring He I 4472 (binary phase 0.75).
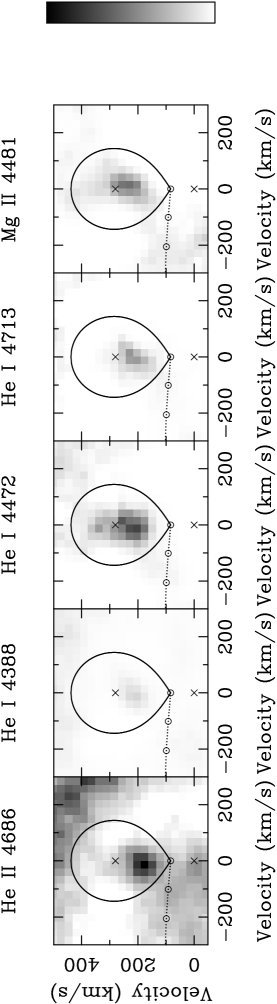
We reconstruct the Doppler images of the emission lines using the trailed spectra (Marsh and Horne 1988). A Doppler image is the reconstruction of the emission line distribution in velocity space and has been particularly successful in resolving the location of emission components such as the red star (IP Peg; Harlaftis et al. 1994), the gas stream (OY Car in outburst; Harlaftis and Marsh 1996), the bright spot (GS2000+25; Harlaftis et al. 1996) and spiral waves in the outer accretion disc (Steeghs, Harlaftis and Horne 1997; Harlaftis et al. 1999). We built the Doppler images of the emission lines (see above references for the procedure) and, after subtracting the axisymmetric disc emission, we can zoom onto the Roche lobe of the red star (Fig. 3 from left to right, high-ionization to low-ionization lines, He II 4686, He I 4388, He I 4472, He I 4713, Mg II 4481).
3 Line emission from the Red star
The line emission, on the Doppler images of Fig. 3, is stronger on the side of the red star facing the white dwarf and further it weakens towards the equator of the red star, indicative of screening by the disc. The He I maps show a relative strength similar to that seen in diffuse nebulae (weaker in 4388Å, stronger in 4472 Å; Kaler 1976). We measured the velocity locations of the peak intensities in the Doppler images using Gaussian fitting. There may be a systematic shift towards the L1 point with higher-ionization potential (see Table 1). As a consistency test for the properties of the “spots” being realistic, the velocity widths of the irradiated sites are indeed less than the rotational broadening of the companion star, km s-1 (1), which is obtained from the relation
where , and km s-1 (Wolf et al. 1998). The measured relative shifts between the wavelength-dependent irradiated sites are with respect to zero velocity (binary’s centre), therefore any uncertainties in the system parameters do not alter our conclusion.
In the past, similar emission has been interpreted as irradiation of the inner side of the red star by soft X-ray photons emitted by the boundary layer (Harlaftis & Marsh 1996 and references therein). The Roche lobe maps may suggest that there is temperature foreshortening or that the shadow cast by the disc on the companion star decreases with higher energy photons (Mg II, He I, He II). Indeed, the disc thickness may hinder efficient irradiation around L1 relative to the polar regions.
| ion | eV | km s-1 | |
|---|---|---|---|
| He II | 4686 | 54.4 | +18553 |
| He I | 4388 | 24.6 | +21632 |
| He I | 4472 | 24.6 | +21339 |
| He I | 4713 | 24.6 | +21844 |
| Mg II | 4481 | 15.0 | +24054 |
In this way, the red star emission can also be used to measure the thickness of the disc as seen by the soft X-rays which excite the line emission, independently of X-ray data. From the values in Table 1, the L1 region may mainly be clear of emission around 50 km s-1 (or 2 pixels) from the L1. This corresponds to a Roche lobe height of %, or , where is the binary separation (assuming q=0.6 and use of Table 3-1 in Kopal 1959). Therefore, there is potential to probe the vertical structure of the disc with higher quality data. Moreover, disc contamination and small-scale blurring caused by the Doppler tomography (which assumes isotropic emission from the orbital plane) are significant at that level and only improvement of the Doppler tomography technique combined with higher-resolution data will clarify better the ionization zones on the Roche lobe and the vertical disc height.
Acknowledgements.
The data reduction and analysis was partly carried out at the St. Andrews STARLINK node. Use of software developed by T. Marsh is acknowledged. ETH was supported by the TMR contract RT ERBFMBICT960971 of the European Union. ETH was partially supported by a joint research programme between the University of Athens, the British Council at Athens and the University of St. Andrews.References
- (1) Cameron A C., 1999, Proceedings of IAU Colloquium 170, Precise Stellar Radial Velocities, eds. J.B. Hearnshaw and C.D. Scarfe, ASP Conference Series, in press
- (2) Harlaftis E T., Marsh T R., Charles P A., Dhillon V S., 1994, MNRAS, 267, 473
- (3) Harlaftis E T., Marsh T R., 1996, A&A, 308, 97
- (4) Harlaftis E T., Horne K., Filippenko A V., 1996, PASP, 108, 762
- (5) Harlaftis E T., Steeghs D., Horne K., Martin E, Magazzu A., 1999, MNRAS, in press
- (6) Kaler J B., 1976, ApJSS, 31, 517
- (7) Kopal Z. 1959, Close Binary Systems, Chapman-Hall and John Wiley, London and New York
- (8) Marsh T R., Horne K., 1988, MNRAS, 235, 269
- (9) Marsh T R., Horne K., 1990, ApJ, 349, 593
- (10) Rutten R G M., Dhillon V S., 1994, A&A, 288, 773
- (11) Steeghs D., Harlaftis E T., Horne K., 1997, MNRAS, 290, L28
- (12) Wolf S., Mantel K H., Horne K., Barwig H., Schoembs R., Baernbanter O., 1993, A&A, 273, 160