Bull. Spec. Astrophys. Obs.,1998, 45, 147-153
NEWS
Optical monitoring of CI Cam after
the X–ray burst
on April 1, 1998
Abstract
Results of optical spectral monitoring of CI Cam just after its a unusual bright and rapidly evolving X-ray burst are reported. This star is a symbiotic-type X-ray binary. The X-ray–radio–optical burst and the appearance of relativistic S-shaped SS433-like jets make CI Cam to be a very interesting star. We observed emergence of a high excitation and variable emission line spectrum, with broad components of hydrogen and helium lines and the nebular forbidden line of NII. All this agrees well with the formation of relativistic jets in the burst. It was concluded that the burst resulted in destruction of external stationary accretion disk regions. The peak X-ray luminosity is erg/s at the adopted distance of 1 kpc. It is well below the Eddington luminosity, which is necessary for jet production in a supercritical accretion disk. We propose that jets were formed in a collimated accretion–ejection process in a strong magnetic field of a neutron star.
Key words: symbiotic stars, X-ray binaries, relativistic jets
X-ray burst on April 1
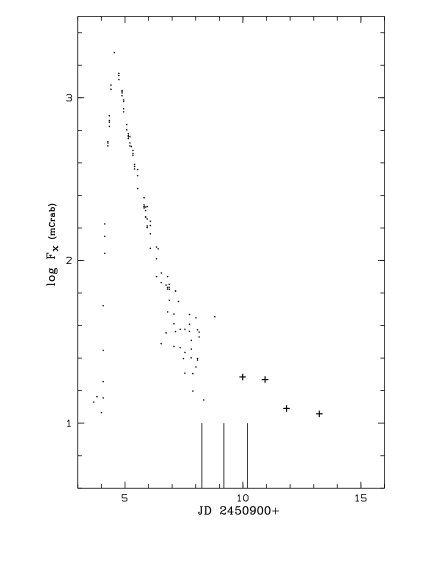
The bright and rapidly rising transient X-ray source XTE J0421+560 was detected by the RXTE observatory in All Sky Monitor (ASM) observations on March 31, 1998 (Smith et al., 1998). Having a flux less than 40 mCr in 2–12 keV band on March 31.36 UT, this source has brightened up to 2 Crabs on April 1.04 according to the RXTE data. The CGRO/BATSE ASM observed even a more rapid brightening of this source in 20–100 keV band — from less than 55 mCr on March 31.03 – 31.84 to 470 mCr on March 31.91 (Harmon et al., 1998; Paciesas and Fishman, 1998). Such an extremely fast rise for a few hours is very unusual. Moreover it was followed by a very fast fading (Fig. 1). Both the BeppoSAX (Orlandini et al., 1998) and ASCA (Ueda et al., 1998) monitoring observations on April 3–4 showed the X–ray flux to decrease 40–50 times, and a gradual flux fading was detected with an e–folding decay time of about 1 day.
Beginning from April 1.9 a radio counterpart of XTE J0421+560 was discovered in VLA observations (Hjellming and Mioduszewski, 1998a) at a level of about 12 mJy at 1.4 GHz. The source brightened rapidly and reached a level of 120 mJy at 1.4 GHz on April 3.83 (Hjellming and Mioduszewski, 1998b). This date the source size was less than 01 at 22.5 GHz. The spectrum slope and the rapid variability by factors of about 6, 3 and 2.3 at 1.4, 4.9 and 8.4 GHz, respectively (Hjellming and Mioduszewski, 1998b), indicated that this is synchrotron radio emission. A “core plus jet” radio source was detected on the VLA image obtained on April 5.08 (Hjellming and Mioduszewski, 1998c). Basing on VLA images of this object, Hjellming and Mioduszewski (1998c) have reported that beginning from April 5.08 the source was resolved, and the extended emission became apparent. It had the appearance of a symmetrical S-shaped twin-jet, strikingly similar to the radio jets of SS 433. The apparent velocity of the outermost pair of emission components was found to be very high, on average of 54 mas/day. The SS 433-like rotating corkscrew emission pattern was fitted with a velocity in the range 0.3 c to 0.4 c at the adopted distance of 1 kpc. This SS 433 jet-like mode of behaviour distinguishes this transient X-ray star as a very important target for relativistic stellar astrophysics. The derived jet velocity evidences that the source of jets is a relativistic object — a neutron star or a black hole.
This X-ray radio source has been identified by Wagner and Starrfield (1998) with the well-known symbiotic star CI Cam ( MWC 84) (Merrill, 1933; Chkhikvadze, 1970; Downes, 1984; Bergner et al., 1995; Miroshnichenko, 1995). It was also considered to be a B[e] star. The identification was proved by Wagner and Starrfield (1998) spectrum on April 3.145, where the strong HeII 4686 line was detected. Otherwise the spectrum was similar to that obtained in January 1984 by Downes (1984) and described previously by Merrill (1933). The HeII line had not been detected at all in the previous studies. Another photometric and spectroscopic study (Garcia et al., 1998) was carried out on April 3.08–3.17. Garcia et al. have confirmed the spectrum similarity to that of Downes (1984), but the intensity of FeII and HeI emisson lines has increased in comparison with hydrogen Balmer lines. The forest of strong H, HeI, FeII emission lines obscured the continuum to the extent that it is unclear if any photospheric absorption lines were present. Garcia et al. (1998) found , which implies a brightening of about 24 and 23, respectively in comparison with the pre-burst level (Bergner et al., 1995; Miroshnichenko, 1995). The usual star brightness in V was and in B . It was quite surprising that during the object’s burst and brightening the colour index did not change. UBVRI photometry obtained by Hynes et al. (1998) on April 3.87 showed that the star faded by 05 in V and B bands during 18 hours. The index B–V was again the same as that in a quiescent state of the object (Bergner et al., 1995).
| Date | JDa | S/N | N | ||
| Å | Å | ||||
| 1998 Apr 4 | 08.26 | 3800–6100 | 4 | 40 | 2 |
| 5000–7400 | 1 | ||||
| 1998 Apr 5 | 09.19 | 3800-6100 | 4 | 20 | 1 |
| 5000-7400 | 1 | ||||
| 1998 Apr 6 | 10.20 | 3800-6100 | 4 | 50 | 2 |
| 5000-7400 | 3 | ||||
| 1998 Apr 19 | 23.25 | 3800-6100 | 7 | 30 | 2 |
| 5000-7400 | 2 | ||||
| 1998 May 16 | 50.30 | 3800-6100 | 4 | 50 | 2 |
| 5000-7400 | 2 | ||||
| [a] JD (2,450,900.00 +) | |||||
Observations
The observations were carried out with the 6 m telescope of the Special Astrophysical Observatory (SAO RAS) on April 4, 5, 6, 19 and May 16, 1998. The medium resolution spectrograph SP–124 was used at the Nasmyth-1 focus with the UAGS camera and Photometrix CCD PM1024 (m pixel size) in all observations. The spatial scale along the slit was equal to /pixel, the length of the slit was about , the slit width was set to . The grating B1 with 600 grooves/mm produced the scale along the dispersion 2.4 Å/pixel with a spectral resolution of approximately 4 Å (FWHM) in the spectral region from 3700 to 7500 Å. For data acquisition the system NICE under MIDAS (Kniazev and Shergin, 1995) was used.
All spectra were reduced using the MIDAS context LONG (95NOV version) adopted to perform automatic mode reduction. Primary 2–D CCD images were converted to 1–D spectra after correction for the dark noise, debiasing and sky subtraction. He–Ne–Ar source was used to transform 2-D spectra to a linear wavelength scale. For the dates April 4, 5, 6 spectrophotometric standards were observed, the data were flux-calibrated and corrected for atmospheric extinction.
The summary of observations — wavelength range, spectral resolution, S/N ratio of individual spectra and number of spectra are shown in Table 1.
Results
The first observations were carried out on April 4.75,1998, 1.6 days after the observations by Wagner and Starrfield (1998) and Garcia et al. (1998), and accordingly 3.7 days after the X-ray burst maximum. The moments of our observations are marked in Fig. 1 by vertical bars. We show only our first three dates as after the date JD 2450913 the X-ray flux was at the level of measurement errors.
Our spectral observations were made when the object X-ray flux faded at least by two orders of magnitude. The X-ray light curve was obtained in the RXTE ASM observations (see htpp://space.mit.edu/XTE/asmlc/srcs/data).
For each of the dates the observations consist of one or two spectra in red and blue wavelength range with an exposure time from 5 to 10 minutes. The data on April 19, 1998 consist, in addition to these ordinary mode spectra, also of 30 “time-resolved” 10-second exposure spectra. An analysis of the rapid spectral variability of CI Cam will be presented later elsewhere. Here we present the overall description of the spectrum and its variability from date to date.
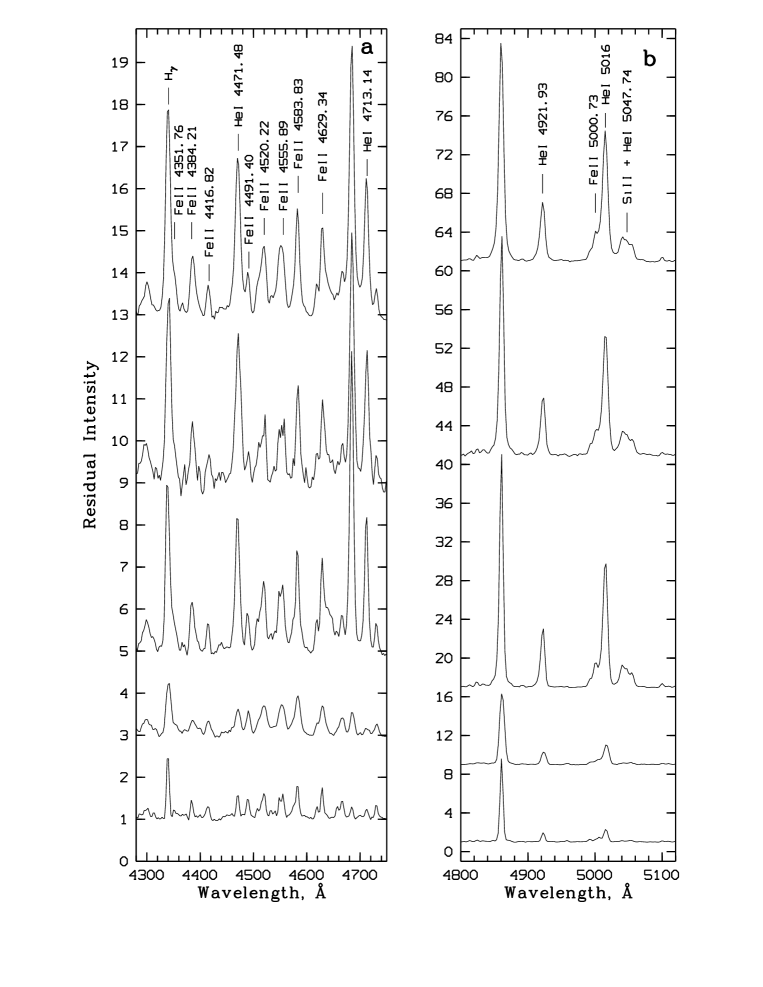
In Fig. 2 fragments of normalized spectra obtained on April 4, 5, 6, 19 and May 16 (from top to bottom) are presented. All the spectra in each separate wavelength range are shown on the same scale for convenience. It is obvious that the spectrum excitation decreases with time. The HeII emission line (Fig. 2a), being strong in the beginning of April, practically has disappeared in the May 16 spectrum. The same is correct for HeII . Note that the spectrum on April 19 is of about twice worse resolution than the spectra on other dates. HeI line intensities decrease faster than those of hydrogen lines.
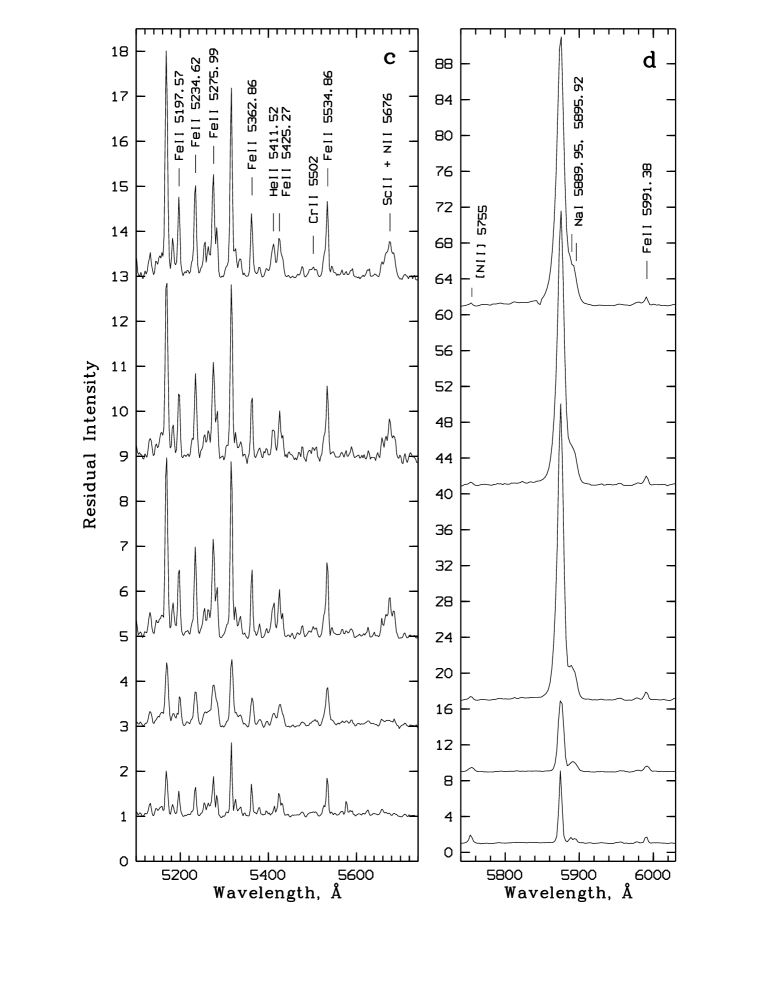
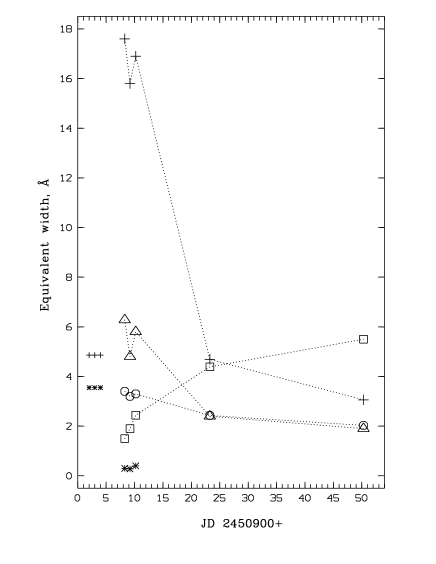
The strong variability of SiII + HeI + CII blend (Fig. 2b) is clearly seen. This blend seems to disappear in the April 19 and May 16 spectra. We estimate that the contribution of the SiII lines is about 80 % of the flux in this blend, while the HeI line contributes no more than 20 %. So the fast fading in intensity of this blend is caused by the behaviour of the SiII lines. The similar variability is seen in Fig. 2c for the blend ScII + NII + FeII . For this blend we estimate that about 50 % of the flux is from the NII line and about the same fraction is in the ScII lines.
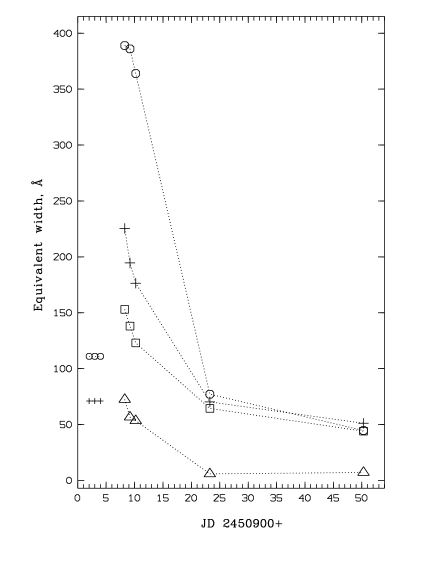
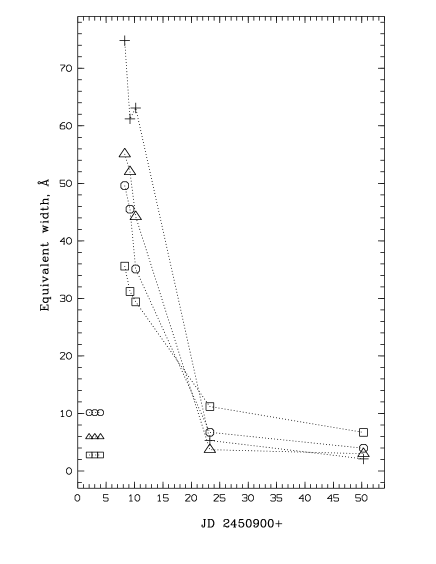
Fig. 2a, c demonstrate very bright and rich FeII spectrum. The intensities of FeII lines decrease with time, but the fading rate depends on the line multiplet number and excitation conditions. For example, the FeII line, being the strongest iron line just after the burst, became weaker than the FeII line at the end of the observing run. Another example one can see in Fig. 2d, where the intensity of the blend [NII] + FeII + NII even rises with time.
The line profile widths are observed to be different in the lines of different excitation. Hydrogen and HeI lines have narrow and broad components. This is clearly seen on the strongest and unblended lines H and HeI (Fig. 2). The narrow component widths are about 400 km/s (corrected for the instrumental line width) at the beginning of observations, and they decrease to about 200 km/s at the end of observations. The broad components decrease rapidly in intensity, but their widths remain approximately the same, about 1200 km/s. FeII, TiII and other lines all show only narrow components.
In our spectra we certainly see some faint narrow absorption lines. Nevertheless we do not confirm the absorption lines of CaI, CoI, NiI, CrII and others reported by Miroshnichenko (1995). It could be due to real variability of the spectrum during the burst. Alternatively it could be due to the difference in the quality of the spectra which we compare. Our analysis of the absorption spectrum is still in progress.
The excitation level in the after-burst spectra decreases with time. In Fig. 3 we show the equivalent widths of total profiles of H and HeI lines. In two weeks after the burst the H intensity became about the same as in the quiescent state of the spectrum observed by Downes (1984). It is very interesting, however, that the HeI intensity dropped to a considerably lower level than that observed in the quiescent state. This could be a consequence of two different reasons:
-
1.
The burst broke down the line forming region (outer parts of the accretion disk?).
-
2.
The line forming region became more optically thick in these particular lines because of the burst.
From April 4 to 19 the strongest drops were observed in H broad component (by a factor of 12.5) and in the SiII blend (by a factor of 14.9, Fig. 4). Very strong fading was also observed in the high excitation lines HeII (a factor of 14.1), HeI (a factor of 7.4) and HeI 5876 (a factor of 5.1). The H narrow component (Fig. 3) and FeII 5169 line (Fig. 4) show a moderate drop (by factors of 2.4 and 3.0).
We conclude that the X-ray burst resulted both in creation of the broad line region with fast moving material and in significant heating of the existing narrow line region. The line broadening is probably caused by Doppler motion of emitting gas, but not by electron scattering in the optically thick envelope. This is because of the fact that on April 19 we observed both the broad component fading and the drop in helium lines (total profile) below the standard quiescent level. For the same reason one can conclude that the second scenario of the two mentioned above is hardly probable. So the outer parts of the accretion disk could be destroyed (or squeezed?) because of the burst.
The strong drop in the intensity of SiII lines (Fig. 4) is not easy to understand. It could be connected with some fluorescent process. We have mentioned above the remarkable behaviour of the [NII] emission line whose intensity rises after the burst (Fig. 5). This indicates that an extended envelope has appeared. It is very important to search for other forbidden lines in the CI Cam spectrum. The [NII] line is blended in its blue wing with the lines FeII + NII . These two lines are very weak in our spectra. Their intensity is 10 times less than that obtained from the spectrum of Downes (1984) and it slightly rises with time after the burst.
All the data obtained from the optical monitoring — emergence of the high excitation spectrum, the broad line region, and even the nebular forbidden line region are in good agreement with the formation of relativistic jets in the burst. But the main mechanism of the jet formation is still unclear. It is important that the peak X-ray luminosity in 2–10 keV region is erg/s at the adopted distance of 1 kpc. It is well below the Eddington luminosity, which is necessary for jet production in a supercritical accretion disk, similar to that we directly observe in SS 433 (Fabrika, 1997). An alternative mechanism looks very promising — the collimated accretion–ejection process in strong magnetic field of a neutron star.
The X-ray–radio–optical burst and the appearance of relativistic S-shaped SS 433-like jets make CI Cam to be a very interesting star. The emergence of high excitation spectrum in the burst implies that this star is an unusual symbiotic-type X-ray binary, probably like GX 1+4 (Chakrabarty and Roche, 1997). It is very important to continue observations of CI Cam, which gives us a chance to study the “jet forming machine on holiday”.
-
Acknowledgements.
The work was supported by the RFBR grant N 96-02-16396.
References
- [1] Bergner Yu.K., Miroshnichenko A.S., Yudin R.V., Kuratov K.S., Mukanov D.B., Shejkina T.A., 1995, Astron. Astrophys. Suppl. Ser.,112, 221
- [2] Chakrabarty D., Roche P., 1997, Astrophys. J., 489, 254
- [3] Chkhikvadze I.N., 1970, Astrofizika, 6, 65
- [4] Downes R.A., 1984, Publ. Astr. Soc. Pacific, 96, 807
- [5] Fabrika S.N., 1997, Astrophys. Space Sci., 252, 439
- [6] Garcia M.R., Berlind P, Barton E, McClintock J.E., Callanan P.J., McCarthy J, 1998, IAU Circ. 6865
- [7] Harmon B.A., Fishman G.J., Paciesas W.S., 1998, IAU Circ. 6874
- [8] Hjellming R.M., Mioduszewski A.J., 1998a, IAU Circ. 6857
- [9] Hjellming R.M., Mioduszewski A.J., 1998b, IAU Circ. 6862
- [10] Hjellming R.M., Mioduszewski A.J., 1998c, IAU Circ. 6872
- [11] Hynes R.I., Roche P, Haswell C.A., Telting J, Lehnert M., Simis Y., 1998, IAU Circ. 6871
- [12] Kniazev A.Yu., Shergin V.S., 1995, SAO Report, No. 239
- [13] Merrill P.W., 1933, Astrophys. J., 77, 44
- [14] Miroshnichenko A.S., 1995, Astron. and Astrophys. Trans., 6, 251
- [15] Orlandini M., Dal Fiume D., Frontera F., Antonelli L.A., Piro L., Parmar A.N., 1998, IAU Circ. 6868
- [16] Paciesas W., Fishman G., 1998, IAU Circ. 6856
- [17] Smith D., Remillard R., Swank J., Takeshima T., Smith E., 1998, IAU Circ. 6855
- [18] Ueda Y., Ishida M., Inoue H., Dotani T, Lewin W.H.G., Greiner J., 1998, IAU Circ. 6872
- [19] Wagner R.M., Starrfield S.G., 1998, IAU Circ. 6857