Probing distant galaxies with lensing clusters \toctitleProbing distant galaxies with lensing clusters
F-31400 Toulouse, France
*
Abstract
Clusters of galaxies as gravitational lenses allow to study the stellar content and properties of high-z galaxies much fainter than the usual spectroscopic field surveys. We review the recent results obtained on the identification and study of very distant galaxies seen through lensing clusters. Using the gravitational amplification effect in lenses with well known mass distributions, it is possible to build up and study a sample of galaxies with . Source candidates are selected close to the critical lines at high-z, through photometric redshifts computed on a large wavelength interval, as well as lens-inversion criteria. This procedure allows to reduce the selection biases in luminosity, and towards active star-forming objects, provided that selection criteria include IR photometry. This is the method presently used in our large collaborative program, aimimg to perform the spectroscopic follow up with the VLT of high-z candidates selected from suitable photometric campaigns.
1 The Gravitational Telescope
The identification and study of high-z galaxies is probably one of the most direct methods to constrain the scenarios of galaxy formation and evolution. With respect to large field surveys, cluster lenses can be used to build up an independent and complementary sample of distant galaxies, because of their lensing properties. The major bonus is the amplification close to the critical lines, which is 1 to 3 magnitudes depending on location (see [6] for a review). The expected 2D distribution of arclets (mean redshift and surface density) can be easily obtained for lenses with well known mass-distributions ([2]). These clusters are used here as Gravitational Telescopes .
The first lensed galaxy confirmed at was the spectacular blue arc in Cl2244-02 ([10]). Recent examples of highly magnified galaxies, identified either purposely or serendipitously, strongly encourages this approach: the star-forming source in A2218, at z=2.51 ([4]), the luminous z=2.7 galaxy behind MS1512+36 ([17]), three z 4 galaxies in Cl0939+47 ([16]), a z=4.92 system in Cl1358+62 ([7], [14]), the z=2.72 arc behind MS1512+36 ([13]), and the two red galaxies at in A2390 ([8], [12]). We present the method proposed by the Gravitational Telescope Program (hereafter, GT) to access the distant population of galaxies and some illustrative results.
2 The Method
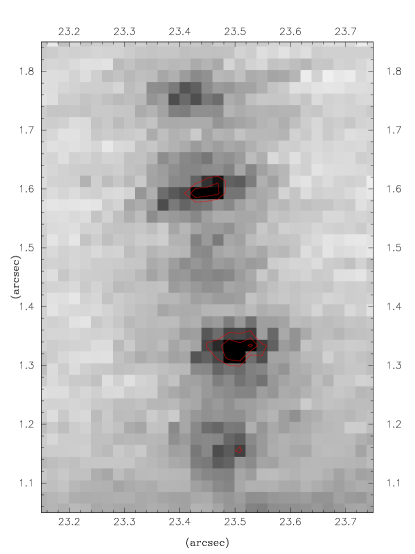
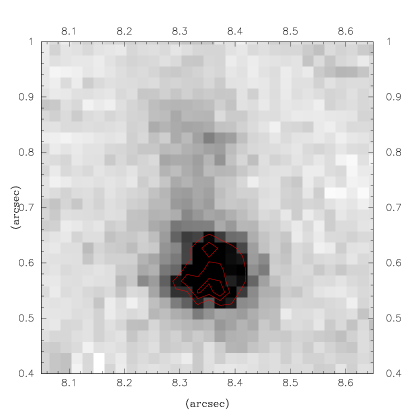
Lensed sources in the GT program are selected according to 2 criteria: 1) they lie close to the high-z critical lines, and 2) they have a photometric redshift compatible with . The former criterion restricts the application to clusters with mass distributions highly constrained by multiple images (revealed by HST or ground multicolor images), where the amplification uncertainties are 0.3 mags. Cluster lenses with well constrained mass distributions enable to recover precisely the properties of lensed galaxies (morphology, magnification factor). Fig. 1 gives an example of source reconstruction for two multiple-images at the same , behind A2390. The sample of lenses includes clusters with a strong X-ray emission and, as a first priority, those with HST images available. In all cases, deep multicolor photometry has been obtained in the visible and near-IR domains.
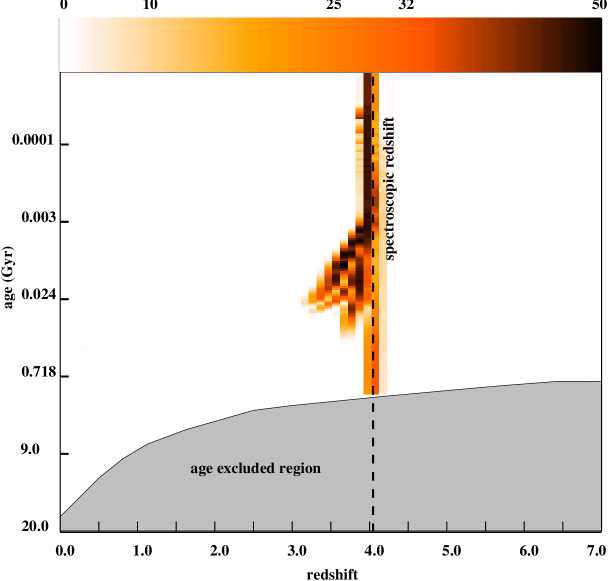
Photometric redshifts have been derived using the standard SED fitting method by Miralles & Pelló (1998). The observed SEDs are compared to a set of templates linked to the Bruzual & Charlot code (GISSEL98, [3]). The database includes 255 synthetic spectra, with from 0 to 0.5 mags, and flux decrements in the Lyman forest modelled according to Giallongo & Cristiani (1990; see also Madau 1995). The photometric z criterion can be used advantageously in this case because photometry is available on a large wavelength domain, including near-IR. This selection allows to reduce the biases towards intrisically bright or strong star-forming sources. Fig. 2 presents an example of likelihood map for one of the sources in Fig. 1.
3 Main goals
The GT can be used to determine the redshift distribution up to the faintest levels through magnified sources. It is also the natural way to search for primeval galaxies, in order to put strong constraints on the scenarios of galaxy formation. The use of visible and near-IR spectroscopy, combined with photometric z, enables to study the SED of galaxies for a sample which is less biased in luminosity than the field ones. In particular, the present and past SFR history (respectively obtained through the UV/visible/IR and near-IR domains), and the permitted region in the age- metallicity - parameter space. Highly magnified arcs are presently the only way to access the dynamical properties of galaxies at , through 2D spectroscopy (Narasimha & Chitre, 1993; Soucail et al. 1998). As shown in Fig.1, lens reconstruction allows to explore the morphology of distant sources with a spatial resolution of 1 kpc. When this technique will be coupled with 2D spectroscopy, the dynamics involved in galaxy formation would be directly observed.
4 First results on selected lenses
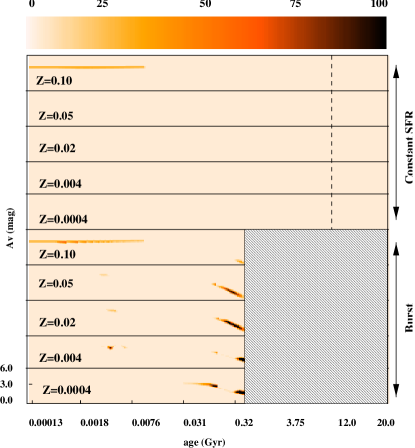
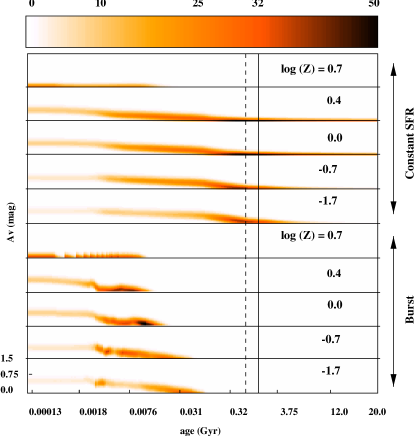
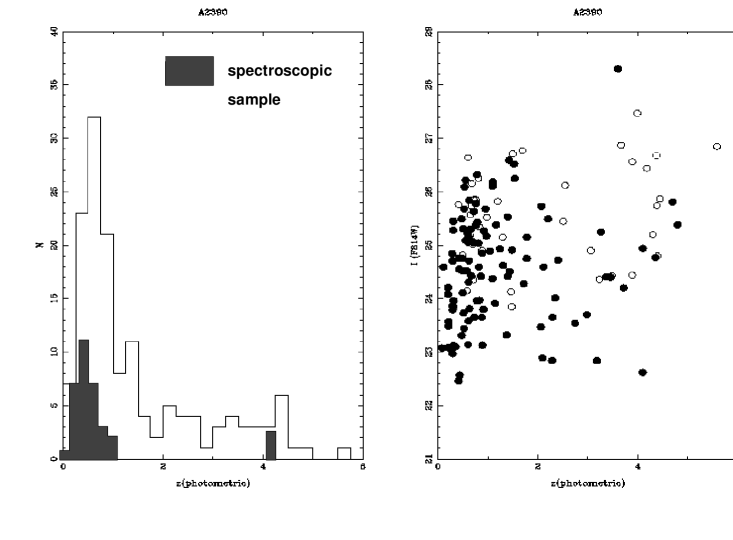
H3 and H5 are the first two objects spectroscopically confirmed in A2390, and this is one of the best studied lenses in our sample. sources at have been identified among the numerous arcs and arclets in this field. Their redshift distribution is shown in Fig. 5, and compared to the present spectroscopic survey in A2390. The redshift distribution in other GT targets (A2218, A370, Cl2244-02, AC114) also displays interesting candidates at . Once spectroscopic data is available for high-z sources, the SF rates and other stellar properties can be derived, although there is some degeneracy in the SFR-age-metallicity-reddening space. The permitted parameter region can be constrained using the GISSEL98 code when z is well known. Fig. 4 illustrates this point with two examples : H5 and D, the later being one of the brightest ISO sources in A2390 ([9], [1]). H3 and H5 are intrinsically bright star-forming systems ( to -1 mags, depending on ), slightly brighter than the objects found in Cl0939+4713 [16].
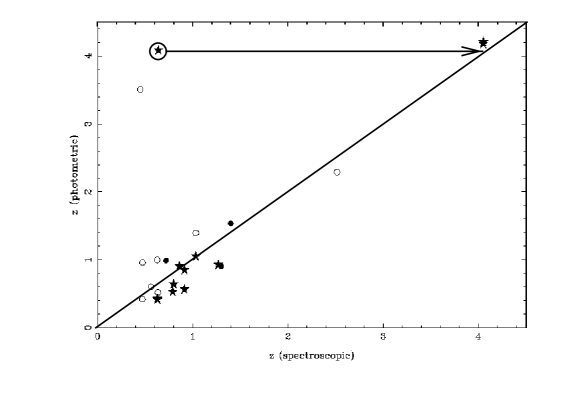
For a subsample of spectroscopically confirmed objects, we have tested the photometric z accuracy as a function of the SFR, reddening, age and metallicity of the stellar population. Spectroscopic surveys were carried out at CFHT, WHT and ESO (NTT,3.6m). We have cross-checked the consistency between the photometric, the spectroscopic and the lensing z obtained from inversion methods ([5]). The agreement between the three methods is good up to at least . For higher redshifts, the results on the most amplified

sources are promising, but an enlarged spectroscopic sample is needed.
5 Future issues
The uncertainty in the amplification is typically 0.2 to 0.3 mags. Thus, intrinsic luminosities and SFRs are known to accuracy using the GT. Only well studied lensing clusters, with fairly well known mass distributions, are actually useful as GTs.
Up to now, all spectroscopically confirmed sources at high-z in our sample are intrinsically bright. In order to constrain their parameter space (metallicity, , …), spectroscopic information on the UV restframe absorption lines, and near-IR spectroscopy aiming to access the Balmer region are strongly needed. Using arcs in clusters is probably the only way to access dynamics for sources (velocity gradiengts, 2D velocity fields, …). This systematic study is a well defined program for 8m telescopes such as the VLT. Combining photometric redshifts with lensing inversion techniques provides with an alternative way to determine the redshift distribution of high-z sources. If is enough for most applications, photometric redshifts allow to go further. Lensing clusters could be used as a tool to check photometric redshifts up to the faintest limits. An Ultra-Deep Photometric Survey of cluster lenses is urgently needed to probe the distant Universe.
References
- [1] Altieri, B., et al. (1999) A & A 343, L65
- [2] Bézecourt, J., Pelló, R., Soucail, G. (1998) A & A 330, 399
- [3] Bruzual, G., Charlot, S. (1993) ApJ 405, 538
- [4] Ebbels, T.M.D., et al. (1996) MNRAS 281, L75
- [5] Ebbels, T.M.D., et al. (1998) MNRAS 295, 75
- [6] Fort, B., Mellier, Y. (1994) A & A Review 5, 239
- [7] Franx M., et al. (1997) ApJ 486, 75
- [8] Frye B., Broadhurst T. (1998) ApJ 499, 115
- [9] Lémonon, L., et al. (1998) A & A 334, L21
- [10] Mellier et al. (1991) ApJ 380, 334
- [11] Narasimha, D., Chitre, S.M. (1993) A & A 280, 57
- [12] Pelló, R., et al. (1999) A & A in press (astro-ph/9810390)
- [13] Seitz, S., et al. (1998) MNRAS 298, 945
- [14] Soifer, B.T., et al. (1998) ApJ 501, 171
- [15] Soucail, G. et al. (1998) ASP Conference Series, vol. 146, 457
- [16] Trager S. C., et al. (1997) ApJ 485,92
- [17] Yee, H.K.C., et al. (1996) AJ 111, 1783