The Discovery of ERO Counterparts to Faint Submm Galaxies
Abstract
We have used deep ground-based imaging in the near-infrared to search for counterparts to the luminous submillimeter (submm) sources in the catalog of Smail et al. (1998). For the majority of the submm sources the near-IR imaging supports the counterparts originally selected from deep optical images. However, in two cases (10% of the sample) we find a relatively bright near-IR source close to the submm position, sources that were unidentified in the deep Hubble Space Telescope (HST) and ground-based -band images used in Smail et al. (1998). We place limits on colours of these sources from deep high-resolution Keck II imaging and find they have 2- limits of and respectively. Both sources thus class as extremely red objects (EROs). Using the spectral properties of the submm source in the radio and submm we argue that these EROs are probably the source of the submm emission, rather than the bright spiral galaxies previously identified by Smail et al. (1998). This connection provides important insights into the nature of the enigmatic ERO population and faint submm galaxies in general. From the estimated surface density of these submm-bright EROs we suggest that this class accounts for the majority of the reddest members of the ERO population, in good agreement with the preliminary conclusions of pointed submm observations of individual EROs. We conclude that the most extreme EROs represent a population of dusty, ultraluminous galaxies at high redshifts; further study of these will provide useful insights into the nature of star formation in obscured galaxies in the early Universe. The identification of similar counterparts in blank field submm surveys will be extremely difficult owing to their faintness (, ). Finally, we discuss the radio and submm properties of the two submm-bright EROs discovered here and suggest that both galaxies lie at .
keywords:
cosmology: observations — galaxies: evolution — galaxies: formation — infrared: galaxies1 Introduction
The nature of the population of extremely red objects (dubbed ‘EROs’, Elston et al. 1988; Hu & Ridway 1994; Barger et al. 1999a; Cowie et al. 1999) uncovered in deep near-IR surveys remains elusive. Their extreme colours, or , could be produced by a number of diverse factors: an evolved stellar population in a high-redshift galaxy; a substantial contribution to the -band flux from a strong emission line; a very high-redshift galaxy (–8) with strong absorption from the Ly forest shortward of the band, or a dust-obscured, highly reddened galaxy. These explanations suggest that a wide range of galaxies may belong to this class.
The surface density of the ERO population is /arcmin-2 at in blank fields, roughly similar to that of QSOs (Hu & Ridgway 1994). The exact surface density of sources depends upon the passbands and colours used to define an ERO as well as the magnitude limit of the sample, reaching sources per square arcmin redder than at (Cowie et al. 1999). EROs also appear to have higher surface densities, –100, in the vicinity of high-redshift active galactic nuclei (AGN) compared to the general field (Aragon-Salamanca et al. 1994; Cowie et al. 1994; Dey et al. 1995; Elston et al. 1988; Graham et al. 1994; Graham & Dey 1996; Hu & Ridgway 1994; Yamada et al. 1997; Soifer et al. 1992). This apparent clustering has led to speculation that at least some of the EROs are physically associated with luminous AGN. Such clustering behaviour is expected within a hierarchical framework where we would find other massive galaxies (detectable EROs at the AGN redshifts would have rest-frame optical luminosities of 5–20 ) forming in the vicinity of the high-density peak signposted by the AGN. Thus it is possible that a substantial fraction of the EROs comprise a population of luminous galaxies in the distant Universe and moreover one which is highly biased. Studying this population and testing this hypothesis would provide much-needed information about the formation of galaxies in high-density regions at high redshift and their subsequent evolution.
The heterogeneous nature of the ERO class has led to slow progress in defining the properties of this population. In particular, the feature which defines EROs – their extreme faintness in the optical (–25) compared to the near-IR – means that for most of them their redshifts and spectral properties are unknown. However, as observations in more wavebands are becoming available we are gradually building up a picture of the nature of this population. Working in this manner, Cimatti et al. (1998) and Dey et al. (1999) have presented new optical, near-IR and submm observations of ERO J164502+4626.4 (also known as HR 10, an ERO discovered in the field of the binary quasar PC 1643+4631; Hu & Ridgway 1994) which demonstrate convincingly that it is a dusty, ultraluminous starburst galaxy at . The interpretation of HR 10 as a dusty starburst is based upon photometry from the SCUBA bolometer array which shows that the far-IR luminosity of HR 10 is immense — its bolometric luminosity of L⊙ places HR 10 into the ultraluminous IR galaxy class (ULIRG) and implies that stars are being formed at a rate of 1000–2000 M⊙ yr-1. This is consistent with the disturbed morphology of HR 10: HST imaging apparently shows a complex interaction or an ongoing merger, very similar to those that trigger local ULIRGs (Sanders & Mirabel 1996) as well as their more distant counterparts (Smail et al. 1998).
The role of dust in defining the visible properties of EROs has been tested using SCUBA, with observations of around twenty EROs now completed at 850 m (Cimatti et al. 1998; Dey et al. 1999; Andreani et al. 1999; Thommes et al. 1999). The picture that is emerging is of a bimodal population — roughly two thirds of the EROs are undetected in the submm, indicating that they are neither strongly star forming nor contain large quantities of cold dust and thus are probably red because of old stellar populations. The remainder, which are typically redder, do show submm emission and have extreme colours because of reddening by dust (these include HR 10). The surface density of these dust-rich EROs, while highly uncertain, is such that they could be a moderate fraction of the SCUBA sources brighter than a few mJy at 850 m. The confirmation of such a connection between EROs and the SCUBA sources would provide important insights into the nature of both of these populations.
In this paper we present multi-wavelength observations of two luminous submm sources selected from the SCUBA Lens Survey of Smail et al. (1998, S98). These sources were initially identified with bright spiral galaxies at and . Subsequent near-IR imaging uncovered relatively bright galaxies close to the submm positions, sources that were invisible on the original deep optical images. Sensitive radio mapping with the Very Large Array (VLA) has strengthened the identification of one of these red galaxies with the submm emission. We begin in §2 by presenting the near-IR and radio observations of these fields, along with new deep high-resolution optical imaging to provide more stringent and uniform limits on the colours of the galaxies. We then discuss in §3 the spectral energy distributions (SEDs) of these two galaxies and compare these with what is known of other EROs. We give our conclusions in §4. Throughout this paper we adopt km s-1 Mpc-1 and a , cosmogony.
2 Observations
The two submm sources discussed here were discovered in deep 850-m maps taken with the SCUBA bolometer array on the JCMT111The James Clerk Maxwell Telescope is operated by the Joint Astronomy Centre on behalf of the Particle Physics and Astronomy Research Council of the United Kingdom, the Netherlands Organisation for Scientific Research, and the National Research Council of Canada. during the Lens Survey of S98. They are SMM J09429+4658 in the field of the cluster Cl 0939+4713 (A851) and SMM J04431+0210 in the MS 0440+02 field. The log of the observations are given in Table 1. The maps of SMM J09429+4658 were supplemented with data obtained using SCUBA’s photometry mode during the night of 1999 Feb 17. Details of the data reduction can be found in Ivison et al. (1998a, 1998b).
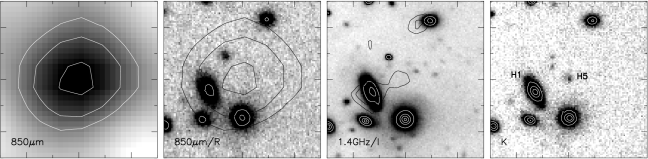
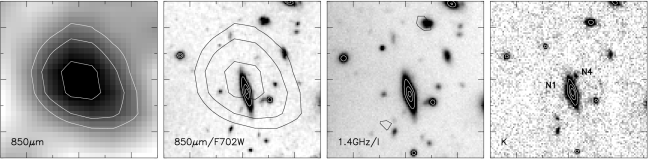
Analysis of deep optical imaging data for the fields indicated that the most probable counterparts (on the basis of optical magnitudes and relative positions) for the two sources were both bright spiral galaxies, H1 and N1 (Fig. 1 and 2), 4.5 and 2.3 arcsec from the SMM J09429+4658 and SMM J04431+0210 respectively (S98). H1 has a prominent dust lane in HST WFPC2 and NICMOS images (see also Smail et al. 1999). Spectroscopy of these galaxies identified N1 as a cluster member with relatively strong [Oii] and H emission (Barger et al. 1999b), while the redshift of H1 is which places it foreground to the cluster in that field. H1 shows no strong emission lines in its relatively low signal-to-noise spectrum (Dressler et al. 1999).
Until the next generation of millimeter interferometers becomes available the combination of radio and near-IR data is the cleanest route to identify reliable counterparts for the submm sources. Therefore as part of the identification procedure for the S98 submm survey, we have obtained sensitive 1.4-GHz maps from the VLA and deep near-IR imaging of all of the sources (Ivison et al. in prep). The radio maps are sensitive to the same starburst (or AGN activity in any radio-loud cases) which is powering the submm emission, while at the same time providing substantially higher astrometric precision and resolution – both crucial for correctly identifying the counterparts to the submm sources. Combined with the submm fluxes the radio maps can also provide crude redshift information on these galaxies (Carilli & Yun 1999). In addition, near-IR imaging, described later, offers an opportunity to identify the dusty, luminous submm galaxies through their unusual colours.
The VLA observations of MS0440+02 and Cl0939+4713 were obtained in the A and B configurations, respectively, at 1.4 GHz. Relevant details are listed in Table 1. The maps were cleaned and analysed using aips. Details of this complex procedure are given by Ivison et al. (in prep). The Cl 0939+4713 map reaches a 1 noise level of 9 Jy beam-1. The noise level in the MS 0440+02 map varies between 15 and 25 Jy beam-1 due to a strong confusing source. The relative astrometry of the radio maps and optical images are tied together using a large number of radio sources identified with bright cluster and field galaxies (see for example Smail et al. 1999). We estimate that the relative positions of sources in the maps are better than .
Two faint 1.4-GHz sources are detected in the Cl 0939+4713 map within the error box of the submm emission (Fig. 1). One of these is associated with the apparently passive but dusty spiral, H1 (Jy, see Smail et al. 1999). The other is only 0.7′′ from the nominal submm position but had no obvious optical counterpart in the ground-based imaging available to S98 and the submm source was therefore provisionally identified with the spiral galaxy pending further observations (S98; Barger et al. 1999b). A large number of the brighter galaxies in the Cl 0939+4713 field are detected in the VLA map by virtue of its high sensitivity (Smail et al. 1999; Morrison et al. 1999). The radio emission from the spiral population is interpreted as showing that massive stars are being formed in these galaxies. However, a large fraction of these galaxies have no [Oii]3727 emission in their spectra which suggests that this star formation is highly obscured (Smail et al. 1999).
The lack of radio emission within the submm error box of SMM J04431+0210 in our sensitive VLA map is not particularly unusual. Roughly half of the submm sources in S98 are undetected in radio maps at flux limits of mJy (Smail et al. 2000). We place a limit of Jy on the 1.4-GHz flux of N1.
The other aspect of the identification campaign is the acquisition of deep near-IR images of the source fields. These have all been obtained with the IRCAM3 or UFTI near-IR cameras on the 3.8-m UKIRT222UKIRT is operated by the Joint Astronomy Centre on behalf of the Particle Physics and Astronomy Research Council of the United Kingdom. on Mauna Kea (see Table 1). Observations consist of deep -band exposures with additional - and -band observations of the brighter sources detected in . We aimed to reach –21 in our imaging where this limit is set by the need to identify any counterparts within the submm error-box as unusual from their extreme optical-near-IR colors, , and the depth of our available -band images ( in our multi-orbit HST exposures). Integrating any fainter in might produce additional candidate counterparts but we would be unable to identify these as unusual on the basis of their colours alone.
We have imaged 85% of the submm sample of S98 so far to a median 3 depth of . To this depth, the majority of the fields show no sources not already seen in the original optical imaging used for the source identification (S98). However, in two of the fields – those for the sources SMM J09429+4658 and SMM J04431+0210 – we find previously unidentified faint near-IR objects close to the nominal submm positions (Figs. 1 and 2, Table 2). Using the naming scheme of S98 these candidate counterparts are called H5 for SMM J09429+4658 and N4 for SMM J04431+0210. H5 is coincident with the faint radio source detected in the deep VLA map of this cluster, the radio properties of N4 and H5 are presented in Table 2.
The -band image of SMM J04431+0210 was taken with IRCAM3 in photometric and good-seeing conditions on the night of 1998 September 10. The original observations of SMM J09429+4658 were obtained in non-photometric conditions on 1998 October 19 using the new 10242 InSb imager UFTI (Leggett 1999), along with further -band observations of SMM J04431+0210. Each of these exposures consists of a total of 3.2 ks of on-source integration, with the UFTI images being slightly shallower due to the poor transparency and seeing encountered. Nevertheless, the UFTI exposure of SMM J04431+0210 provides an independent confirmation of the reality of the source N4. To check the reliability of the detection of H5 and to improve our photometry we repeated the observations of SMM J09429+4658 using IRCAM3 in much better conditions on the nights of 1999 February 10–11, obtaining a total of 8.1 ks integration in and 3.2 ks in . These observations confirm that H5 is indeed an extremely red source, with only a marginal detection of the source in the -band image giving .
All of the near-IR observations were broken into subsets of nine exposures dithered on a grid. Each of these sets of sub-exposures was also spatially offset. The dithering allows us to construct sky frames from the science exposures and use these to correct the science frames. The science and standard star frames were linearised, reduced and calibrated onto the Cousin’s -band in a standard manner. The colour term results in an uncertainty in the final -band photometry of for sources as red as .
After modelling and removing contaminating light from nearby galaxies, the magnitudes of the two sources were measured in 3.0′′-diameter apertures. These were converted to total magnitudes using aperture corrections measured from bright compact objects in each field (Table 2, Fig. 3). The uncertainties quoted on this photometry includes a contribution due to removal of the contaminating light.
Optical imaging of the two fields was obtained with the LRIS imaging spectrograph (Oke et al. 1995) on the 10-m Keck II telescope, Mauna Kea333The W. M. Keck Observatory is a scientific partnership between the University of California, the California Institute of Technology and the National Aeronautics and Space Administration, and was made possible by the generous financial support of the W. M. Keck Foundation.. These images were taken to constrain the colours of the two near-IR sources we identified from the UKIRT imaging. The observations were obtained in good conditions during bright time (Table 1) and consist of multiple 200-s exposures of the two fields dithered on a non-redundant grid. The science frames were processed in a standard manner and flatfielded with twilight flat fields. To remove fringing from the frames, subsets of the science exposures were stacked to construct fringe frames which were then subtracted from the individual science frames. This procedure worked well and the final frames reach 2 sensitivities of –26 within 3.0′′-diameter apertures. Notwithstanding the depth of these images, neither of the near-IR sources N4 or H5 is reliably detected. Faint emission is just visible in the , and perhaps F702W, images of N4 coincident with the near-IR source, our aperture photometry does not confirm this as a formal detection and so instead we have chosen to quote a conservative limit. We therefore give the 2 limiting -band magnitudes for both counterparts in Table 2 and Fig. 3, along with the equivalent limits from the original -band data of S98.
3 Discussion
Our deep -band imaging of the submm sources from S98 has turned up two objects with relatively bright near-IR emission which were invisible on the deep optical imaging used by S98. We estimate 2 limits of and for N4 and H5 respectively. This puts both N4 and H5 firmly into the class of EROs, with N4 possibly an extreme example. Moreover, both objects exhibit sufficiently red optical to near-IR colours that the probability of randomly detecting such a source within the submm error boxes is slight, . We now discuss the properties of the submm sources in more detail and argue that the EROs, rather than the bright spirals N1 and H1, are the most likely counterparts of the submm sources.
We begin by discussing the spectral indices for the two submm sources between the submm and radio regimes using our 850-m and 1.4-GHz flux densities or limits. Carilli & Yun (1999) have shown that the spectral index, , can be used to obtain a crude redshift estimate for a range of starburst- and AGN-dominated SEDs. We find for SMM J09429+4658 using the radio flux for H1 or using H5’s radio flux and for SMM J04431+0210. These values are at the upper end of the distribution for high-redshift sources discussed in Carilli & Yun (1999), with SMM J09429+4658 having the highest index of any source currently known.
Using the various empirical and model curves in Carilli & Yun (1999), we translate the indices into redshift limits of for SMM J09429+4658 and for SMM J04431+0210. This indicates that both submm sources lie at high redshifts and are not associated with the bright spiral galaxies H1 or N1. The expected submm–radio spectral index for –0.3 star-forming galaxies such as H1 or N1 would be in the range to 0.3, far lower than the observed values. The predicted submm fluxes for these two galaxies adopting the observed radio limits/detections and the range of for –0.3 galaxies from Carilli & Yun (1999) would be mJy, far fainter than the observed fluxes. The high values of for both SMM J09429+4658 and SMM J04431+0210 might also suggest that AGN-based emission is unlikely to dominate the radio power of these sources (Carilli & Yun 1999).
Another independent redshift estimate for the submm sources is available to us: the ratio of 450- to 850-m flux densities. For SMM J09429+4658, , which indicates according to Hughes et al. (1998). For SMM J04431+0210, , which suggests that – a weak but useful constraint. The expected ratio of 450- to 850-m flux densities for star-forming galaxies at –0.3 is . Again, the spectral properties of the submm sources appear to be incompatible with the bright galaxies H1 and N1 being the counterparts of the submm emission and suggest instead that the source lie at substantially higher redshifts.
Data at submm and radio wavelengths thus appears to rule out the identification of the two spiral galaxies, H1 and N1, as counterparts of the submm sources (S98). Therefore we now discuss the properties of the EROs H5 and N4 to determine if these could be the true counterparts to the submm sources.
The modest resolution and signal-to-noise of our -band imaging means we can make no strong statements about the morphologies of the near-infrared sources H5 and H4. However, both show signs of being extended in our 0.5′′-seeing UKIRT images indicating that they are likely to be a galaxies.
As we have shown both submm sources probably lie at high redshifts, they therefore have bolometric luminosities of and their counterparts will class as ULIRGs. We can thus compare our limits on the colours of the two EROs with the predicted colours of ULIRGs at high redshift from Trentham, Kormendy & Sanders (1999). They use ultraviolet observations of low-redshift ULIRGs from HST to model the expected colours of similar systems at high redshift. The only galaxy whose colours exceed (our limit for H5) is VII Zw031, the reddest galaxy in their sample. This would have at and at . Less extreme galaxies only become as red as at but tend to become bluer again after that. With few observations to compare with (and a wide range in the possible galaxy colours) this comparison is necessarily of only limited scope. Nevertheless, the colours of N4 and H5 would suggest that N4 may be a highly-obscured galaxy at , while H5 could be a similarly obscured galaxy at .
The various constraints on the redshifts of the submm sources and the possible ERO counterparts are summarised in Table 3. In each case the constraints provide a consistent picture suggesting that both the submm sources and the EROs lie at high redshifts, . Taken together with the low likelihood of a chance spatial coincidence between a submm source and an ERO (neither class being particularly numerous), and the highly obscured nature suggested by the ERO’s extreme colours, we propose that the EROs H5 and N4 are the most likely counterparts of the submm sources SMM J09429+4658 and SMM J04431+0210.
We now discuss the consequences of the identification of ERO counterparts to the submm sources for our understanding of the nature of these two galaxies, as well as for ERO and submm galaxies in general. To simplify the discussion below we adopt redshifts of for H5 and for N4 which are representative of the results in Table 3.
Before investigating the intrinsic properties of the two galaxies H5 and N2, we must first estimate their lens amplifications. We use our robust mass models for both cluster lenses (Blain et al. 1999b) and include mass components for not only the main cluster potential but also the galaxies near the ERO positions using the scaling relations of Natarajan et al. (1998) to estimate their relative contributions. We assume redshifts of for H5 and for N4 and estimate an amplification factor of 2.0 for H5, with a range of 1.5–2.1 for –5; N4 has an amplification of 4.4 at , with a range of 3.1–4.8 across –5. These magnifications are achromatic and have typical errors of around 20%, comparable to the absolute calibration errors of the SCUBA maps. Taking the appropriate amplifications we correct the observed 850-m flux densities and estimate intrinsic apparent fluxes of mJy for H5 and mJy for N4 (where the errors do not include any systematic components due to the unknown redshifts of the galaxies). The corrected -magnitudes are 20.1 for H5 and 20.7 for N4, while the equivalent -band limits for these galaxies if they had been found in a blank field survey would be very faint and .
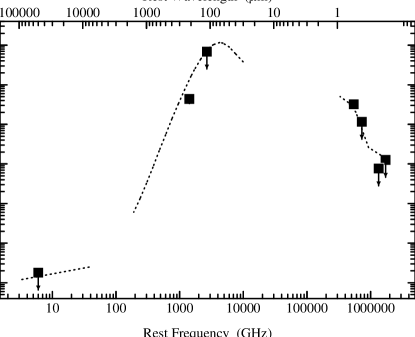
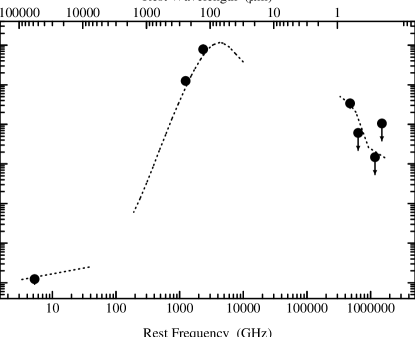
Assuming that the far-IR spectral energy distributions (Fig. 3) of the two EROs are roughly similar to that of HR 10 (Dey et al. 1999), then their intrinsic submm fluxes, assuming K, correspond to bolometric luminosities of and for H5 and N4 at and respectively (or a range of 35– and 8– for –5). Thus both galaxies class as ULIRGs. If we assume that the far-IR emission from these galaxies is purely due to star formation, the star-formation rates we derive are of the order of 1000 M⊙ yr-1 for stars above 10 for N4 and 4000 M⊙ yr-1 for H5 (assuming SFR yr see Ivison et al. 1998a; Thronson & Telesco 1986). However, in the local Universe, the majority of galaxies as luminous as H5 show some signs of AGN activity (Sanders & Mirabel 1996) and hence it is probable that this galaxy is a composite starburst/AGN, an obscured system akin to SMM J023990136 (Ivison et al. 1998a).
We next compare the characteristics of H5 and N4 with those of HR 10, the submm-bright ERO at . HR 10 has an colour of 5.8, with , a flux density of 4.9 mJy at 850 m and a bolometric luminosity of (Dey et al. 1999; c.f. Cimatti et al. 1998). Thus HR 10 has a comparable bolometric luminosity to N4 and is times fainter than H5; in contrast, HR 10 is nearly an order of magnitude brighter than either N4 or H5 in the -band. Assuming similar rest-frame optical/far-IR ratios for all three galaxies, their relative -band magnitudes are compatible with N4 and H5 lying at higher redshifts than HR 10, as suggested by their indices (HR 10 has , which is consistent with the models of Carilli & Yun (1999) for ) as well as their 450- to 850-m flux density ratios. We plot the multi-wavelength SED of HR 10 along with the available observations of H5 and N4 in Fig. 3.
The similarly extreme optical/near-IR colours and luminosities for N4, H5 and HR 10, as shown in Fig. 3, supports the suggestion that N4 and H5 are more distant analogs of HR 10. The identification of ERO counterparts to two of the submm sources from S98 indicates that at least 10% of the faint submm population down to 850-m flux levels of a few mJy could be EROs. This estimate would rise to 20% if the optical blank-field sources in S98 turn out to be faint EROs, which is entirely plausible. Taking the 10% estimate and the surface density of 850-m sources detected in the SCUBA Lens Survey (Blain et al. 1999b) of 2.5– per square degree brighter than 2 mJy, we would expect a surface density of submm-selected EROs of around 0.1 per square arcmin. The -band magnitudes of these galaxies are in the absence of lensing and hence they would also account for all of the reddest objects in the ERO population at this limit (Cowie et al. 1999).
Our conclusion that all of the most extreme ERO population are likely to be submm emitters agrees well with the results from pointed SCUBA observations of extreme EROs (see §1). These programs are also detecting such sources at flux densities of mJy. We therefore suggest that the most extreme EROs, , comprise a population of dusty ultraluminous starbursts in the distant Universe. While this population produces only a minor component of the background, % of the far-infrared background (see Blain et al. 1999a), the study of these sources will be an important step in understanding the formation and evolution of dust within the most luminous and obscured galaxies at high redshifts.
We stress that the whole ERO population (defined as those objects redder than ) is not dominated by submm-bright sources. This is not particularly surprising given the wide range of characteristics which can place a galaxy in that class (see §1). However, the extreme colours of H5 and N4 and the spread of optical to near-IR colours which they indicate in the submm-selected sample (c.f. Ivison et al. 1998a) is more puzzling and suggests a relatively inhomogeneous population with a wide range of line-of-sight dust obscuration. Similar behaviour is seen in samples of low-redshift ULIRGs (Trentham, Kormendy & Sanders 1999) and these are therefore likely to be the best laboratories for unravelling the cause of these widely varying optical properties.
We also note that relatively bright ERO counterparts () such as those discussed here are not seen for the bulk of the submm sources in our survey. Moreover, in at least two cases we have submm sources with bright and blue optical counterparts, two galaxies at and (Ivison et al. 1998a, 1999), and in both instances we have confirmed the identifications with CO observations at mm wavelengths (Frayer et al. 1998, 1999). Hence while the SCUBA population contains some near-IR bright EROs, these do not appear to dominate the sample. It is possible that some of the remaining SCUBA sources have counterparts with ERO-like characteristics which are fainter than (equivalent to for a blank field survey). Such objects would be exceedingly difficult to identify and their further study would be almost completely confined to what could be learnt at millimeter and radio wavelengths.
The similarities between the properties of H5, N4 and HR 10 along with the identification of the latter as a massive, dust-enshrouded starburst galaxy at (Dey et al. 1999) suggests that these two galaxies represent similar systems lying at even higher redshifts and hence earlier times in the Universe. The redshift constraints from our multi-wavelength observations are summarised in Table 3. These massive star-forming galaxies will provide particularly stringent tests of hierarchical galaxy-formation models (Baugh et al. 1998) if it can be shown that a large fraction of their bolometric luminosity is powered by star formation.
4 Conclusions
In the course of a near-IR survey of counterparts to faint submm sources we have uncovered two extremely red galaxies, H5 and N4, which were undetected in the deep optical images used originally to select likely counterparts by Smail et al. (1998). Follow-up deep optical imaging of both fields with Keck II puts 2- limits of and on the colours of H5 and N4 respectively. Both galaxies therefore class as EROs.
Using the submm and radio spectral properties of the submm sources we argue that the EROs are probably the source of the submm emission, not the bright spiral galaxies previously identified as such by Smail et al. (1998). The identification of two ERO counterparts to submm sources indicates that at least 10% of the submm population down to 850-m flux levels of a few mJy could be EROs. The equivalent surface density of submm-selected EROs would be around 0.1 per square arcmin at . This density would account for all of the reddest EROs detected in near-infrared surveys at this depth.
A comparison of the submm and radio emission from H5 and N4 against the models of Carilli & Yun (1999) and a study of their optical and far-infrared SEDs suggests that both galaxies are likely to be dusty ultraluminous starbursts at high redshifts, probably at .
Acknowledgements
We thank Neil Trentham for his thorough referee’s report on this paper as well as for kindly providing the predicted colours of high redshift ULIRGs. We acknowledge useful conversations with Arjun Dey, James Graham and Katherine Gunn. We thank Sandy Leggett for help and support during our UFTI observations. IRS acknowledges support from the Royal Society and RJI and AWB from PPARC.
References
- [] Andreani, P., Cimatti, A., Rottgering, H., & Tilanus, R. 1999, Ap&SS, in press
- [] Aragon-Salamanca, A., Ellis, R.S., Schwartzenberg, J.-M., & Bergeron, J.A. 1994, ApJ, 421, 27
- [] Barger, A.J., Cowie, L.L., Trentham, N., Fulton, E., Hu, E.M., Songaila, A., & Hall, D. 1999a, AJ, 117, 102
- [] Barger, A.J., Cowie, L.L., Smail, I., Ivison, R.J., Blain, A.W., & Kneib, J.-P. 1999b, ApJ, in press
- [] Baugh, C.M., Cole, S., Frenk, C.S., & Lacey, C.G. 1998, ApJ, 498, 504
- [] Blain, A.W., Smail, I., Ivison, R.J., & Kneib, J.-P. 1999a, MNRAS, 302, 632
- [] Blain, A.W., Kneib, J.-P., Ivison, R.J., & Smail, I. 1999b, ApJL, 512, L87
- [] Carilli, C.L., & Yun, M.S. 1999, ApJL, 513, L13
- [] Cimatti, A., Andreani, P., Rottgering, H., & Tilanus, R. 1998, Nature, 392, 895
- [] Cowie, L.L., Gardner, J.P., Hu, E.M., Songaila, A., Hodapp, K.-W., & Wainscoat, R.J. 1994, ApJ, 434, 114
- [] Cowie, L.L., et al. 1999, in prep
- [] Dey, A., Spinrad, H., & Dickinson, M.E. 1995, ApJ, 440, 515
- [] Dey, A., Graham, J., Ivison, R.J., Smail, I., Wright, G.S., & Liu, M. 1999, ApJ, in press
- [] Dressler, A., Smail, I., Poggianti, B.M., Butcher, H., Couch, W.J., Ellis, R.S., & Oemler, A. 1999, ApJS, in press
- [] Elston, R., Rieke, G.H., & Rieke, M.J. 1988, ApJ, 331, L77
- [] Frayer, D.T., Ivison, R.J., Scoville, N.Z., Yun, M., Evans, A.S., Smail, I., Blain, A.W., & Kneib, J.-P. 1998, ApJL, 506, L7
- [] Frayer, D.T., Ivison, R.J., Scoville, N.Z., Yun, M., Evans, A.S., Smail, I., Barger, A.J., Blain, A.W., & Kneib, J.-P. 1999, ApJL, 514, L13
- [] Graham, J.R., & Dey, A. 1996, ApJ, 471, 720
- [] Graham, J.R., et al. 1994, ApJ, 420, L5
- [] Hu, E.M., & Ridgway, S. 1994, AJ, 107, 156
- [] Hughes, D.H., Serjeant, S., Dunlop, J.S., Rowan-Robinson, M., Blain, A.W., Mann, R.G., Ivison, R.J., Peacock, J., Efstathiou, A., Gear, W.K., Oliver, S., Lawrence, A., Longair, M., Goldschmidt, P., Jenness, T., 1998, Nature, 394, 241
- [] Ivison, R.J., Smail, I., Le Borgne, J.-F., Blain, A.W., Kneib, J.-P., Bezecourt, J., Kerr, T.H., & Davies, J.K. 1998a, MNRAS, 298, 583
- [] Ivison, R.J., Dunlop, J.S., Hughes, D.H., Archibald, E.N., Stevens, J.A, Holland, W.S., Robson, E.I., Eales, S.A., Rawlings, S., Dey, A., Gear, W.K. 1998b, ApJ, 494, 211
- [] Ivison, R.J., Smail, I., Barger, A.J., Kneib, J.-P., Blain, A.W., Owen, F.N., Kerr, T.H., Cowie, L.L., 1999, MNRAS, submitted.
-
[]
Leggett, S.K. 1999,
http://www.jach.hawaii.edu/UKIRT.new/instruments/ufti - [] Morrison, G., Owen, F.N., et al. 1999, in prep
- [] Natarajan, P., Kneib, J.-P., Smail, I., & Ellis, R.S. 1998, ApJ, 499, 600
- [] Oke, J.B., Cohen, J.G., Carr, M., Cromer, J., Dingizian, A., Harris, F.H., Labrecque, S., Lucinio, R., Schaal, W., Epps, H., & Miller, J. 1995, PASP, 107, 375
- [] Sanders, D.B., & Mirabel, I.F. 1996, ARA&A, 34, 749
- [] Smail, I., Ivison, R.J., Blain, A.W., & Kneib, J.-P. 1998, ApJL, 507, L21 (S98)
- [] Smail, I., Morrison, G., Gray, M.E., Owen, F.N., Ivison, R.J., Kneib, J.-P., & Ellis, R.S. 1999, ApJ, in press
- [] Smail, I., Ivison, R.J., Owen, F.N., Blain, A.W., Kneib, J.-P., 2000, ApJL, submitted.
- [] Soifer, B.T., et al. ApJL, 1992, 399, L55
- [] Trentham, N., Kormendy, J., & Sanders, D. 1999, AJ, 117, 1152
- [] Thommes, E., et al. 1999, MNRAS, in prep
- [] Thronson, H., & Telesco, C., 1986, ApJ, 311, 98
- [] Yamada, T., Tanaka, I., Aragon-Salamanca, A., Kodama, T., Ohta, K., & Arimoto, N. 1997, ApJ, 487, L125
Table 1
Log of Observations
| Telescope | Instrument | Date | Band | texp | Resol. | Comments |
|---|---|---|---|---|---|---|
| (ks) | (′′) | |||||
| SMM J09429+4658 | ||||||
| JCMT | SCUBA | 1998 Mar 12–13 | 850 m | 30.1 | 14.5 | mapping mode |
| JCMT | SCUBA | … | 450 m | … | 7.8 | mapping mode, simultaneous with 850 m |
| JCMT | SCUBA | 1999 Feb 17 | 850 m | 1.8 | 14.7 | photometry mode |
| JCMT | SCUBA | … | 450 m | … | 7.8 | photometry mode, simultaneous with 850 m |
| VLA | … | 1996 Jan 06-08 | 21.4 cm | 60.7 | 4.0 | B configuration |
| UKIRT | UFTI | 1998 Oct 19 | 3.2 | 1.0 | non-photometric | |
| UKIRT | IRCAM3 | 1999 Feb 10 | 8.1 | 0.75 | photometric | |
| UKIRT | IRCAM3 | 1999 Feb 11 | 3.2 | 0.65 | photometric | |
| Keck II | LRIS | 1998 Nov 01 | 3.6 | 0.65 | photometric | |
| P200 | COSMIC | 1993 Nov 06 | 3.0 | 1.2 | photometric | |
| SMM J04431+0210 | ||||||
| JCMT | SCUBA | 1997 Aug–1998 Sep | 850 m | 35.8 | 14.7 | mapping mode |
| JCMT | SCUBA | … | 450 m | … | 7.8 | mapping mode, simultaneous with 850 m |
| VLA | … | 1998 Apr 19 | 21.4 cm | 28.0 | 1.4 | A configuration |
| UKIRT | IRCAM3 | 1998 Sep 10 | 3.2 | 0.50 | photometric | |
| UKIRT | UFTI | 1998 Oct 19 | 3.2 | 1.1 | non-photometric | |
| UKIRT | IRCAM3 | 1999 Feb 12 | 3.2 | 0.50 | photometric | |
| Keck II | LRIS | 1998 Nov 01 | 6.5 | 0.60 | photometric | |
| HST | WFPC2 | 1994 Oct 06 | F702W | 6.5 | 0.10 | |
Table 2
Properties of the ERO Counterparts
| Property | H5 | N4 | Comments |
|---|---|---|---|
| R.A. (J2000) | 09 42 54.65 | 04 43 07.10 | near-IR position |
| Dec. (J2000) | +46 58 44.7 | +02 10 25.1 | accurate to |
| 0.9 | 1.9 | arcsec, submm to near-IR offset | |
| 0.7 | … | arcsec, submm to radio offset | |
| 850 m | 15.42.0 | 7.21.7 | mJy, weighted mean of map and photometry† |
| 450 m | 6113 | mJy, weighted mean of map and photometry† | |
| 20 cm | 369 | Jy | |
| 19.390.30 | 19.130.15 | ||
| 19.580.16 | 19.280.10 | 3.0′′ diameter aperture photometry | |
| 2 limits | |||
| 2 limits | |||
| 2 limits from P200/HST data |
† Errors include a 10% contribution from the uncertainty in the absolute calibration.
Table 3
Redshift constraints for the EROs
| Constraint | Redshift | |
|---|---|---|
| H5 | N4 | |
| – | ||
| SED fit | ||