A Survey for Low Surface Brightness Galaxies Around M31. II. The Newly Discovered Dwarf Andromeda VI
Abstract
We present -, -, and -band images, as well as an H image, of And VI. This is the second newly identified dwarf spheroidal (dSph) companion to M31 found using a digital filtering technique applied to the second Palomar Sky Survey for which 1550 deg2 now have been surveyed. And VI was confirmed to be a nearby dSph galaxy when it resolved into stars easily with a short 4-m -band exposure. Sub-arcsec images taken at the Kitt Peak WIYN 3.5-m telescope provided (,–) and (,–) color–magnitude diagrams that yield a distance of 775 35 kpc using the tip of the red giant branch method, and a mean metallicity of [Fe/H] with a dispersion of dex. And VI has a galactocentric distance of kpc and . All observed properties of And VI are consistent with its classification as a dSph companion to M31. Despite the recent identification of the And V, And VI, and Cas dwarfs, the Local Group luminosity function remains highly deficient in faint galaxies relative both to CDM simulations of its formation, and to the luminosity functions for richer clusters of galaxies.
1 Introduction
The properties, frequency, and origin of dwarf galaxies have important implications for galaxy formation and cosmology. With an eye toward these implications, Gallagher & Wyse (1994), Grebel (1997), Da Costa (1998), and Mateo (1998) recently have reviewed the dwarf galaxies of the Local Group. As an example of a property of this class of galaxy where our knowledge is far from complete, consider the faint end of the galaxy luminosity function. Figure 1 shows a luminosity function, based on Table 4 of Mateo (1998), for all dwarf galaxies in the Local Group, with those dwarfs associated with the Milky Way, M31, and the general Local Group indicated.111See Table 1 of Mateo (1998) for the association between individual galaxies and subgroups within the Local Group. For the few galaxies with two possible associations, we count them as “half galaxies” in each subgroup. The absolute magnitudes of the LMC and SMC are from Westerlund (1997). Note that the faintest dwarf galaxies appear to be more common around the Milky Way than in other parts of the Local Group. Is this a real effect or, instead, due to increasing incompleteness for low-luminosity dwarf galaxies as one looks beyond the outer halo of the Galaxy? The only way to resolve this and related questions is through more sensitive searches for low-luminosity galaxies in the Local Group.
We have undertaken a survey for low surface brightness dwarf galaxies around M31. Our methodology is the application of digital filtering techniques to the Second Palomar Sky Survey (POSS-II; Reid et al. 1991, Reid & Djorgovski 1993). Our survey seeks to cover a larger area around M31 and to reach a deeper limiting central surface brightness than the pioneering survey of van den Bergh (1972, 1974), which revealed three M31 dwarf companions (And I, II & III). In the first paper of this series (Armandroff, Davies, & Jacoby 1998b; hereafter referred to as Paper I), we described our methodology, discussed its application to 1550 deg2 of the sky survey, and announced the first discovery of this survey: the new dwarf galaxy And V. We also presented a color–magnitude diagram for And V which yields a distance to this galaxy that is equivalent, within the uncertainties, to that of M31. The line-of-sight distance to And V and its projected distance from M31 suggest association with M31. The color–magnitude diagram also implies a mean metal abundance for And V of [Fe/H] –1.5 and lacks bright blue stars. This absence of a young population in the color–magnitude diagram, the lack of H emission in the differencing of our deep H and images, and the non-detection of far-infrared emission all imply that And V is a dwarf spheroidal (dSph) galaxy, and not a dwarf irregular galaxy. And V thus joined M31’s three other dwarf spheroidal companions (And I, II & III) and three more luminous dwarf elliptical companions (NGC 147, 185 and 205). IC 10, a dwarf irregular, LGS 3, a transition object between dwarf irregular and dwarf spheroidal, and M32, a low-luminosity elliptical, complete the inventory of dwarf galaxies commonly accepted as associated with M31.
In this paper, we discuss the next product of our survey: And VI. The newly discovered galaxy And VI is found to be another dwarf spheroidal companion to M31 (see also Karachentsev & Karachentseva 1999; Grebel & Guhathakurta 1999; Hopp et al. 1999).
2 Finding And VI
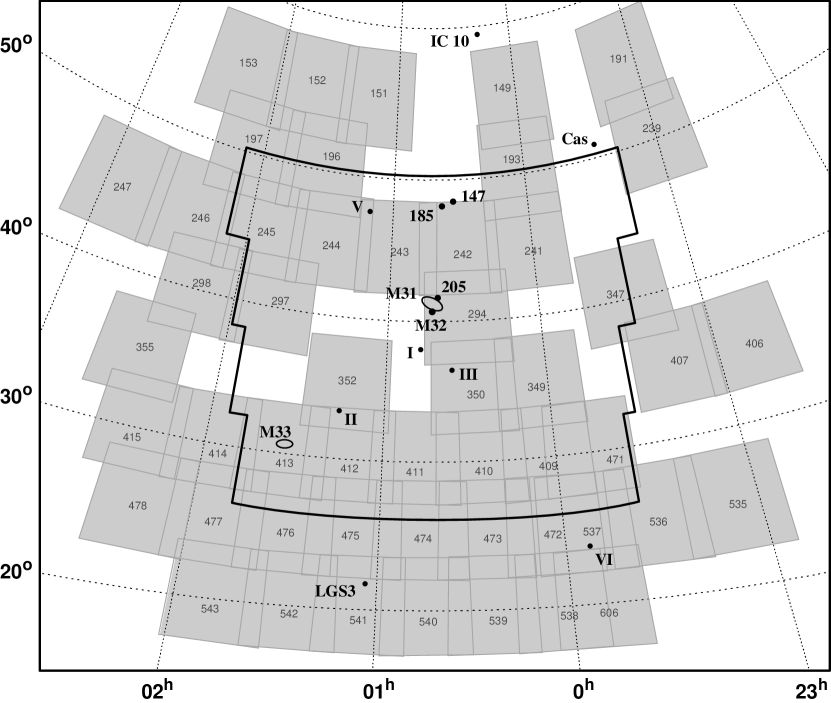
Using the methodology of Paper I, we found an excellent low surface brightness dwarf candidate at the following celestial coordinates: = 23h51m46.3s, = +24∘34′57′′ (J2000.0). These correspond to Galactic coordinates of: = 106.0∘, = –36.3∘. Anticipating the evidence presented below and following van den Bergh (1972), we will call this new galaxy Andromeda VI. Figure 2 shows And VI’s location on the sky relative to M31, M31’s known companions, and our search area. Figure 3 displays And VI on the digitized POSS-II, raw and after our enhancement procedure. One sees a strong resemblance between And VI and the known M31 dwarf spheroidals And II & III on the raw and processed POSS-II images (compare Figure 3 with Figure 1 of Armandroff et al. 1998b). And VI is visible on the POSS-II and transparencies. And I, II & III are also visible on the POSS-II transparencies.
There are three possible reasons why And VI was not recognized until recently. First, it is just outside the van den Bergh (1972, 1974) search area. Second, And VI is located right next to a bright star, so it might have been thought to be a ghost reflection caused by that star. Finally, examination of the POSS-II transparencies reveals diffuse Galactic emission to be common in this region, so And VI could have been interpreted as part of this extended emission.
3 Follow-Up Observations
As a first step toward clarifying its nature, And VI was imaged at the Kitt Peak National Observatory 4-m telescope prime focus with the T2KB CCD on 1998 January 23 (U.T.). Only one exposure of 300 sec was obtained due to And VI’s limited visibility in January. And VI resolved nicely into stars in this short image, suggesting that it is indeed a nearby dwarf galaxy.222Several months after our confirmation that And VI is a bona fide nearby dwarf galaxy, we reported our discovery in the “Dwarf Tales” Newsletter (Armandroff et al. 1998c). Karachentsev & Karachentseva (1998) also reported their independent finding of And VI, calling it the Pegasus Dwarf, in “Dwarf Tales” and in a subsequent journal submission (Karachentsev & Karachentseva 1999).
And VI was imaged more deeply using the WIYN333The WIYN Observatory is a joint facility of the University of Wisconsin-Madison, Indiana University, Yale University, and the National Optical Astronomy Observatories. 3.5-m telescope, the S2KB CCD (a 2048 2048 STIS device) mounted at the Nasmyth focus, and the , and filters on several occasions during 1998 September and October. The scale was 0.197 arcsec/pixel, and each image covered 6.76.7 arcmin. The exposure times, dates of observation, and the resulting image quality are listed in Table 1. The deep images were taken during three nights when the seeing conditions were excellent (0.6 – 0.8 arcsec FWHM). These deep exposures were calibrated via images taken on a photometric night during which 13 Landolt (1992) standards were observed. All images were overscan corrected, bias subtracted, and flat fielded in the standard manner. The images were defringed using the scaled combination of several dark-sky fringe frames.
Figure 4 displays a color image of And VI made from the , , and CCD images from WIYN. And VI resolves nicely into stars on the , and images. The And VI images exhibit a smooth stellar distribution and a resemblance with the other M31 dwarf spheroidals (compare Figure 4 with Figure 1 of Armandroff et al. 1993 and/or Figure 4 of Paper I). And VI does not look lumpy or show obvious regions of star formation that would suggest a dwarf irregular, as opposed to dwarf spheroidal, classification. No obvious globular clusters are seen in And VI, though none are expected for a low-luminosity dwarf spheroidal (e.g., Sec. 4.3 of Da Costa & Armandroff 1995).
In order to look for possible ionized gas, And VI was observed with the KPNO 4-m telescope in H narrowband and on 1998 July 15 (U.T.) with the CCD Mosaic Imager (Armandroff et al. 1998a). The H filter used has a central wavelength of 6569 Å and a width of 80 Å FWHM in the f/3.2 beam of the telescope. Three narrowband exposures of 700 sec each and three exposures of 300 sec each were obtained. The average seeing was 1.2 arcsec FWHM, sampled at 0.26 arcsec/pixel. We computed scaling ratios between the combined H and images and performed the subtraction. Figure 5 shows both the H image and the continuum-subtracted H image. No diffuse H emission or H ii regions are detected in the And VI continuum-subtracted image. The only features seen in this image are in the vicinity of the brighter stars, where residuals are caused by the slightly different behavior of the point spread function (PSF) between and H. No diffuse H emission or H ii regions were found in And V either (Paper I). The lack of H emission in And VI rules out current high-mass star formation. Almost all Local Group dwarf irregular galaxies are strongly detected in H (e.g., Kennicutt 1994). And VI’s lack of H emission, coupled with its smooth, regular appearance on broadband images, suggests that it is a dwarf spheroidal galaxy (rather than a dwarf irregular).
We also examined the IRAS 12-, 25-, 60-, and 100-micron maps of the And VI region, using the FRESCO data product from IPAC444IPAC is funded by NASA as part of the IRAS extended mission under contract to JPL.. And VI is not detected in any of the IRAS far-infrared bands. And I, II, III & V are not detected by IRAS either (see Paper I). Far-infrared emission, as seen by IRAS, is the signature of warm dust. As discussed in Paper I, some Local Group dwarf irregular galaxies are detected by IRAS. And VI’s non-detection in the far infrared is consistent with And VI being a dSph galaxy. However, the non-detection by IRAS does not eliminate the possibility that And VI is a low-luminosity relatively quiescent dwarf irregular galaxy. The H data and the color–magnitude diagram provide stronger evidence on And VI’s classification.
4 Color–Magnitude Diagram
The next step in our study of And VI is the construction of a color–magnitude diagram for its resolved stars in order to derive its distance and explore its stellar populations characteristics. Instrumental magnitudes were measured on the deep And VI WIYN images using the IRAF implementation of the daophot crowded-field photometry program (Stetson 1987, Stetson et al. 1990). The standard daophot procedure was used, culminating in multiple iterations of allstar. Stars with anomalously large values of the daophot quality-of-fit indicator CHI were deleted from the photometry lists.
Large-aperture photometry was performed for the 13 well-exposed Landolt (1992) photometric standard stars. Adopting mean atmospheric extinction coefficients for Kitt Peak, photometric transformation equations were derived. Only a zeropoint and a linear color term of small size were needed to represent the transformation for each filter. For each of , , and , several stars that are well exposed on both the deep And VI images and the And VI images from the photometric calibration night were used to derive the magnitude offsets between the deep images and the standard system.
The (,–) color–magnitude diagram of And VI is shown in Figure 6. We used the spatial distribution of the stars in the red-giant region of the color–magnitude diagram to determine a reasonably precise center for And VI.555The (x,y) coordinates of this center were transformed to celestial coordinates using the Hubble Space Telescope Guide Star Catalog. This is the origin of the celestial coordinates for And VI given in the first paragraph of Sec. 2. Only stars within 370 pixels (73 arcsec) of this center are plotted in Figure 6. This radius was chosen in order to provide a reasonably large sample of And VI members while minimizing contamination by field stars and is similar to the core radius of 76 arcsec (Caldwell 1999). Our And VI color–magnitude diagram clearly shows a red giant branch. The contamination of the color–magnitude diagram by foreground stars appears rather minor (see also below).
In order to interpret the color–magnitude diagram, an estimate of the foreground reddening is necessary. Note that different authors have adopted slightly different reddenings to the M31 companions. We adopt E(–) = 0.06 0.01 for And VI based on the IRAS/DIRBE results of Schlegel, Finkbeiner, & Davis (1998). This value is 0.02 mag larger than that adopted by Grebel & Guhathakurta (1999) because they applied a correction for the mean difference between the Schlegel et al. (1998) E(–) values and those of Burstein & Heiles (1982). Assuming = 3.2E(–) and the E(–) to E(–) conversion of Dean, Warren, & Cousins (1978), E(–) = 0.08 0.01 and = 0.11 0.02.
A distance can be derived for And VI using the magnitude of the tip of the red giant branch (Da Costa & Armandroff 1990; Lee et al. 1993a). Figure 7 shows a cumulative luminosity function in for And VI (again, for stars within 370 pixels [73 arcsec] of the And VI center). Color limits of 0.9 – 2.2 have been used in constructing the luminosity function in order to maximize its sensitivity to And VI red giants and to minimize its dependence on foreground contamination. No correction for foreground contamination has been applied to the luminosity function for the following reasons. Even in the corners of our And VI images, the And VI giant branch is seen. Thus we have no true foreground/background measurement. However, a color–magnitude diagram for the corners of our images (distance from And VI’s center 191 arcsec) that covers 2.8 times more area than represented in Figures 6 and 7 shows no stars with within the color limits used to calculate the luminosity function. Therefore, over the magnitude and color intervals that we are identifying the red giant branch tip, Figures 6 and 7 are quite free of field contamination. Based on the magnitude at which the luminosity function begins to rise strongly (see Figure 7, especially the inset which shows the derivative of the cumulative luminosity function), the magnitude of the red giant branch tip in And VI is 20.56 0.10. This value is supported by the apparent location of the red giant branch tip in the color–magnitude diagram (see Figure 6). For metal-poor systems such as And VI (as demonstrated below), the red giant branch tip occurs at = –4.0 (Da Costa & Armandroff 1990; Lee et al. 1993a). This results in distance moduli of (–)I = 24.56 and (–)0 = 24.45 0.10, corresponding to a distance of 775 35 kpc.
As discussed in Da Costa et al. (1996) and Paper I, the best available Population II distances for M31 (on the same distance scale as the red giant branch tip calibration used above) are: 760 45 kpc based on the red giant branch tip (Mould & Kristian 1986) or RR Lyrae stars (Pritchet & van den Bergh 1988) in the M31 halo; or 850 20 kpc from the horizontal branch magnitudes of eight M31 globular clusters (Fusi Pecci et al. 1996). Our distance for And VI is consistent, within the combined uncertainties, with both of these M31 distances. Thus And VI is at approximately the same distance along the line of sight as M31, suggesting an association between And VI and M31. Note also that our line-of-sight distance of 775 35 kpc for And VI is very similar to those of And I (810 30 kpc; Da Costa et al. 1996), And III (760 70 kpc; Armandroff et al. 1993), and And V (810 45 kpc; Paper I), all on the same distance scale. And VI’s projected distance from the center of M31 is 271 kpc. The Galactic dwarf spheroidal Leo I has a Galactocentric distance of 250 kpc, comparable to And VI’s projected distance from M31. The above line-of-sight and projected distances strongly suggest that And VI is a member of M31’s satellite system.
Two other groups have recently published color–magnitude diagrams for And VI (Grebel & Guhathakurta 1999; Hopp et al. 1999). Their distances for And VI based on the tip of the red giant branch, 830 80 kpc (Grebel & Guhathakurta 1999) and 795 75 kpc (Hopp et al. 1999), are consistent with our value of 775 35 kpc. All three determinations adopt the same zeropoint for the tip of the red giant branch method and thus are on the same distance scale.
Based on the (,–) and (,–) color–magnitude diagrams, we identify the two obvious bright blue stars in Figures 6 and 8 as possible post-asymptotic giant branch (PAGB) stars. These two stars have apparent , , and magnitudes of 21.11, 20.95, 20.13, and 21.44, 21.43, 21.30, respectively. Bond (1996) suggested that PAGB stars may be useful Population II distance indicators where = -3.4 0.2. The average observed, extinction-corrected, magnitude for these two stars is . Thus, the PAGB distance modulus to And VI is (–)0 = 24.40 0.31, or 760 110 kpc, in excellent agreement with distances based on the red giant branch tip.
Using our distance from the red giant branch tip and adopted reddening for And VI, we have overplotted its color–magnitude diagram with fiducials representing the red giant branches of Galactic globular clusters that span a range of metal abundance (Da Costa & Armandroff 1990). Figure 6 displays the And VI (,–) color–magnitude diagram with fiducials for M15 ([Fe/H] = –2.17), M2 (–1.58), NGC 1851 (–1.16), and 47 Tuc (–0.71, dashed line). In the color–magnitude diagram, the bulk of the And VI red giants are bounded by the M15 and NGC 1851 loci. The mean locus of the And VI red giant branch is similar to the M2 fiducial.
For an old stellar system (as demonstrated below for And VI), the (–)0 color of the red giant branch is primarily sensitive to metal abundance. Armandroff et al. (1993) presented a linear relation between (–)0,-3.5 (the color of the red giant branch at = –3.5, corrected for reddening) and [Fe/H]. Using the distance modulus derived above, = –3.5 corresponds to = 21.06 for And VI. Thus, the mean dereddened color for stars in the magnitude interval 20.96 21.16 and within 370 pixels (73 arcsec) of And VI’s center was computed, excluding one obvious non-member, and yielding (–)0,-3.5 = 1.38 0.04 (where the error also includes a 0.03 mag contribution due to photometric zeropoint uncertainty and a 0.01 mag contribution from reddening uncertainty). Applying the Armandroff et al. (1993) calibration results in a mean abundance for And VI of [Fe/H] = –1.58 0.2. This metallicity is normal for a dwarf spheroidal (e.g., see Figure 9 of Armandroff et al. 1993). The mean metal abundance derived here for And VI, –1.58 0.2, agrees with that of Grebel & Guhathakurta (1999), –1.35 0.3, to within the combined uncertainties.
The And VI giant branch in Figure 6 exhibits some width in color at constant magnitude. The standard deviation in – of the 24 And VI red giants used to calculate (–)0,-3.5 is 0.09 mag. This is much larger than the mean photometric uncertainty for these same stars of 0.026 mag. Although this photometric uncertainty results from allstar and does not account for the crowding in the realistic way that artificial star tests would, it does suggest that And VI exhibits a range of metal abundance. A standard deviation of 0.08 mag in – at = –3.5 corresponds to a standard deviation in abundance of 0.3 dex. Grebel & Guhathakurta (1999) also concluded that And VI has a range in metal abundance. A much more definitive investigation of the abundance distribution in And VI will result from HST/WFPC2 observations to take place during Cycle 8 (see the analogous results on the abundance spread in And I by Da Costa et al. 1996).
The presence of upper asymptotic giant branch (AGB) stars, stars significantly more luminous than the red giant branch tip, in populations with [Fe/H] –1.0, is the signature of an intermediate-age population (one whose age is considerably less than that of the Galactic globular clusters). Armandroff et al. (1993) estimated the fraction of And I’s & And III’s total luminosity that is produced by an intermediate-age population using the numbers and luminosities of upper-AGB stars, following the formalism developed by Renzini & Buzzoni (1986). This analysis yielded an intermediate-age (3–10 Gyr) population fraction of 10 10% for both And I & III. Following the same methodology, Paper I found no significant evidence for upper-AGB stars, and thus no significant intermediate-age population, in And V.
For And VI, we again adopt from Armandroff et al. (1993) the limits that correspond to 3–10 Gyr upper AGB stars: –3.8 to –4.6. We use the bolometric corrections to magnitudes from Da Costa & Armandroff (1990) and our distance modulus from the red giant branch tip to calculate bolometric magnitudes. In our And VI (,–) diagram for stars within 73 arcsec of the And VI center (Figure 6), there are five stars within the above interval (all in the range –3.8 to –4.0, with a mean of –3.9; these are the stars above the red giant branch tip with ). There are no such stars in the color–magnitude diagram for objects with radius greater than 191 arcsec that we are using to estimate background (as discussed above). Based on the surface brightness profile from Caldwell (1999), the area from which we have selected upper-AGB stars represents 43% of And VI’s total of –11.3. Then Eq. 14 of Renzini & Buzzoni (1986) and the adoption of the AGB evolutionary rate used in Armandroff et al. (1993) yields an intermediate-age (3–10 Gyr) population fraction of 13 6% for And VI. The error is estimated solely from counting statistics for the upper-AGB stars. Thus, And VI resembles And I & III in the strength of its intermediate-age population. It does not resemble the Galactic dwarf spheroidals Fornax or Leo I that have dominant intermediate-age populations.
No evidence for young, blue main-sequence stars is seen in Figure 6. Except for the star with –=0.13 and =21.30 that we identified as a candidate post-AGB star above, the And VI (,–) color–magnitude diagram is essentially devoid of blue stars. Bluer colors provide enhanced sensitivity to young main-sequence stars. Consequently, our (,–) color–magnitude diagram for And VI is displayed in Figure 8, again for stars within 73 arcsec of the And VI center. Also plotted are red giant branch fiducials for the Galactic globular clusters M15 ([Fe/H] = –2.17) and NGC 1851 ([Fe/H] = –1.16) (Sarajedini & Layden 1997) shifted to the distance modulus and reddening of And VI. As seen in the (,–) color–magnitude diagram, most of the stars in the (,–) color–magnitude diagram are red giants that are bracketed by the M15 and NGC 1851 fiducials. Because our photometry is significantly more precise in and than it is in , we estimate And VI’s metallicity solely from the (,–) color–magnitude diagram.
One also sees a relatively small population of blue stars in Figure 8, with 23 25.4 and -0.4 (–) 0.4. These blue stars seen in the (,–) diagram correspond to the medium brightness blue stars apparent in our color image of And VI displayed in Figure 4. Consider the 10 stars with 23.0 24.0 and -0.1 (–) 0.4 in Figure 8. The spatial distribution of such stars is consistent with membership in And VI; their number density is an order of magnitude lower in the corners of our images than it is within 73 arcsec of the And VI center. In addition, the predictions of Galactic star count models (e.g., Ratnatunga & Bahcall 1985) for blue stars in this magnitude range are two orders of magnitude smaller than observed. Therefore, we conclude that these blue stars are a component of And VI. Their distribution in the (,–) diagram is not indicative of main-sequence stars because they are not sufficiently blue and because they fail to follow a continuous color–magnitude relation. Color–magnitude diagrams of the Galactic dSphs Leo I and Sextans show populations of stars with very similar absolute magnitudes and colors (Lee et al. 1993b; Demers et al. 1994; Gallart et al. 1999; Mateo et al. 1995). Some of these stars are known to be anomalous Cepheids. The HST/WFPC2 imaging of And VI planned for Cycle 8 should provide valuable clarification on this issue, because it will reach substantially deeper with better precision than the current photometry and should determine whether these blue stars are variable. Based on the available data, And VI’s color–magnitude diagrams are consistent with those of other dwarf spheroidal galaxies, confirming the other evidence for a dwarf spheroidal classification.
5 Discussion
The recent discoveries of And VI, And V (Paper I), and the Cas Dwarf (Karachentsev & Karachentseva 1999; Grebel & Guhathakurta 1999), coupled with the recognition that these dSph galaxies are part of the extended M31 satellite system, have changed our view of this system.
Karachentsev (1996) discussed the spatial distribution of the companions to M31. The discoveries of And VI, And V and Cas modify the spatial distribution of the M31 satellites. One asymmetry in the spatial distribution of the satellites results from And I, II & III all being located south of M31, while the three more luminous dwarf elliptical companions NGC 147, 185 and 205 are all positioned north of M31. Also, Karachentsev (1996) noted that there are more M31 companions overall south of M31 than north of M31. As discussed in Paper I, the location of And V north of M31 lessens both of these asymmetries, and Cas’s location north of M31 reduces the asymmetries further (see Figure 2). Because And VI is south of M31, it diminishes the asymmetry reduction provided by the Cas Dwarf.
Karachentsev (1996) called attention to the elongated shape of the distribution of M31 companions, with axis ratio 5:2:1 (based on the galaxies labelled in Figure 2 that were known in 1996 plus the more distant galaxy IC 1613, all of which he argues are associated with M31). On the sky, this elongation occurs primarily along the north–south axis. As discussed in Paper I, And V is located within this flattened spatial distribution. Of all the M31 companions, And VI’s location to the southeast of M31 places it the furthest from this elongated distribution, and nearly on the distribution’s minor axis. The Cas Dwarf is the next most deviant companion from the elongated pattern.
With projected radii from the center of M31 of 112, 271 and 224 kpc, respectively, And V, And VI and Cas increase the mean projected radius of the M31 dwarf spheroidals from 86 kpc to 144 kpc. Karachentsev (1996) also called attention to morphological segregation among the M31 companions, with the dwarf ellipticals and dwarf spheroidals located closer to M31, and the spirals and irregulars on the periphery (see also van den Bergh 1994 regarding segregation among the Galactic companions). The identification of And VI and Cas extends the presence of dwarf spheroidals to galactocentric distances comparable to those of LGS 3 (a transition object between dwarf irregular and dwarf spheroidal) and IC 10 (a dwarf irregular). Thus, And VI and Cas weaken the case for morphological segregation in the M31 satellite system.
The discovery of dwarf galaxies like And VI, And V and Cas augments the faint end of the luminosity function of the Local Group. Because of the special way that nearby dwarf galaxies are selected, the Local Group is uniquely suited to the study of the faint end of the galaxy luminosity function (e.g., Pritchet & van den Bergh 1999). Accurate integrated magnitudes are now available for And VI, And V and Cas from wide-field CCD imaging (Caldwell 1999). When combined with the distance moduli (this paper; Paper I; Grebel & Guhathakurta 1999), these yield values of -11.3, -9.1, and -12.0 for And VI, And V, and Cas, respectively. Luminosity functions for M31’s dwarf companions and for the entire Local Group that include and highlight these three new dwarf spheroidals are shown in Figure 9. The Local Group and subgroup memberships and values for the galaxies besides And VI, And V, and Cas are from Mateo (1998), except for the LMC and SMC which are from Westerlund (1997). And VI, And V and Cas increase the number of galaxies with -9.0 -12.0 that are M31 companions by 75% and in the entire Local Group by 19%.
From a survey of nine clusters of galaxies, Trentham (1998) derived a composite luminosity function that is steeper at the faint end than that of the Local Group (see his Figure 2). He attributed the seeming shortfall at faint in the Local Group to poor counting statistics and/or incompleteness. The discovery of And VI, And V and Cas reduces somewhat the difference between the Local Group luminosity function and Trentham’s (1998) function. To illustrate the difference, we have plotted a version of the Trentham luminosity function, transformed from to assuming (–)0 = 0.70, in Figure 9. The Trentham function has been normalized to match the M31 and Local Group functions in the interval -16 -18. One sees that the luminosity function for clusters of galaxies contains many more galaxies for -13 than are known in the Local Group. Despite the inclusion of the three newly discovered Local Group dwarf spheroidals, the difference between the Trentham (1998) luminosity function and that of the Local Group remains significant at faint ( 95% confidence level). Pritchet & van den Bergh (1999) reached the same conclusion using a somewhat different assemblage of Local Group data. Provided that the Trentham function is representative, we conclude that either faint dwarf galaxies are much less common in the Local Group than in richer clusters or that the Local Group sample is incomplete by 10 to 25 galaxies in the range –12 to –14.
One important issue remains regarding Figure 9. Is the peak of the histogram in the region -11 -12, followed by a decline at fainter magnitudes, real or is it caused by incompleteness and small number statistics? The luminosity function is expected to decline fainter than some because of the inability of sufficiently small proto-galactic gas clouds to collapse and form stars due to photoionization by ultraviolet background radiation (e.g., Thoul & Weinberg 1996). Our continuing search for faint dwarf galaxies in the vicinity of M31 and other Local Group searches should help resolve the issue of where this turnover occurs.
Beyond the observational evidence for a deficit of dwarfs in the Local Group based on Trentham’s (1998) luminosity function, similarly dramatic discrepancies (factors of 15 or more) are suggested by recent theoretical developments. Klypin et al. (1999), for example, present simulations of the hierarchical formation of small groups like our Local Group in the currently favored CDM universe. While 40 Local Group galaxies are known, those authors predict that 500 galaxies should exist for which the vast majority are low luminosity dwarfs. That number doubles when the search radius extends from 300 to 600 kpc from the host galaxy. Our continuing survey around M31, especially when we extend it to larger radii, will provide a tight constraint on the true number of faint dwarf galaxies in the Local Group.
References
- (1) Armandroff, T., Boroson, T., De Veny, J., Heathcote, S., Jacoby, G., Lauer, T., Massey, P., Reed, R., Valdes, F., & Vaughnn, D. 1998a, NOAO CCD Mosaic Imager User Manual (http://www.noao.edu/kpno/mosaic/manual) (Tucson: NOAO)
- (2) Armandroff, T. E., Da Costa, G. S., Caldwell, N., & Seitzer, P. 1993, AJ, 106, 986
- (3) Armandroff, T. E., Davies, J. E., & Jacoby, G. H. 1998b, AJ, 116, 2287 (Paper I)
- (4) Armandroff, T. E., Davies, J. E., & Jacoby, G. H. 1998c, in “Dwarf Tales,” ed. E. Brinks & E. K. Grebel, Vol. 3, p. 2
- (5) Bond, H. E. 1996, in The Extragalactic Distance Scale, ed. M. Livio, M. Donahue, & N. Panagia (Cambridge: Cambridge University Press), 224
- (6) Burstein, D., & Heiles, C. 1982, AJ, 87, 1165
- (7) Caldwell, N. 1999, AJ, submitted
- (8) Da Costa, G. S. 1998, in Stellar Astrophysics for the Local Group, ed. A. Aparicio, A. Herrero, & F. Sanchez (Cambridge: Cambridge University Press), 351
- (9) Da Costa, G. S., & Armandroff, T. E. 1990, AJ, 100, 162
- (10) Da Costa, G. S., & Armandroff, T. E. 1995, AJ, 109, 2533
- (11) Da Costa, G. S., Armandroff, T. E., Caldwell, N., & Seitzer, P. 1996, AJ, 112, 2576
- (12) Dean, J. F., Warren, P. R., & Cousins, A. W. J. 1978, MNRAS, 183, 569
- (13) Demers, S., Irwin, M. J., & Gambu, I. 1994, MNRAS, 266, 7
- (14) Fusi Pecci, F., Buonanno, R., Cacciari, C., Corsi, C. E., Djorgovski, S. G., Federici, L., Ferraro, F. R., Parmeggiani, G., & Rich, R. M. 1996, AJ, 112, 1461
- (15) Gallagher, J. S., & Wyse, R. F. G. 1994, PASP, 106, 1225
- (16) Gallart, C., Freedman, W. L., Mateo, M., Chiosi, C., Thompson, I. B., Aparicio, A., Bertelli, G., Hodge, P. W., Lee, M. G., Olszewski, E. W., Saha, A., Stetson, P. B., & Suntzeff, N. B. 1999, ApJ, 514, 665
- (17) Grebel, E. K. 1997, Rev. Mod. Astron., 10, 29
- (18) Grebel, E. K., & Guhathakurta, P. 1999, ApJ, 511, L101
- (19) Hopp, U., Schulte-Ladbeck, R. E., Greggio, L., & Mehlert, D. 1999, A&A, 342, L9
- (20) Karachentsev, I. 1996, A&A, 305, 33
- (21) Karachentsev, I., & Karachentseva, V. 1998, in “Dwarf Tales,” ed. E. Brinks & E. K. Grebel, Vol. 3, p. 1
- (22) Karachentsev, I. D., & Karachentseva, V. E. 1999, A&A, 341, 355
- (23) Kennicutt, R. C. 1994, in The Local Group: Comparative and Global Properties, ed. A. Layden, R. C. Smith, & J. Storm (Garching: ESO), 28
- (24) Klypin, A. A., Kravtsov, A. V., Valenzuela, O., & Prada, F. 1999, ApJ, submitted (astro-ph/9901240)
- (25) Landolt, A. U. 1992, AJ, 104, 340
- (26) Lee, M. G., Freedman, W. L., & Madore, B. F. 1993a, ApJ, 417, 553
- (27) Lee, M. G., Freedman, W. L., Mateo, M., Thompson, I., Roth, M., & Ruiz, M.-T. 1993b, AJ, 106, 1420
- (28) Mateo, M. 1998, ARA&A, 36, 435
- (29) Mateo, M., Fischer, P., & Krzeminski, W. 1995, AJ, 110, 2166
- (30) Mould, J., & Kristian, J. 1986, ApJ, 305, 591
- (31) Pritchet, C. J., & van den Bergh, S. 1988, ApJ, 331, 135
- (32) Pritchet, C. J., & van den Bergh, S. 1999, AJ, in press (astro-ph/9904250)
- (33) Ratnatunga, K. U., & Bahcall, J. N. 1985, ApJS, 59, 63
- (34) Reid, I. N., Brewer, C., Brucato, R. J., McKinley, W. R., Maury, A., Mendenhall, D., Mould, J. R., Mueller, J., Neugebauer, G., Phinney, J., Sargent, W. L. W., Schombert, J., & Thicksten, R. 1991, PASP, 103, 661
- (35) Reid, N., & Djorgovski, S. 1993, in ASP Conf. Ser. 43, Sky Surveys: Protostars to Protogalaxies, ed. B. T. Soifer (San Francisco: ASP), 125
- (36) Renzini, A., & Buzzoni, A. 1986, in Spectral Evolution of Galaxies, ed. C. Chiosi & A. Renzini (Dordrecht: Reidel), 195
- (37) Sarajedini, A., & Layden, A. 1997, AJ, 113, 264
- (38) Schlegel, D. J., Finkbeiner, D. P., & Davis, M. 1998, ApJ, 500, 525
- (39) Stetson, P. B. 1987, PASP, 99, 191
- (40) Stetson, P. B., Davis, L. E., & Crabtree, D. R. 1990, in ASP Conf. Ser. 8, CCDs in Astronomy, ed. G. H. Jacoby (San Francisco, ASP), 289
- (41) Thoul, A. A., & Weinberg, D. H. 1996, ApJ, 465, 608
- (42) Trentham, N. 1998, MNRAS, 294, 193
- (43) van den Bergh, S. 1972, ApJ, 171, L31
- (44) van den Bergh, S. 1974, ApJ, 191, 271
- (45) van den Bergh, S. 1994, ApJ, 428, 617
- (46) Westerlund, B. E. 1997, The Magellanic Clouds (Cambridge: Cambridge University Press)
| Description | Date (U.T.) | Filter | Exp. Time | FWHM (′′) | |
|---|---|---|---|---|---|
| And VI deep | 1998 Oct 19 | 2 2000 s | 0.8 | ||
| And VI deep | 1998 Oct 14 | 3 1000 s | 0.6 | ||
| And VI deep | 1998 Oct 15 | 2 1000 s | 0.7 | ||
| And VI calibration | 1998 Sept 20 | 600 s | 1.2 | ||
| And VI calibration | 1998 Sept 20 | 1000 s | 1.1 | ||
| And VI calibration | 1998 Sept 20 | 300 s | 1.0 |