The accretion of planets and brown dwarfs by giant stars – II. solar mass stars on the red giant branch
Abstract
This paper extends our previous study of planet/brown dwarf accretion by giant stars to solar mass stars located on the red giant branch. The model assumes that the planet is dissipated at the bottom of the convective envelope of the giant star. The giant’s evolution is then followed in detail. We analyze the effects of different accretion rates and different initial conditions. The computations indicate that the accretion process is accompanied by a substantial expansion of the star, and in the case of high accretion rates, hot bottom burning can be activated. The possible observational signatures that accompany the engulfing of a planet are also extensively investigated. They include : the ejection of a shell and a subsequent phase of IR emission, an increase in the 7Li surface abundance and a potential stellar metallicity enrichment, spin-up of the star due to the deposition of orbital angular momentum, the possible generation of magnetic fields and a related X-ray activity due to the development of shear at the base of the convective envelope, and the effects on the morphology of the horizontal branch in globular clusters. We propose that the IR excess and high Li abundance observed in 4-8% of the G and K giants originate from the accretion of a giant planet, a brown dwarf or a very low-mass star.
keywords:
accretion - planetary systems - stars:low-mass, brown dwarfs - stars:late type - stars:evolution - stars:mass loss - stars:chemically peculiar - stars:rotation - X-ray:stars - infrared:stars1 Introduction
Planets and brown dwarfs have now been detected around several main sequence stars (e.g. Mayor & Queloz 1995, Butler & Marcy 1996, Cochran et al. 1997, Rebolo et al. 1995, 1996, Basri et al. 1996, Marcy et al. 1998, Butler et al. 1998, Delfosse et al. 1998), and strikingly, a fraction of these “hot Jupiters” orbit very close to the central star, at less than 1 AU. This proximity to the central star poses a theoretical problem regarding the mechanism that brought these planets to these orbits, but it also raises the question of their fate. Indeed, Rasio et al. (1996) showed that the orbit of 51 Peg’s companion is tidally unstable and that the planet will ultimately be engulfed in the stellar envelope. The problem we address here is that of the effects of the accretion of a giant planet or a brown dwarf on the structure and evolution of solar mass stars on the red giant branch. This study is the continuation of our previous work (Siess & Livio 1998), in which we investigated the swallowing of massive planets/brown dwarfs by a 3 AGB star.
The general scenario for the accretion process is as follows : planets in close orbits (as observed) will be engulfed in the envelope of giant stars as the latter evolve away from the main sequence. Due to viscous and tidal forces, angular momentum is imparted to the envelope and the planet spirals-in. Previous studies of the spiralling-in process (e.g. Livio & Soker 1984; Soker, Harpaz & Livio 1984) have revealed that depending on the mass of the planet/brown dwarf three different evolutionary paths can take place. If the mass of the planet is larger than some critical value , the planet can accrete a fraction of the envelope mass. On the other hand, lower mass planets will either evaporate or collide with the stellar core. For the specific stellar model used in their computation, Livio and Soker (1984) estimated . However, these results must be taken with great caution since the physical processes were treated only approximatively. We also emphasize that such computations are very sensitive to the stellar model, notably to the size and mass of the convective envelope. More recently, Sandquist et al. (1998) performed 3D hydrodynamical simulations of Jupiter-like planets impacting onto solar type main sequence stars. They also found that depending on the initial stellar model, planets can be evaporated or survive the crossing of the convective zone.
The present work has been motivated by the fact that planets surrounding low mass stars are more likely to be engulfed in the star’s envelope during the red giant branch (RGB) phase than during the asymptotic giant branch (AGB) phase. Indeed, if we compare (for different stars) the ratio of the maximum radius a star can reach during the RGB to its maximum radius on the AGB phase, this ratio is much closer to one for low mass stars () than more massive stars (e.g. Soker 1998a). Consequently, we expect that in most cases low mass stars will interact with close low-mass binary companions on the RGB.
In the present paper, we used a spherically symmetric stellar evolution code to follow the evolution of a solar type star that accretes a giant planet or a brown dwarf on the red giant branch. In 2, we describe briefly the computational approach and the initial models. Then, in 3, we analyze the effects of accretion on the structure and the evolution of the star. We present results for different mass accretion rates and different initial stellar models on the RGB. The observational signatures expected from this process are investigated in detail in 4. A discussion and conclusions follow.
2 Initial conditions
To investigate the effects of planet accretion by solar type stars, we used 3 different evolutionary models of the sun corresponding to 3 different points on the RGB. These models are characterized by their mass, which is equal to , 0.9 and 0.8 and they are referred to as model #A, #B and #C, respectively. The main properties of the initial models are summarized in Table 1. The general RGB structure is a degenerated He core, surrounded by a thin hydrogen burning shell (HBS) that provides most of the luminosity. A thin radiative layer separates the HBS from the large convective envelope. The star was assumed to lose mass as prescribed by Reimer’s law (1975) at a rate given by
| (1) |
where the parameter in our computations, and , , and are given in solar units.
The input physics for the accretion process has been previously described by Siess and Livio (1998). Briefly, to determine the locus of the dissipation process we estimated the Virial temperature of the brown dwarf and the critical radius at which tidal effects lead to a total disruption of the brown dwarf. For characteristic values of the mass and radius for the brown dwarf, we found a temperature of a few million K and a critical radius of the order of . From the numbers presented in Table 1, we can localize the accretion process at the bottom of the convective envelope near the HBS. To estimate the accretion rate , we determined the orbital decay timescale of the brown dwarf in the vicinity of the dissipation region. This timescale roughly corresponds to the time required by the brown dwarf to cross the dissipation region and thus represents the rate at which mass is added there. For typical stellar parameters, we inferred mass accretion rates of the order of yr-1, depending mainly on the mass of the brown dwarf.
| #A | #B | #C | |
| Mass () | 0.9928 | 0.9004 | 0.8072 |
|---|---|---|---|
| Radius () | 10.72 | 88.71 | 137.10 |
| L () | 45.2 | 1133.6 | 2016.3 |
| age ( yr) | 12.1398325 | 12.1999969 | 12.2022346 |
| 0.3324 | 0.2366 | 0.2098 | |
| Menv,bot () | 0.2583 | 0.3904 | 0.4336 |
| MHBS,top () | 0.2474 | 0.3883 | 0.4322 |
| Mcore () | 0.2419 | 0.3867 | 0.4310 |
| Renv,bot () | 0.543 | 0.791 | 0.831 |
| RHBS,top () | 0.08586 | 0.1033 | 0.1060 |
| Rcore () | 0.02587 | 0.02538 | 0.02492 |
| (g cm-3) | 4.057 | 1.586 | 8.715 |
| (g cm-3) | 2.733 | 0.3726 | 0.2510 |
| (g cm-3) | 369.7 | 135.2 | 112.0 |
| Tenv,bot ( K) | 3.286 | 2.324 | 2.209 |
| THBS,top ( K) | 11.0 | 12.3 | 12.6 |
| Tcore ( K) | 29.8 | 44.5 | 48.2 |
| Tc ( K)‡ | 34.6 | 60.9 | 69.9 |
†gyration radius []
‡central temperature
During the accretion phase, we adopted a uniform mass deposition profile as described in Siess and Livio (1998). More specifically, we deposit in each numerical shell an amount of accreted matter proportional to the mass of the shell, starting from the top of the HBS and up to a radius . Our simulations indicate that small changes in the profile of mass deposition do not substantially affect the results. The main point here is the depth at which the mass is deposited inside the star, and in the following sections we identify the accretion zone as the region located close to the base of the convective envelope where most of the energy accompanying the accretion process is released. Finally, if the convective envelope reaches the HBS (beginning of Hot Bottom Burning or HBB), the matter is deposited from the base of the convective envelope (which is inside the HBS). In our computations, we also assumed that the matter is deposited with the same entropy as the one of the local matter, implying that the rotational energy has been used to heat up the accreted matter (e.g. Harpaz & Soker 1994). The deposition of accreted matter is also accompanied by modifications of the chemical abundances. We adopted a solar metallicity with relative abundances given by Anders and Grevesse (1989) for the accreted matter and we assumed that deuterium had been previously burnt in the brown dwarf. Finally, for numerical convenience, we turned off the mass loss during the accretion phase and used grey atmosphere models to speed up the convergence process.
3 Numerical results
The stellar evolutionary code used in these computations has been described in detail in several papers (e.g. Forestini & Charbonnel 1997, Siess et al. 1997) and we refer the reader to those publications for more details. Computations are presented for 2 characteristic accretion rates of and yr-1, and they involve different masses for the planet/brown dwarf (see Table 2).
| Models | () | (yr-1) | accreted mass () |
| A0 | 0.99 | 0.10 | |
| A1 | 0.99 | 0.01 | |
| A2 | 0.99 | 0.10 | |
| A3 | 0.99 | 0.01 | |
| B0 | 0.90 | 0.10 | |
| B1 | 0.90 | 0.01 | |
| B2 | 0.90 | 0.0051 | |
| B3† | 0.90 | 0.0058 | |
| C0 | 0.81 | 0.10 | |
| C1 | 0.81 | 0.01 | |
| C2 | 0.81 | 0.0010 | |
| C3 | 0.81 | 0.0025 | |
| C4† | 0.81 | 0.0030 |
†For these models, we were not able to follow reliably the evolution and the computations were stopped at the indicated accreted mass
3.1 Evolution of the structure for lower accretion rates

The deposition of mass in the star is accompanied by the release of a large amount of gravitational energy that acts to expand the envelope (Fig. 1). However, because of the long timescale of heat diffusion, the expansion is delayed, especially for the low luminosity stars (cases A0 and A1). As the radius increases, the star also becomes more luminous. According to Reimer’s law, these modifications to the structure significantly increase the mass loss rate, and we expect some changes in the subsequent evolution and stellar environment (see 4.4 and 4.5). The expansion proceeds until a thermal equilibrium is reached, in which the rate of energy loss by the surface balances the rate of energy deposition by the accretion process. Depending on the initial model, the return to contraction occurs after , and yr, in cases A0, B0 and C0, respectively. This timescale corresponds roughly to the time of heat diffusion (thermal timescale) of the expanding part of the star and it is approximatively given by , where is the mass of the envelope and is the accretion luminosity. The latter is given by , where is the mass accretion rate and and the mass and radial coordinates of the accretion zone. It should be noted that represents an upper limit to the accretion luminosity since energy is lost during the spiralling-in process to heating and spinning up the envelope. However, throughout most of the envelope, the orbital energy disspation rate represents a small fraction of the intrinsic stellar luminosity and thus we do not expect that the stellar structure will be significantly affected until the planet reaches the accretion zone. Finally, we should mention that the energy deposition might not be local (in the accretion region). For example, the star could be tidally excited, oscillations may be initiated and then damped elsewhere in the envelope. Also, in this common envelope phase, magnetic fields might be generated in the accretion region (see 4.3) and energy could be dissipated at the surface of the star or in the corona (e.g. Regos & Tout 1995).
During the envelope expansion, the opacity increases in the accretion region and rapidly the radiative gradient becomes larger than the adiabatic one (); thus the convective envelope deepens (Fig. 2). Thereafter, as the HBS advances in mass and reaches the cool regions that have been previously expanded, the nuclear energy production rate decreases significantly. As an order of magnitude, during most of the accretion phase, the luminosity due to H burning represents only a few percent of the total stellar luminosity. The accretion luminosity thus supports the convective envelope almost entirely and the accretion region acts as a source shell that prevents an efficient H burning.

To see how the structure is affected by the accretion process, we have presented in Fig. 3 the profiles of several variables for case A0, but they are globally similar in the other models. In the accretion region where a large amount of energy is deposited, the luminosity and temperature rise. But, due to the relatively long timescale associated with heat diffusion, energy accumulates locally and both profiles now present a bump. The heat excess finally diffuses when the star has sufficiently expanded and a monotonically increasing luminosity profile is restored. However, the temperature profile still presents a local maximum that persists throughout the accretion phase. This is due to the fact that this region undergoes a compressional heating from the mass accumulated above it and also from the expanding region surrounding the core. Indeed, the luminosity is negative just behind the luminosity jump, indicating a region in expansion (). The temperature is thus compelled to rise and, as we shall see in 3.3, this situation can give rise to a thermal instability. The temperature gradient also becomes progressively steeper beyond the bump (Fig. 3) as energy accumulates. This contributes to the shrinkage of the HBS and to the subsequent drop in the nuclear luminosity.

In the HBS, prior to accretion, the nuclear energy production rate is mainly supplied by the CNO bi-cycle. More precisely, the most important reactions (and their contribution) are 13C(p,)14N (), 14N(p,)15O (),15N(p,)12C () and 15O()15N (). However, because the HBS advances in mass into a cooler region, the pp1 branch progressively takes over the nuclear energy production and during the accretion phase, the reactions 2 3He(,2p) and 13C(p,)14N contribute % and % of the total nuclear energy production, respectively. On the other hand, in the region of maximum temperature, 13C is now efficiently burnt through the 13C(,n)16O reaction. This reaction is highly energetic and provides up to of the global nuclear energy production (which still remains very low, however). In Fig. 4, we show the evolution of the nuclear activity for case B0. First, 13C burning is ignited in the vicinity of the temperature peak (dotted line). Then, as it is depleted and converted into 16O, the nuclear energy production rate progressively decreases near the temperature peak (short-dashed and long-dashed curves), and finally we end up with a configuration in which 13C is burnt through 13C(,n)16O around the temperature peak and through 13C(p,)14N above the bump in the HBS. In case C0, the temperature in the peak reaches K and He is ignited off-center in a non degenerate shell (we will discuss this special case further in 3.3).

3.2 Higher accretion rates
For higher accretion rates, the situation is somewhat different because of the appearance of hot bottom burning (HBB). Indeed, contrary to the lower accretion rate case, the larger energy release contributes to a further increase in the opacity and the convective envelope deepens even more. It finally reaches the HBS where its advance stops (Fig. 5). Our computations indicate that HBB is activated approximately 200, 25 and 15 yr after the onset of accretion in cases A2, B2 and C2 respectively. The temperature at the base of the convective envelope rises suddenly from to about million Kelvin, depending on the initial model. However, this temperature is still too low to give rise to a rich nucleosynthesis.

The onset of HBB entails a significant and fast expansion of the envelope as heat is directly transferred to the convective zone. Moreover, the arrival of 3He from the convective envelope and its destruction through the reaction 2 3He(,2p) increases temporarily the nuclear luminosity in the HBS. During the HBB phase, 7Li is slowly depleted because of the competing effects of Li production through the reactions (3He,)7Be()7Li and Li destruction through the reaction 7Li(p,) (see also 4.1).
Finally, in cases B2 and C2 we were not able to follow reliably the computations. The star’s tendency to expand and increase its luminosity made the computations intractable. At that point the envelope is probably ejected and the star enters a proto-planetary nebula phase.
3.3 The relaxation of the star
After the end of the accretion phase, the envelope rapidly contracts because of the sudden suppression of accretion energy. However, in the models in which the duration of the accretion process is shorter than the thermal timescale associated with the envelope (as in cases B1 and C1 for example), the expansion still proceeds for a while after the end of mass addition. Thereafter, the gravitational energy released during the contraction phase heats up the central parts of the star and the HBS re-ignites. During that period of contraction, the convective envelope retreats towards the surface and HBB disappears. The contraction rate is very fast, especially for stars having a shallower convective envelope. The computations indicate that in a few thousand years, the radius decreases by a factor of which, we suspect, could initiate stellar pulsations. When the HBS finally provides most of the stellar luminosity (%), the contraction ends and the star resumes a standard evolution, climbing the red giant branch until He flashes at its tip. Interestingly, the star is now more luminous and has a larger radius than in the standard evolution despite the small amount of added mass (Fig. 1). The enhanced mass loss rate that follows can affect the subsequent evolution (see 4.5).
In all our simulations, except for case C0, the temperature “bump” dissipated as the gravitational energy released during the contraction phase heated up the stellar interior. However in this particular model, in which the accretion process is maintained for yr at a rate equal to yr-1, the temperature in the peak reaches K and He ignites off-center in a non degenerate shell. The ignition of He through the reactions is very energetic and this gives rise to a thermal instability (Fig. 6).

The geometrical thinness and the large opacity of the He burning shell (HeBS) are responsible for the thermal runaway that leads to the development of a convective tongue. The release of energy due to He burning is used to expand the layers above and secondarily to heat up the core. The HBS is pushed outward into a cooler region and it extinguishes. The remaining energy excess is then absorbed by the envelope which subsequently expands. During the thermal pulse, the nuclear energy production comes from 3 (%), 14N()18F () and, to a lesser extent, from 18O()22Ne and 18O()22N ( each). The thermal pulse is also responsible for the further destruction of H through 12C(p,)13N. After a significant expansion that allows the star to get rid of the energy excess, contraction resumes. However, due to the extremely low H content left after the pulse (the H mass fraction ), the HBS cannot ignite before a new thermal instability is triggered. A new He shell flash thus occurs deeper inside the star where both the temperature and He abundance are higher. As evolution proceeds, the pulse duration increases but the maximum luminosity due to He burning decreases mainly because of the progressive lifting of the core degeneracy as the temperature increases. During the subsequent evolution, the star experiences relatively short phases of expansion following the thermal pulses and longer phases of contraction. The deepening of the pulse accounts for the smaller and smaller increase in radius following the He shell flashes since most of the released energy is absorbed in the radiative layers before reaching the convective envelope. After the 12th pulse, the HBS ignites precisely at the mass coordinate corresponding to the top of the first convective tongue in which the H abundance is high (). The H luminosity then increases and the thermal pulse finally reaches the center of the star. Because of the previous thermal instabilities, the degeneracy has been lifted in the interior and consequently He does not flash. Helium is now burnt at the center and the star will spend the next yr on the Horizontal branch.
4 Potential observational signatures of an accretion event
In this section, we attempt to give a broad overview of the different observational signatures that might be expected from the accretion of a planet or a brown dwarf by a giant star on the red giant branch. In general, effects may be expected in at least six different areas, which we describe in some detail below. The modifications to the structure during the accretion process increase the mass loss rate and may lead to the ejection of shells. They also have potential effects on the morphology of the horizontal branch. The deposition of angular momentum during the spiralling-in process can also alter the stellar structure by increasing the rotation rate and this may also produce X-ray emission. Finally, the mixing of the dissipated planet material in the envelope can change the surface chemical abundances. All of these effects may have important observational consequences but, as we shall see in the following sections, it is more the combination of several signatures, such as a high rotation rate and/or a large IR excess and/or a high lithium abundance that can identify an accretion event less ambiguously, rather than the detection of one particular signature.
4.1 Modifications of the photospheric chemical composition
During the red giant phase, chemical changes are mainly the result of “dilution” effects due to the deepening of the convective envelope but light elements such as 7Li, 9Be and 11B can also be burnt as the convective envelope approaches its deepest extent. The first dredge up reduces the 7Li abundance by more than 2 orders of magnitude. There is also a decrease in the 12C/13C ratio by a factor of 3, changing from about 83 to 26. The first dredge up also accounts for the large enrichment of 3He as a by product of H burning.
With our assumed chemical composition for giant planets and brown dwarfs (from Anders & Grevesse 1989), the deposition of accreted matter, mostly in the convective envelope, will principally modify the chemical abundances of the light elements that were previously depleted during the first dredge up. In that respect, 7Li will be the most affected. Our computations indicate that, depending on the accreted mass, the 7Li abundance can be increased by more than 2 orders of magnitude, making this element easily detectable at the surface of the star111Following de la Reza et al. (1996), we define as a “Li rich G or K giant” a star with a Li abundance larger than log [where by definition log H] (see also 4.6). As an illustration, we present in Fig. 7 the 7Li surface abundances resulting from our computations and compare them with what is expected from simple dilution effects. In the dilution hypothesis, we assume that the envelope mass is held constant during the accretion process and that no nuclear burning is taking place in the convective zone. The mass fraction of an element is then simply given by
| (2) |
where is the mass accreted into the envelope, and and are the mass fraction of element in the envelope and in the accreted matter, respectively. Note that this expression is general in the sense that can either represent the H mass fraction , the He mass fraction or the metallicity . Figure 7 shows that the simulations follow relatively well the theoretical curves defined by Eq. (2). The slight deviations from this relation are mainly due to nuclear burning that causes Li depletion. Note that in case A2, 7Li is severely depleted due to the long lasting HBB.

The deposition of accreted matter will also increase the 9Be and 11B chemical abundances, but to a lower extent, since the effects of dilution during the first dredge up are smaller for these elements. A modest increase in the 12C/13C ratio can also take place.
The effects of planet accretion on the stellar metallicity are very sensitive to the amount and chemical composition of the accreted material and also to the mass of the convective envelope (which depends on the evolutionary status of the star). If the metal content of the giant planet is higher than the one adopted here, the metallicity can be further enhanced. Secondly, if the planet is engulfed while the star is still on the main sequence for example, the convective envelope is then very shallow ( for the sun), and consequently the stellar photospheric composition can be substantially modified (Eq. 2). Recent determinations of the chemical composition of the main sequence stars hosting planets (Gonzales 1997, 1998) indeed show that in some cases the metallicity is abnormally high, suggesting that proto-planetary material or planets have been accreted (e.g. Lin et al. 1996, Laughlin & Adams 1997). More recently, Sandquist et al. (1998) showed that a Jupiter-like planet can be evaporated in the convective envelope of the sun. They also inferred that in some cases a metal enrichment as high as 50% can be obtained, but the exact value depends greatly on the mass of the convective zone and on the chemical composition and interior structure of the giant planet.
All the above suggests that if the presence of planets around solar type stars is rather common, and if some of these planets are indeed in close orbits, then certain chemical peculiarities in giants stars may be the consequence of the accretion of planets.
4.2 Rotation
During the spiralling-in process, angular momentum is imparted to the envelope. As a consequence, the stellar rotation rate will be substantially increased. More quantitatively, if all the orbital angular momentum of the planet is entirely deposited and redistributed in the envelope, i.e. if we assume that the convective envelope is rotating rigidly, then the ratio of the envelope angular velocity to the critical velocity (surface Keplerian angular velocity) is given by
| (3) |
where is the orbital separation of the brown dwarf, the gyration radius and the mass of the envelope. Equation (3) indicates that only massive planets or brown dwarfs () can spin-up the giant envelope to a significant fraction of the Keplerian velocity (%). The spin-up would be most effective at the tip of the giant branch, where both and are smaller.
Measurements of the projected rotational velocity of luminous class III giants indicate a sudden drop in v sin i near spectral type G0 III (Gray 1989). The same discontinuity is also observed in subgiants at spectral type F8 IV (Gray & Nagar 1985) and on the main sequence near mid-F stars (Kraft 1970). These observations thus delineate in the HR diagram a rotational dividing line (RDL) where slow rotators ( ) populate the cool side (de Medeiros et al. 1996b). The strong braking at the rotational discontinuity occurs very rapidly, perhaps on a time scale as short as yr or less (Ayres et al. 1998), and probably results from an efficient magnetic braking attributed to a dynamo action (Gray 1981, 1982). In the “rotostat” hypothesis (Gray 1986), angular momentum is dredged up from the rapidly rotating core by the deepening of the convective envelope. This activates the dynamo and then an efficient magnetic braking takes place. In this model, the rotation rate is controlled in a self-regulatory way by the balance between the arrival of angular momentum from the core and the strong braking that ensues, and consequently, the rotational velocity is maintained constant. However, a few stars do not conform to this scheme and still rotate rapidly beyond the RDL, challenging the rotostat hypothesis. For example the case of 7 Boo = HR 5225 remains unexplained (Gray 1989, 1991). This single star of spectral type G5III has a moderate lithium abundance log (Li)=1.2 and its rotational velocity (v sin i = 14.1 ) is three times higher than the average. This isolated case could fit into a scenario in which the giant star has recently accreted a planet and its surface layers have not yet spun down. The moderate lithium abundance would suggest the accretion of a relatively small planet. More generally, de Medeiros et al. (1996a) found that among a sample of stars, less than % of the late G and K giants located to the right of the RDL have .
On the other side (left) of the RDL, FK Comae-type stars show extreme rotation velocities, (). The general explanation for their fast rotation assumes that these single G or K giants are undergoing (or have just completed) coalescence with a close binary companion (e.g. Webbink 1977, Bopp & Stencel 1981, Livio & Soker 1988, Welty and Ramsey 1994). Other scenarios have also been proposed and they generally invoke tidal synchronization in a very close binary, normal evolution from a rapidly rotating upper main sequence star, or the dredge up of angular momentum (e.g. Simon & Drake 1989). But, as pointed out by Rucinski (1990), FK Coma has a few times more () angular momentum than a typical rapidly rotating main sequence star. Therefore, some angular momentum must have been added (accreted) to the star. Generally FK Comae-like stars lack photospheric lithium detection. However in some cases, e.g. HD 36705 (Rucinski 1985), HD 33798 (Fekel & Marschall 1991) or 1E 1751+7046 (Ambruster et al. 1997), a high lithium abundance has been observed (see also 4.6). These observations clearly support our accretion scenario since they combine two different outcomes of the accretion process : a high rotation rate and a high Li abundance. However, different scenarii have also been proposed and among them the possibility that these stars were initially fast rotating A or F type stars that have rapidly evolved in the Hertzsprung gap. The suggestion is then that they recently became giants and are now depleting lithium due to the deepening of the convective envelope (Fekel 1988). It has also been suggested (Fekel & Marschall 1991) that angular momentum and CNO processed material can be dredged up from a rapidly rotating core as the convective zone deepens. In this scenario Li can be produced and burnt through the chain 3He()7Be()7Li()4He and, if on its way to the surface Li is not entirely depleted, then we may account for temporarily high rotation together with enhanced lithium abundance. However, this hypothesis would imply that essentially every star arriving to the RGB should go through a phase of fast rotation and high Li abundance. The paucity of such candidates poses a severe problem to this scenario and can be regarded as additional evidence against the rotostat hypothesis.
To conclude this section, we feel that observations support the coalescence hypothesis for the explanation of FK Comae-like stars and we stress that rapidly rotating stars may also have accreted angular momentum from the swallowing of a giant planet or a brown dwarf (see also Vitenbroek et al. 1998). The planet accretion scenario can also account for enhanced Li abundances and in that respect, HD 33798 and HD 36705 are good candidates for such an event. Finally, we would like to point out that fast rotation velocities, of the order of 15-40 , have also been observed in horizontal branch stars (e.g. Peterson et al. 1995, Cohen & McCarthy 1997). Notably, Peterson et al. (1983) already mentioned that the deposition, during the red giant phase, of the orbital angular momentum of a planet of a few Jupiter masses could account for the fast rotational velocities observed in horizontal branch stars. Some AGB stars also exhibit high rotation rates (e.g. V Hydrae). For these exceptional stars, the rapid rotation rate is thought to be due to spinning up by a companion that has been swallowed or is in a common envelope phase (Barnbaum et al. 1995). More generally, the deposition of angular momentum in the envelope of evolved stars by a companion (even substellar) is frequently invoked to explain the axisymmetrical morphology of bipolar nebulae (e.g. Iben & Livio 1993, Livio 1997).
4.3 X-Ray emission
If the accretion of angular momentum can cause the star to rotate differentially then differential rotation and convection can generate a magnetic dynamo. The magnetic field can then confine the plasma in the stellar chromosphere and produce X-ray emission activity. To see if this scenario is plausible, let us first examine the observational situation.
Observations indicate the existence of an X-ray dividing line in the HR diagram (XDL also called coronal dividing line) which delimits giant stars with (to the left) and without coronal emission characteristic of high temperature gas ( K). In the HR diagram, this line is approximatively vertical at spectral type K3 and it spans the luminosity classes II, III and IV (Haisch et al. 1991, 1992). Note that bright giants of luminosity class II and Ib turn out to be X-ray sources if exposed sufficiently deeply (Reimers et al. 1996). On the right side of the XDL, the vast majority of the stars exhibit a very low X-ray emission (at least below the actual detection threshold) whereas a large spread of X-ray luminosities is observed for G and K giants of earlier spectral type than K3 (Strassmeier et al. 1994, Hünsch et al. 1996). The X-ray emission originates from the stellar corona and requires a strong magnetic field in order to confine the hot plasma, since the thermal velocity of the particles exceeds the escape velocity. Changes in the magnetic field configuration (due to changes in the dynamo) are generally invoked to account for the sudden drop in X-ray emission at the XDL (e.g. Rosner et al. 1991, 1995) but the precise reasons why the dynamo is modified remain unclear. Recently Hünsch and Schröder (1996) presented a “revised” XDL that seems to follow the evolutionary track of a 1.2 star. If this is confirmed, then evolutionary effects may account for this demarcation line. Low mass stars, on the right of the XDL, are generally slow rotators on the main sequence and consequently they sustain a lower magnetic activity. Conversely, more massive stars () have faster rotation rates on the main sequence and therefore they can develop an efficient dynamo and produce a higher X-ray emission. More recently, Hünsch et al. (1998) looked for X-ray emission in the “forbidden” region beyond the XDL and they detected 4 intrinsically X-ray bright M-type giants : 15 Tri, HR 5512, 42 Her and HR 7547. No evidence for binarity exists yet for 15 Tri and HR 5512 but even if the presence of a companion is confirmed, it cannot easily explain the X-ray emission which remains quite unusual222A compact companion such as a white dwarf can be a relatively strong X-ray source if it accretes matter from the giant through an accretion disk. But such a companion would have been detected in their observations.. In a ROSAT survey of a complete, volume limited sample of late type stars, Hünsch et al. (1996) also pointed out the unusual behavior of Sgr = HR 6859, an apparently single, slowly rotating but strong X-ray emitting K3 III giant. Another puzzling case is that of HR 1362 (Strassmeier et al. 1990). Despite its low rotation rate this single G8 IV giant presents an X-ray emission that is more than one order of magnitude higher than that expected from the empirical rotation versus activity trend. The strong emission of HR 1362 led Stepien (1993) to suggest that it might represent an evolved Ap star that has preserved its strong magnetic field. On the other side (left) of the XDL, several unusually bright X-ray sources have also been detected. They are often referred to as Ceti-like stars, based on the prototype Ceti (Hünsch et al. 1996, Maggio et al. 1998), which exhibits an extremely high X-ray luminosity and a slow rotation rate ( ). These observations are puzzling since it is difficult to reconcile the high X-ray emission with the slow rotation rate. Below we investigate the physical effects related to the accretion of a planet/brown dwarf in terms of the generation of magnetic field and X-ray emission.
Suppose that an initially slowly rotating star undergoes an accretion event. As the planet spirals in, it will deposit angular momentum in the envelope and finally dissipate close to the core. However, the resultant profile of angular velocity may not be uniform throughout the envelope but rather may be steeper close to the dissipation region, where the gravitational potential increases abruptly. To quantify this, at least approximatively, we follow Livio and Soker (1988) and estimate the parameter defined by
| (4) |
where represents the decay timescale of the planet’s orbit, and is the spin-up timescale of the envelope. The decay timescale is given by
| (5) |
where the mass interior to and is the gravitational drag force that causes the spiralling-in. Its expression is approximately given by
| (6) |
where is a factor of order for supersonic flows (e.g. Shima et al. 1985), is the accretion radius, the relative velocity between the planet and the envelope and the local density. Finally, the spin-up timescale can be approximated by
| (7) |
where is the moment of inertia of the envelope interior to radius . In the computations for our presented models, we assumed that the relative velocity is Keplerian and impose as in Livio & Soker (1988).

Figure 8 depicts the profiles of for the 3 initial models. Although these profiles are crude estimates, they suggest that a strong differential rotation is likely to take place at the base of the convective envelope, in the regions where . The shear can then sustain a dynamo action and lead to a high X-ray emission (e.g. Regos & Tout 1995). Furthermore, the profiles of indicate that for less evolved configurations the outer layers are not spun-up, and therefore that it is possible to obtain X-ray emission from apparently slowly rotating stars as observed among Ceti-like stars. It is difficult to estimate for how long the slow rotation will be maintained at the surface of the star since such a study would require to take into account the angular momentum transport in the convective envelope coupled with the presence of a strong magnetic field. Additionally the outcome depends on the evolutionary status of the star. We expect however that the spin up the envelope will take longer in younger and less centrally condensed stars for which in a larger fraction of the envelope. In some configurations magnetic braking may not allow a significant spin-up of the outer layers. Some indications that differential rotation may persist in the interior of stars are suggested by observations. Indeed, in the HR diagram, the rotational (4.2) and X-ray dividing lines are shifted with respect to one another. Thus, stars located between these two lines present both a magnetic activity and a slow rotation rate. If this shift between the dividing lines corresponds effectively to an evolutionary sequence, this indicates either that the rotational braking timescale is shorter than the decay timescale associated with the dynamo activity or, alternatively, that differential rotation is still maintained in the stellar interior and sustains a dynamo activity.
To summarize this section, the deposition of angular momentum by a spiralling-in planet/brown dwarf can produce a strong differential rotation at the base of the convective envelope. We then suspect that in this region a magnetic field can be generated via an dynamo and that this may ultimately result in an enhanced X-ray activity. Note that the magnetic field can also be used to brake the star. Finally, we would like to mention that the shear may trigger some instabilities that could give rise to extra mixing processes (see 4.6).
4.4 The ejection of shells
The increase in the mass loss rate during the accretion phase can lead to the formation of a shell around the star, and that shell can be expected to emit in the infrared (IR). More quantitatively, the mass loss rate can be increased by a factor of 2 to and a mass of the order can be ejected. These numbers depend however on the evolutionary status of the star, the duration of the accretion event and the accretion rate.

Figure 9 demonstrates the very strong dependence of the mass loss rate on the accretion rate and on the initial model. The higher the accretion rate, the larger is the increase in the mass loss rate. Similarly, the more evolved the star, i.e. the lower its surface gravity, the easier it is to remove material from its surface. Figure 9 also indicates that the rate of increase in is faster for older stars. This is an illustration of the thermal response of the star since is inversely proportional to the Kelvin Helmholtz timescale (). Finally, we would like to emphasize that in the high accretion rate cases (cases B2 and C2), even a relatively small planet of a few Jupiter masses can increase the mass loss rate by about 2 orders of magnitude in a few hundred years!
It is worth noting that in the estimates of the mass loss rate, the effects of rotation have been neglected. The deposition of the orbital angular momentum into the envelope can lower the effective surface gravity and facilitate mass ejection; it can also influence of geometry of the ejection. In particular, if the rotational velocity of the star exceeds some fraction of the break-up speed, then the ejected material could form an equatorially compressed outflow (e.g. Bjorkman & Cassinelli 1993, Owocki et al. 1994, Livio 1997). The peculiar circumstellar environment of U Equulei could be consistent with such a scenario (Barnbaum et al. 1996).
The IR emission associated with giant stars is not easy to explain
(Zuckerman et al. 1995), while in main sequence stars (Vega-like stars) the
emission most likely arises from the dust associated with remnants of the
star formation process or with small bodies like comets or planetesimals
(e.g. Aumann et al. 1984, Telesco & Knacke 1991, Backman & Paresce
1993). In an extensive survey of luminosity class III stars, Plets et
al. (1997) report that % of the giants in their sample have IR
excesses. They conclude that the IR emission is unlikely to be due to a
present-day mass loss episode because, as they argue, in a standard
evolution, mass loss is predominantly efficient during a He shell flash so one
would expect the stars to be more clustered at higher luminosities in the
HR diagram and the dust emission is too cold for a recent
ejection. They thus attribute the IR excess to a reheated dusty disk, as in
Vega-like stars. Instead, we propose that the ejection of a shell resulting
from an accretion event can account for the IR emission. Indeed, this
scenario does not imply a clustering of stars at the tip of the RGB since
the accretion event can, in principle, take place any time once the star
leaves the main sequence. Early engulfing could also account for the cold
dust emission. Moreover, the IR excess is often too large to be attributed
to a Vega-like phenomenon, since during the main sequence phase, most of
the circumstellar debris will probably be evaporated (Zuckerman et
al. 1995). An important test of our scenario can be provided by measuring
the 7Li abundance for example, since this element should, at some
level, accompany the accretion process (see 4.6).
The
detection of a detached shell around the J-type carbon star Y Canum
Venaticorum (Izumiura et al. 1996) is also interesting since this star is
probably in an early evolutionary stage, on the RGB or on the He
core-burning stage. The mass loss rate at the time of shell formation and
the mass of the shell are estimated to be in the range yr-1and , respectively. The present mass loss rate
estimated from CO observations (e.g. Olofsson et al. 1993) is about
yr-1, two orders of magnitude smaller than the past value!
Therefore, if the RGB status of Y CVn is confirmed, the existence of a
massive shell around this star may be a signature of an accretion event,
since no other straightforward model can account for these observations. In
this context, the massive shell and high mass loss rate at the time of
ejection would suggest a very high accretion rate (yr-1).
Shells have also been observed around many AGB stars (e.g. Olofsson et al. 1992, 1996, Bujarrabal & Cernicharo 1994), but such structures can result from episodic high mass-loss events triggered by helium shell flashes (e.g. Olofsson et al. 1990, Izumiura et al. 1997). It is therefore difficult to identify the signature of an accretion event, although the presence of a companion is frequently invoked for the shaping of planetary nebulae (e.g. Soker 1997, Livio 1997). Finally, we should mention that in model C0 the star experiences a series of thermal pulses before reaching the horizontal branch. From, the simulations we can estimate that during every interpulse, a mass of the order of is ejected from the surface of the giant. These episodic ejections would generate distinct shells, separated from each other by a few thousand years. However, the probability that a massive planet would be engulfed at the short-lived tip of the giant branch is rather small.
4.5 Influence on the morphology of globular clusters
The distributions of stars along the horizontal branch (HB) of globular clusters varies from one cluster to another. In some clusters, the population of HB stars exhibits an extended blue tail while others contain only a red HB. It was first recognized by Sandage and Whitney (1967) that the metallicity is the first parameter influencing the morphology of the HB. Generally, more metal-rich clusters have red HBs, while metal-poor clusters have bluer HBs. But, for globular clusters of the same metallicity, the HB morphology can vary widely. Thus some “second parameter” other than metallicity must be affecting the HB morphology. Among potential second parameters, it has been shown that age (e.g. Lee et al. 1994), mass loss (e.g. D’Cruz et al. 1996), He mixing (Sweigart 1997), CNO enhancement (Dorman et al. 1991), core rotation, or structural properties of the globular clusters such as concentration and density can also affect the HB morphology. Nevertheless the discovery of gaps in the blue tail of the HB (e.g. Walker 1992, Catelan et al. 1997, Ferraro et al. 1997) is still considered puzzling.
Recently, Soker (1998b) suggested that planetary systems can influence the HB morphologies. He proposed that the interaction of a RGB star with a giant planet/brown dwarf can affect the mass loss rate and thus the subsequent location of the star on the HB. By depositing angular momentum and energy into the envelope, additional mass can be removed from the star during the RGB. The “peeled off” star will then have a higher effective temperature and will appear bluer in the HR diagram (e.g. Castellani & Castellani 1993, Dorman et al. 1993). In particular, Soker (1998b) argued that, depending whether the planet survives the spiralling-in, collides with the stellar core or evaporates in the envelope, one can account for the 3 gaps observed by Sosin et al. (1997) in the blue tail of NGC 2808.
Our study introduces a quantitative element into the scenario proposed by Soker. Our computations indeed indicate that a significant increase in the mass loss rate accompanies the accretion process, especially if the star is evolved and the accretion rate is high. The simulations also show that, when the star has relaxed, the mass loss rate remains higher than in a standard evolution. We estimated that when a massive planet is accreted (not a brown dwarf), the mass loss rate is enhanced by a factor of after the termination of the accretion process. This is equivalent to setting Reimer’s parameter to a value close to (instead of 0.5) in a standard evolution. If we now refer to the computations of Castellani & Castellani (1993) for such values for , we conclude that stars accreting a planet at the bottom of the RGB, will actually be extremely blue on the horizontal branch. On the other hand, if the accretion occurs later, the effects are difficult to quantify because of the strong sensitivity of our computations to the accretion rate and the planet mass. The effects can be moderate, as in cases C2 or B2, or dramatic, as in cases B3 or C4. The possibility that a planet accretion would modify the evolutionary age of the star and thus affect the morphology of the HB is improbable. Indeed our initial models are relatively old ( Myr) and the duration of the red giant phase is relatively short compared to its age. Also, the accretion of a planet does not modify substantially the mass of the star therefore we don’t expect the stellar evolutionary timescales to be significantly modified.
Sweigart (1997) suggested that an extra mixing driven by internal rotation could transport helium from the HBS into the convective envelope. This would increase the RGB tip luminosity and hence the mass loss, leading to the formation of blue HB stars. Sweigart and Catelan (1998) also showed that only non-canonical mechanisms invoking deep helium mixing, internal rotation or a high initial helium abundance can reproduce the distribution of the blue HB stars in NGC 6388 and NGC 6441. However, these authors did not specify the source of the angular momentum required for the rotation scenario nor how the deep He-mixing process is activated. The accretion scenario can provide some support to these non-canonical processes, since it both offers a natural source of angular momentum for the core and it can be responsible for the generation of strong instabilities as the planet collides with the core (4.3). Note also that some rapid rotators are observed in the blue side of the HB (e.g. Harris & McClure 1985).
Concerning the gaps, recent observations (Ferraro et al. 1998) indicate
that they are not randomly distributed along the HB but rather located at
similar positions in the color-magnitude diagram. Aside from the
star-planet interaction hypothesis (Soker 1998b), it has been suggested
that some poorly specified physical processes must operate during the RGB
to increase the mass loss rate (Ferraro et al. 1998) or that gaps are a
consequence of a bimodal or multimodal mass distribution of the globular
clusters (e.g. Catelan et al. 1998). Let us therefore return to the planet
accretion scenario and analyze the implications of this assumption. We have
seen that depending on the evolutionary status of the star at the time of
engulfing (i.e. on the initial planet separation), different amounts of
mass can be lost and thus different positions in the HB can be
reached. Assuming for the moment that planets form preferentially around
solar-type stars (as it has been observed so far), the similarity in the
positions of the gaps would suggest that planets orbit at preferred
distances to the star. A theory suggesting that this is indeed the case
exists (Notalle 1996, Notalle et al. 1997 and references therein). If this
is true, planets would be swallowed only when the solar-type star reaches a
certain radius (or equivalently an evolutionary status), determined
approximatively by the orbital separation of the planet. In this
hypothesis, the accretion process would modify selectively the mass loss
rate and thus the location of the star on the HB.
However, the question
of why the star-planet interaction process acts only sporadically and does
not appear as a general phenomenon affecting the morphology of all the
clusters would remain puzzling. To attempt to answer this question, one
needs a better understanding of the processes involved in planetary
formation. For example, metallicity and other globular cluster properties
such as density may be important factors that can influence the formation
of planets and they are still poorly understood. To conclude this section,
the accretion of planets by giant stars can potentially influence the mass
loss rate and thus modify the position of the star on the HB. However, it
is not clear at present that the gaps observed in the blue tail of some
globular clusters are really the signature of such
accretion events.
4.6 The lithium rich G and K giants
The detection of lithium in the spectra of G and K giants (e.g. Wallerstein & Sneden 1982, Brown et al. 1989, Gratton & D’Antona 1989, Pilachowski et al. 1990, Castilho et al. 1995, de la Reza & da Silva 1995, Castilho et al. 1998) poses a problem concerning the origin of this element in these stars since, in standard evolution, lithium is entirely depleted during the first dredge up. Several mechanisms have been suggested to explain the Li enrichment and we refer to Gratton and D’Antona (1989) for a more complete discussion. Briefly, it has been proposed for example that Li could be preserved in the atmosphere of giant stars, but the low 12C/13C ratio observed in these stars (e.g. Pilachowski et al. 1990, de la Reza et al. 1995) indicates that deep mixing (and thus Li burning) has occurred. This represents therefore a failure of this scenario. Gratton and D’Antona (1989) considered the possibility that the giant’s envelope could be contaminated by a nova exploding companion. However, the non detection of a white dwarf in the vicinity of Li-rich giants (e.g. de la Reza & da Silva 1995) weakens this hypothesis. The possibility that Li could be produced by the Cameron-Fowler mechanism (1971) has also been investigated. This mechanism, which consists of the rapid dredge up of 7Be and Li production through the 7Be()7Li reaction, is known to operate in AGB stars of 4-6 for which the convective timescale is short compared to the 7Be destruction timescale (Sackmann & Boothroyd 1992). Unfortunately, this process is inefficient in low luminosity stars, unless one invokes some extra mixing processes (we will return to this point later). Finally, and we will develop this point below, several authors (e.g. Alexander 1967, Brown et al. 1989, Gratton and D’Antona 1989) proposed that the engulfing of a planet or a brown dwarf could be responsible for the high Li abundance.
Based on IRAS observations of G and K giants, de la Reza et al. (1996, 1997) concluded that almost all the Li rich G and K giants have an IR excess compatible with the presence of a circumstellar shell. To account for these observations, they constructed a model in which Li is produced inside the star by an extra mixing process, the “cool bottom burning” (Wasserburg et al. 1995). This process allows the fast transport of 7Be from the HBS into the convective envelope where 7Be then decays to produce 7Li. Furthermore, they assumed that the mechanism for Li enrichment is accompanied by a sudden increase in the mass loss rate and thereby the ejection of a shell. Following the evolution of a thin expanding circumstellar shell, they could reasonably account for the IR emission and Li abundance distribution of G and K giants in a color-color diagram. However, de la Reza et al. remained relatively vague concerning the mechanism that is responsible for mass loss; they assumed that it is a consequence of the Li enrichment process. Instead, we propose here that the accretion of a planet or a brown dwarf can naturally and consistently explain all of the observed features. We describe our scenario in the next paragraph and illustrate it in Fig. 10 which is an adaptation of Fig. 2 of de la Reza et al. (1996).
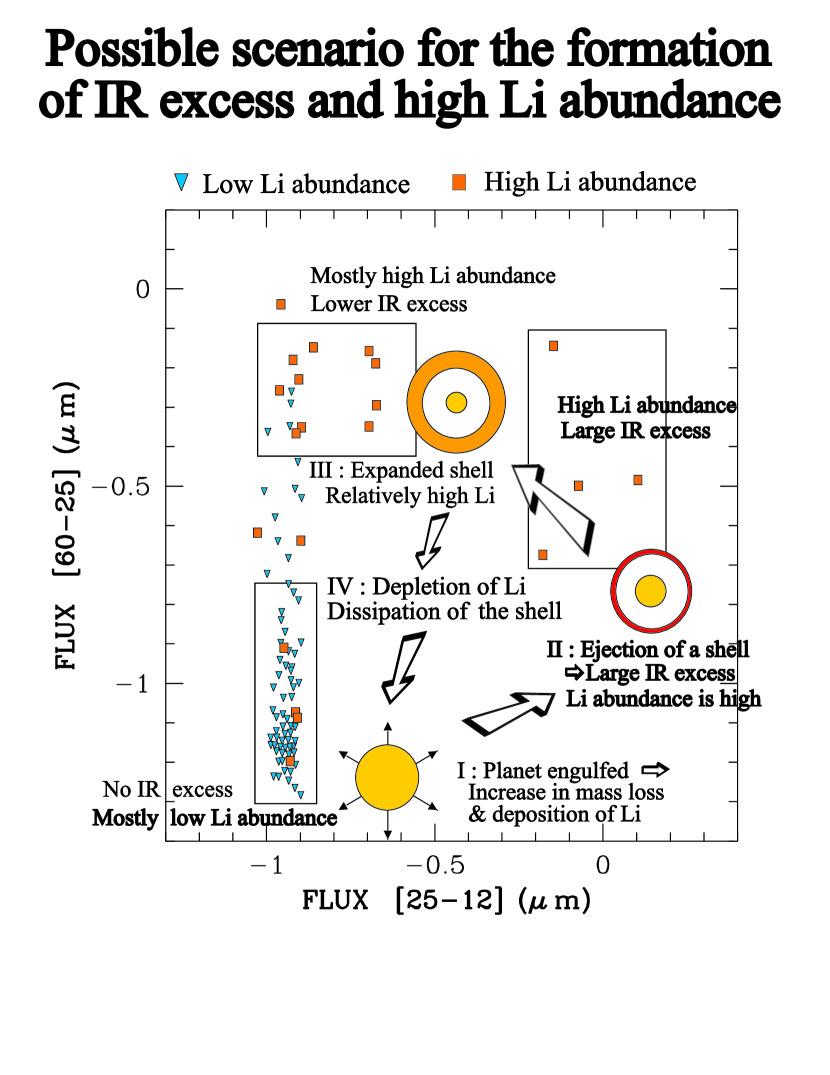
Figure 10 represents a color-color diagram based on the IRAS density fluxes at 12, 25 and 60 m. In this diagram, de la Reza et al. (1996, hereafter DDD) identified 3 regions, populated respectively by normal K giants with no IR excess (region ), Li rich giants with a large IR excess (region ), and relatively Li rich giants with a moderate IR excess (region ). When the accretion process starts, Li is progressively deposited in the stellar envelope and the mass loss rate increases. Rapidly, a shell is ejected and the giant moves quickly from region I to region II. In their shell model, DDD found that several hundred years are required to reach region . This timescale gives an estimate of the duration of the accretion process. Then, Li starts to be depleted in the envelope while the shell expands and cools down. The 25m flux decreases and the star now settles in region . DDD estimated that it takes approximatively yr to move from region to . Finally, in about yr, the circumstellar shell dissipates, Li is entirely depleted and the star returns to region as a normal K giant. Assuming a wind velocity of 2 and a mass loss rate of yr-1, DDD found that was ejected in the shell, in agreement with our models. In a second publication, de la Reza et al. (1997) completed their study by presenting new observations. They showed that Li-rich and Li-poor stars are mixed in the color-color diagram. They interpreted these observations as being due to differences in the Li destruction timescales. In our model, this is explained naturally if the amount of Li deposited into the star, or equivalently the mass of the planet, is different from one star to another.
The mechanism that leads to the Li enrichment must also account for its
rapid depletion, which takes place in yr. In our computations
without diffusion, Li is maintained at the surface of the star but
Charbonnel (1995) showed that this element can be rapidly depleted in red
giants due to non-standard mixing processes. In particular, the model
developed by Zahn (1992) showed that the efficiency of the mixing is mainly
determined by the loss of angular momentum via a stellar wind and, even in
the absence of a high mass loss rate, the process takes place where there
is a strong gradient in . He also pointed out that additional
mixing is expected in shell burning regions. Since all of these conditions
are satisfied in the context of the accretion process (increase in the mass
loss rate, deposition of angular momentum and a strong gradient of
in the dissipation region as described in 4.3) and as a part of
the fact that the star is on the RGB (the presence of the HBS), we have
every reason to believe that the mechanism proposed by Zahn (1992), and
that successfully explains some peculiar anomalies in red giant stars
(Charbonnel 1995), could be responsible for the fast Li depletion following
a short accretion phase. Moreover, observations of the
12C/13C ratio in some Li rich giants (da Silva & de la Reza
1995) indicate that some extra mixing is operating since the carbon isotope
ratio in these stars is lower than the standard value.
Our scenario does
encounter some difficulties in explaining the very high Li abundances
[log (Li)] found in some giants (e.g. Gratton &
D’Antona 1989, de la Reza & da Silva 1995, Fekel et al. 1996).
This would require the deposition of a huge amount of lithium that can
only be achieved either by the accretion of numerous planets such that
or if the Li
abundance in the brown dwarf is extremely high ( for ). The
accretion scenario does not provide a straightforward explanation but we
can imagine that when the planet reaches the central region, the
dissipation process may generate some instabilities (due to the shear) that
could, in turn, trigger the “cool bottom burning” invoked by de la Reza et
al. (1996, 1997). The accretion process would then lead to some Li
production (as in more massive AGB stars).
De Medeiros et al. (1996a) reported that the majority of Li K giants are normal rotators ( ) although some exceptions exist [e.g. HD 233517 (Fekel et al. 1996), HD 9746, HD 25893, HD 31993, HD 33798, HD 203251 (Fekel & Balachandran 1993), 1E 1751+7046 (Ambruster et al. 1997)]. However, as pointed out in 4.2, high angular velocities (% percent of the Keplerian velocity) can only be achieved if a sufficiently massive planet () is accreted. For a typical 1.0 RGB star, with a radius , the deposition of the orbital angular momentum of a 5 planet will “only” increase the star’s rotational velocity to [Eq. (3)]. Consequently, as long as the mass of the engulfed body is low (a planet rather than a brown dwarf), the observed angular momentum of Li rich giants is compatible with our scenario. We should also note that due to the increased mass loss, magnetic braking could also be operating (e.g. Leonard & Livio 1995). Finally, let us point out that all the Li rich giants are single stars, hence according to the prevailing common wisdom, they could possess planetary systems.
To summarize this section, we propose that the accretion of a planet or a brown dwarf is responsible for both the IR excess and the high Li abundance present in almost all single Li rich G and K giants.
5 Discussion and conclusion
In this paper, we investigated the effects of the accretion of a planet or a brown dwarf by a solar type star located on the red giant branch. Our computations show that the deposition of mass (potential energy) produces a substantial expansion of the envelope and, for higher accretion rates, nuclear burning at the base of the convective envelope can take place. The simulations show that the results are a sensitive function of the accretion rate and the structure of the star. Generally, the higher the accretion rate and/or the more evolved the star, the larger is the expansion. After the end of the accretion process, the star relaxes and resumes a standard evolution. However, in one simulation (case C0), the star avoided the He flash but instead developed thermal instabilities. For this model, after a phase of thermal pulses, He burning was finally ignited at the center of the star.
We discussed the possible observational signatures of the accretion of a planet/brown dwarf. In particular (1) we showed that the rotational velocity of the star can be substantially increased, provided that the accreted planet/brown dwarf is sufficiently massive. In this respect the accretion of a brown dwarf could account for the fast rotation of FK Comae stars and more generally, the deposition of angular momentum via this process can explain unusually fast rotation rates. (2) Investigating the X-ray properties of giant stars, we showed that a strong differential rotation may take place at the bottom of the convective envelope. The presence of shear in this region can turn-on the dynamo activity and this may ultimately generate X-ray emission. We showed that under some conditions the surface layers of the star could rotate slowly while a rapid rotation is maintained in the core. (3) We also showed that the accretion scenario can lead to the ejection of shells whose mass is in the range . The IR excesses observed in 8% of luminosity class III stars could in part be due to this process. (4) We argued that the increase in the mass loss rate can also have indirect effects on the morphology of the horizontal branch and in this respect, the accretion process is a potential second parameter candidate. (5) We showed that the deposition of planet material in the convective envelope can efficiently increase the 7Li surface abundance and more generally enhance the stellar metallicity of giant stars. (6) Finally, on a related topic, we proposed that the accretion of a planet/brown dwarf can explain consistently both the IR excess and the high Li abundance observed only in single red giant stars.
In terms of physical processes, we suggested that planet/brown dwarf accretion may provide the triggering for a variety of processes. For example, the disruption of the planet and the associated instabilities could increase the He abundance in the giant’s envelope and thus affect the morphology of the HB as proposed by Sweigart (1997, 4.5). They could also be responsible for the production of lithium through the mechanism proposed by Wasserburg et al. (1995, 4.6). Finally, the rapid contraction of the star at the end of the accretion process could generate some pulsations.
Observations indicate that several of potential different signatures of an accretion event, e.g. a fast rotation rate, a significant X-ray emission, a high Li abundance or a large IR excess, do not always occur simultaneously. As we have shown, this is not surprising. First, depending on the mass of the planet, the outcomes could be different. For example, a small planet that evaporates in the envelope before reaching its base will perturb the structure only slightly. In such a case, no shell will be ejected but the deposition of angular momentum and matter in the surface layers could still produce a relatively rapid rotation and a high lithium abundance, as observed in some chromospherically active giants (Fekel & Balachandran 1993). Secondly, the timescales associated with the various phenomena (IR excess, X-ray activity, rotational braking, particle transport) can be different, and thus, not all the signatures will be observed at the same time. For example, if the spin-down timescale is longer than the timescale associated with the dissipation of the ejected shell, one can account for the absence of IR excess in some fast rotators. Thirdly, the consequences of the accretion process depend on the evolutionary status of the star. Giant stars located at the bottom of the RGB have much deeper convective envelopes than near the tip of the giant branch. Thus, if we consider for example the deposition of Li in the envelope, it is more difficult to obtain high Li abundances in younger red giants (it is also be more difficult to eject a shell). Finally, our simulations show that the results are sensitive to the physics of the dissipation process, and more specifically, to the accretion rate and the location of the accretion process. At present, both these physical parameters are rather uncertain, and a better understanding of the dissipation process is definitively required.
As a last point, we can attempt to use the expected observational signatures to infer some estimate for the frequency of planets around solar-type stars. In a search for lithium in 644 G and K giants, Brown et al. (1989) found that 2% in the stars of their sample have log (Li) and 4% have log (Li). If we adopt for our definition of Li rich giants the value log (Li), we find that % of the stars surveyed by Brown et al. belong to this group. In a more recent survey, Castilho et al. (1998) report the detection of 5 Li rich and 6 moderately Li rich giants among 164 stars, indicating a proportion of Li rich giants of %. The study of Plets et al. (1997) indicates that 8% of luminosity class III giants have unexpected IR excess. Finally, based on rotational velocity measurements of G and K giants, De medeiros et al. (1996a) found that of late G and K giants located beyond the rotational dividing line are fast rotators with . Thus, if the IR excess and/or high Li abundance and/or unusually high rotational velocity among G and K giants result from the accretion of a planet/brown dwarf, the above numbers suggest that at least 4-8% of the single, solar-type stars must have a low mass companion, either a brown dwarf or a planet. If we were to take seriously the frequency of planets inferred by Soker (1997) to account for the shaping of planetary nebulae ( of all progenitors of masses ), our deduced frequency would indicate that either a large fraction of the planets do not interact during the red giant phase or, more probably, that the observational signatures of the accretion event are very short-lived compared to stellar evolutionary timescales. Indeed, because of the large radii reached by solar type stars during the RGB, some planets will most likely be engulfed during the early giant phase rather than on the AGB (although Jupiter will not be engulfed by our own sun). On the other hand, if we compare the timescales associated with both the Li and IR excesses (yr) to the red giant lifetime (between and yr for giants with masses between 1.0 and 2.5), we conclude that the probability of detecting an accretion event is such that we are likely to miss most candidates.
Acknowledgments
LS acknowledges support from the Director’s Discretionary Research Fund at STScI and thanks the STScI for its hospitality. This work has been supported in part by NASA grants NAGW-2678, G005.52200 and G005.44000. The computations presented in this paper were performed at the “Centre Intensif de Calcul de l’Observatoire de Grenoble”.
References
- [1] Alexander J.B., 1967, Observatory, 87, 238
- [2] Ambruster C.W., Fekel F.C., Guinan E.F., Hrivnak B.J., 1997,ApJ, 479, 960
- [3] Anders E., Grevesse N., 1989, Geochim. Cosmochim. Acta, 53, 197
- [4] Aumann H.H., Gillett F.C., Beichmann C.A. et al., 1984, ApJ, 278, L23
- [5] Ayres T.R., Simon T., Stern R.A., Drake S.A., Wood B., Brown A., 1998, ApJ, 496, 428
- [6] Backman D.E., Paresce F., 1993, in Protostars and Planets III, eds. E.H. Levy, J.I. Lunine, The University of Arizona Press, p. 1253
- [7] Barnbaum C., Morris M., Kahane C., 1995, ApJ, 450, 862
- [8] Basri G., Marcy G.W., Graham J.R., 1996, ApJ, 458, 600
- [9] Bjorkman J.E., Cassinelli J.P., 1993, ApJ, 409, 429
- [10] Bopp B.W., Stencel R.E., 1981, ApJ, L31
- [11] Brown J.A., Sneden C., Lambert D.L., Dutchover E.Jr., 1989, ApJS, 71, 293
- [12] Bujarrabal V., Cernicharo J., 1994, A&A, 288, 551
- [13] Butler R.P., Marcy G.W., 1996, ApJ, 464, L153
- [14] Butler R.P., Marcy G.W., Vogt S.S., Apps K., 1998, PASP, 110, 1389
- [15] Cameron A.G.W., Fowler W.A., 1971, ApJ, 164, 11
- [16] Castellani M., Castellani V., 1993, ApJ, 407, 649
- [17] Castilho B.V., Barbuy B., Gregorio-Hetem J., 1995, A&A, 297, 503
- [18] Castilho B.V., Gregorio-Hetem J., Spite F., Spite M., Barbuy B., 1998, A&AS, 127, 139
- [19] Catelan M., Borissova J., Sweigart A.V., Spassova N., 1998, ApJ, 494, 265
- [20] Charbonnel C., 1995, ApJ, 453, L41
- [21] Cochran W.D., Hatzes A., Marcy G.W., Butler R.P., 1997, ApJ, 483, 457
- [22] Cohen J.G., McCarthy J.K., 1997, AJ, 113, 1353
- [23] D’Cruz N.L., Dorman B., Rood R.T., O’Connell R.W., 1996, ApJ, 466, 359
- [24] Delfosse X., Forveille T., Mayor M., Perrier C., Naef D., Queloz D., 1998, A&A, 331, 581
- [25] de la Reza R., da Silva L., 1995, ApJ, 439, 917
- [26] de la Reza R., da Silva L., Barbuy B., 1995, ApJ, 448, L41
- [27] de la Reza R., Drake N.A., da Silva L., 1996, ApJ, 456, L115, DDD
- [28] de la Reza R., Drake N.A., da Silva L., Torres C.A.O., Martin E.L., 1997, ApJ, 482, L77
- [29] de Medeiros J.R., Melo C.H.F., Mayor M., 1996a, A&A, 309, 465
- [30] de Medeiros J.R., da Rocha C., Mayor M., 1996b, A&A, 314, 499
- [31] Dorman B., Lee Y.-W., VandenBerg D.A., 1991, ApJ, 366, 115
- [32] Dorman B., Rood R.T., O’Connell R.W., 1993, ApJ, 419, 596
- [33] Fekel F.C., 1988, in Adecade of UV Astronomy with IUE Satellite, ed. E.J. Rolfe (ESA Publications, Noordwijk, The Netherlands), Vol. 1, p. 331
- [34] Fekel F.C., Balachandran S., 1993, ApJ, 403, 708
- [35] Fekel F.C., Marschall L.A., 1991, AJ, 102, 1439
- [36] Fekel F.C., Webb R.A., White R.J., Zuckerman B., 1996, ApJ, 462, L95
- [37] Ferraro F.R., Paltrinieri B., Fusi Peci F., Rood R.T., Dorman B., 1998, ApJ, 500, 311
- [38] Forestini M., Charbonnel C., 1997, A&AS, 123, 241
- [39] Gonzalez G., 1997, MNRAS, 285, 403
- [40] Gonzalez G., 1998, A&A, 334, 221
- [41] Gratton R.G., D’Antona F., 1989, A&A, 215, 66
- [42] Gray D.F., 1981, ApJ, 251, 155
- [43] Gray D.F., 1982, ApJ, 262, 682
- [44] Gray D.F., 1986, Highlights Astr, 7, 411
- [45] Gray D.F., 1989, ApJ, 347, 1021
- [46] Gray D.F., 1991, in Angular Momentum Evolution of Young Stars, eds S. Catalano, J.R. Stauffer, Kluwer, Dordrecht, p. 183
- [47] Gray D.F., Nagar P., 1985, ApJ, 298, 756
- [48] Haisch B., Schmitt J.H.M.M., Fabian A.C., 1992, Nature, 360, 239
- [49] Haisch B., Schmitt J.H.M.M., Rosso A.C., 1991, ApJ, 383, L15
- [50] Harpaz A., Soker N., 1994, MNRAS, 270, 734
- [51] Harris H.C., McClure R.D., 1985, PASP, 97, 261
- [52] Hünsch M., Schröder K.-P., 1996, 309, L51
- [53] Hünsch M., Schmitt J.H.M.M., Schröder K.-P., Reimers D., 1996, A&A, 310, 801
- [54] Hünsch M., Schmitt J.H.M.M., Schröder K.-P., Zickgraf F.-J., 1998, A&A, 330, 225
- [55] Iben I.Jr., Livio M., 1993, PASP, 105, 1373
- [56] Izumiura H., Hashimoto O., kawara K., Yamamura I., Waters L.B.F.M., 1996, A&A, 315, L221
- [57] Izumiura H., Waters L.B.F.M., de Jong T., Loup C., Bontekoe Tj.R., Kester D.J.M., 1997, A&A, 323, 449
- [58] Kraft R.P., 1970, in Spectroscopic Astrophysics, ed. G.H. Herbig (Berkeley, University of California Press), p. 385
- [59] Laughlin G., Adams F.C., 1997, apJ, 491, L51
- [60] Lee Y.-W., Demarque P., Zinn R., 1994, ApJ, 423, 248
- [61] Leonard P.T.J., Livio M., 1995, ApJ, 447, L21
- [62] Lin D.N., Bodenheimer P., Richardson D.C., 1996, Nature, 380, 606
- [63] Livio M., 1997, Space Sci. Rev., 82, 389
- [64] Livio M., Soker N., 1984, MNRAS, 208, 763
- [65] Livio M., Soker N., 1988, ApJ, 329, 764
- [66] Maggio A., Favata F., Peres G., Sciortino S., 1998, A&A, 330, 139
- [67] Marcy G.W., Butler R.P., Vogt S.S., Fischer D., Lissauer J.J., 1998, ApJ, 505, L147
- [68] Mayor M., Queloz D., 1995, Nature, 378, 355
- [69] Notalle L., 1996, A&A, 315, L9
- [70] Notalle L., Schumacher G., Gay J., 1997, A&A, 322, 1018
- [71] Olofsson H., Bergman P., Eriksson K., Gustafsson B., 1996, A&A, 311, 587
- [72] Olofsson H., Carlström U., Eriksson K., Gustafsson B., Willson L.A., 1990, A&A, 230, L13
- [73] Olofsson H., Carlström U., Eriksson K., Gustafsson B., 1992, A&A, 253, L17
- [74] Olofsson H., Eriksson K., Gustafsson B., Carlström U., 1993, ApJS, 87, 267
- [75] Owocki S.P., Cranmer S.R., Blondin J.M., 1994, ApJ, 424, 887
- [76] Peterson R.C., Rood R.T., Crocker D.A., 1995, ApJ, 453, 214
- [77] Peterson R.C., Tarbell T.D., Carney B.W., 1983, ApJ, 265, 972
- [78] Pilachowski C.A., Sneden C., Hudek D., 1990, AJ, 99, 1225
- [79] Plets H., Waelkens C., Oudmaijer R.D., Waters L.B.F.M., 1997, A&A, 323, 513
- [80] Rasio F.A., Tout C.A., Lubow S.H., Livio M., 1996, ApJ, 470, 1187
- [81] Rebolo R., Martin E.L., Basri G., Marcy G., Zapatero-Osorio M.R., 1996, ApJ, 469, L53
- [82] Rebolo R., Zapatero-Osorio M.R., Martin E.L., 1995, Nature, 377, 129
- [83] Regos E., Tout C.A., 1995, MNRAS, 273, 146
- [84] Reimers D., 1975, Men. Soc. Roy. Sci. Liège, 6th ser. 8, 369
- [85] Reimers D., Hünsch M., Schmitt J.H.M.M., Toussaint F., 1996, A&A, 310, 813
- [86] Rosner R., An C.-H., Musielak Z.E., Moore R.L., Suess S.T., 1991, ApJ, 327, L91
- [87] Rosner R., Musielak Z.E., Cattaneo F., Moore R.L., Suess S.T., 1995, ApJ, 442, L25
- [88] Rucinski S.M., 1985, MNRAS, 215, 591
- [89] Rucinski S.M., 1990, PASP, 102, 306
- [90] Sackmann I.J., Boothroyd A.I., 1992, ApJ, 392, L71
- [91] Sandage A.R., Whitney R., 1967, 150, 469
- [92] Sandquist E., Taam R.E., Lin D.N.C., Burkert A., 1998, ApJ, 506, L65
- [93] Shima E., Matsuda T., Takeda H., Sawada K., 1985, MNRAS, 217, 367
- [94] Siess L., Livio M., 1999, MNRAS, in press
- [95] Siess L., Forestini M., Bertout C., 1997, A&A, 326, 1001
- [96] Simon T., Drake S.A., 1989, ApJ, 364, 303
- [97] Soker N., 1997, ApJS, 112, 487
- [98] Soker N., 1998a, ApJ, 498, 833
- [99] Soker N., 1998b, in the Proceedings of the 10th Cambridge Workshop on Cool Stars, Stellar Systems and the Sun, in press
- [100] Soker N., Harpaz A., Livio M., 1984, MNRAS, 210, 189
- [101] Sosin C., Dorman B., Djorgovski S.G., et al., 1997, 480, L35
- [102] Stepien K., 1993, ApJ, 416, 368
- [103] Strassmeier K.G., Hall D.S., Barksdale W.S., Jusick A.T., Gregory W.H., 1990, ApJ, 350, 367
- [104] Strassmeier K.G., Handler G., Paunzen E., Rauth M., 1994, A&A, 281, 855
- [105] Sweigart A.V., 1997, ApJ, 474, L23
- [106] Sweigart A.V., Catelan M., 1998, ApJ, 501, L63
- [107] Taam R.E., Bodenheimer P., 1989, ApJ, 337, 849
- [108] Telesco C.M., Knacke R.F., 1991, ApJ, 372, L29
- [109] Vitenbroek H., Dupree A.K., Gilliland R.L., 1998, AJ, 116, 2501
- [110] Wallerstein G., Sneden C., 1982, ApJ, 225, 577
- [111] Walker, 1992, PASP, 104, 1063
- [112] Wasserburg G.J., Boothroyd A.I., Sackmann I.J., 1995, ApJ, 447, L37
- [113] Webbink R.F., 1977, ApJ, 211, 486
- [114] Welty A.D., Ramsey L.W., 1994, ApJ, 435, 848
- [115] Zahn J.-P., 1992, A&A, 265, 115
- [116] Zuckerman B., Kim S.S., Liu T., 1995, ApJ, 446, L79