Opacities along the Line of Sight to and in the Atmosphere of the White Dwarf in the Close Detached DAO+dM Binary RE J0720-318 (V∗ IN CMa).
Abstract
We present the results from a multi-wavelength study of the mixed H+He composition DAO white dwarf RE J0720-318. A detailed analysis of UV and EUV spectroscopic data with state-of-the-art non-LTE photospheric models demonstrates that the observed opacity to EUV radiation probably results from a more complex structure than a simple H+He, chemically layered atmosphere. Instead, EUV photometry and phase resolved EUV spectroscopy indicate a likely spatial non-uniformity in the surface distribution of helium, which is consistent with a model in which material is accreted from the wind of the dM secondary. The rotational modulation of the spatially inhomogeneous EUV opacity allows us to estimate the rotation period of the white dwarf ( days). We have also reviewed two plausible origins proposed by Burleigh et al. (burleigh97 (1997)) and Dupuis et al. (1997a ) to account for the unusual N(HI)/N(HeI)1 along this line of sight. We conclude that it is probably due to the presence of a cloud of ionized gas along this line of sight, rather than a circumbinary disk. The cloud, residing between 123-170pc distant in the direction of the CMa ISM tunnel, may be pc in length.
Key Words.:
stars: abundances – stars: atmospheres – stars: binaries: close – stars: individual: RE J0720-3181 Introduction
Soft X-ray and EUV observations of DA white dwarfs have revealed photospheric opacity in excess of that provided by a pure hydrogen plasma for the majority with (e.g. Marsh et al. marsh97 (1997); Wolff et al. wolff96 (1996); Finley finley96 (1996); Jordan et al. jordan94 (1994); Barstow et al. barstow93 (1993)). In addition, high resolution IUE echelle spectra of those stars exhibiting the greatest levels of opacity show absorption lines of heavy elements (e.g. C, N, O, Si, Fe and Ni; Bruhweiler & Kondo bruhweiler81 (1981); Dupree & Raymond dupree82 (1982); Bruhweiler & Feibelman bruhweiler91 (1991); Holberg et al. holberg94m (1994); Holberg, Barstow and Sion holberg98a (1998)). In many cases these have been shown to be consistent with their location in the stellar photosphere (e.g. G191-B2B, Reid & Wegner reid88 (1988)). Early theoretical work had suggested that the atmospheres of DAs were more or less pure hydrogen as heavier elements should rapidly sink out in the strong gravitational field (Schatzmann schatzmann58 (1958)). However, further detailed calculations have shown that finite abundances of metals can be supported against gravitational settling by the net transfer of upward momentum from the intense radiation field to the heavy element ions via their line transitions (e.g. Vauclair et al. vauclair79 (1979) and most recently Chayer et al. chayer95 (1995)). In contrast, similar calculations have demonstrated that helium cannot be radiatively levitated in observable quantities in all but the hottest objects, due to a relatively small number of bound-bound transitions, and should sink out of the photosphere on a time-scale of days (Vennes et al. vennes88 (1988)).
White dwarfs are classified according to their optical spectra and generally fall into one of two categories. The hydrogen rich DAs and the helium rich DOs display solely strong H and He lines respectively. The DAOs are a hybrid class and show both strong H lines and a weak 4686Å HeII feature. Lying in the temperature range , Fontaine & Wesemael (fontaine87 (1987)) proposed that they were transitional objects forming an evolutionary link between the DOs and DAs. As a DO cooled, residual hydrogen in its atmosphere was expected to float to the surface forming a layer of sufficient thickness that spectroscopic traces of helium were eliminated, at least in the optical waveband. The white dwarf would transform first into a DAO, then a DA. In either case it was expected to have a chemically stratified atmosphere where a thin layer of hydrogen over-lies a predominantly helium envelope in diffusive equilibrium. At , convective mixing would then dredge helium back into the optical photosphere, effectively returning it to the helium rich cooling sequence. Many observations could be accounted for with this evolutionary hypothesis, e.g. the apparent absence of DAs with and the DO/DB gap between , a region of the cooling sequence where no helium rich objects are observed. However, doubt was cast on this interpretation by the detailed optical study of a large sample of DAOs by Bergeron et al. (bergeron94 (1994)). In contrast to the theoretically predicted stratified atmosphere, they found for many objects in their sample that the observed 4686Å HeII line profile was reproduced significantly better by a model in which helium was homogeneously mixed into a predominantly hydrogen atmosphere. In addition, the low surface gravities of many DAOs suggested that they were products of extreme horizontal branch evolution (EHB), inconsistent with the generally accepted post-AGB evolutionary status of the DOs and DAs (e.g. Weidemann weidemann90 (1990)).
RE J0720-318 is one of only three DAOs detected in the EUV sky surveys of the ROSAT Wide Field Camera (WFC, Pounds et al. pounds93 (1993)) and the Extreme Ultraviolet Explorer (EUVE, Bowyer et al. bowyer94 (1994)). Optical follow up observations revealed a post common envelope (CE) DAO+dM binary with a period of 1.26 days (Vennes & Thorstensen 1994a ; Barstow et al. barstow95 (1995); Vennes & Thorstensen vennes96a (1996)). Intriguingly all three of the DAOs detected in the EUV reside in close, pre-cataclysmic variable (pre-CV) systems and have masses typical of isolated DAs (e.g. Bergeron et al. bergeron92 (1992)) and consistent with post-AGB evolution. Radiative levitation has been shown to be insufficient to account for the observed abundance of helium in these objects (Vennes et al. vennes88 (1988)) and it is thought binarity is most likely responsible (Tweedy et al. tweedy93 (1993)). It is feasible that tidal effects, accretion from the secondary’s wind and the earlier period of common envelope evolution may all have played or be playing a role in determining the observed abundance patterns (Bergeron et al. bergeron94 (1994)). Current observational evidence seems to favour a wind accretion mechanism. For example, periodic variations in the soft X-ray/EUV flux from the DA2+KV pre-CV system V471 Tauri (Jensen et al. jensen86 (1986)) can be consistent with the rotational modulation of regions of increased helium and metal opacity on the surface of the white dwarf (Dupuis et al 1997b ). Recently, time resolved studies of a Zeeman split 1286Å SiIII line believed to be formed in the photosphere of the V471 Tauri white dwarf have revealed a variation in its equivalent width on the soft X-ray/EUV and optical period (Sion et al. sion98 (1998)). The time of greatest line strength corresponds to soft X-ray/EUV minimum and optical maximum, more or less confirming the magnetic wind accretion interpretation first proposed by Jensen et al. (jensen86 (1986)). The influence of tidal forces, the CE phase and weak mass-loss is less clear and observations are essential for constraining theoretical models of close binary evolution. In an initial analysis of the EUVE spectrum of RE J0720-318, Burleigh et al. (burleigh97 (1997)) were able to reproduce the data with a simple LTE H+He stratified model. The unexpectedly low H-layer mass of M☉ led them to speculate that the white dwarf may have been largely stripped of hydrogen by mass transfer during the prior common envelope phase. Subsequently a weak wind was proposed to be carrying helium up into the photosphere or alternatively accretion from the secondary’s wind depositing helium into the optical line forming region to produce the 4686Å HeII feature.
We report here the results of a new multi-wavelength study of RE J0720-318. Using state-of-the-art non-LTE models we are able to demonstrate that the opacity observed in the EUV waveband probably arises from a more complex structure than a simple, LTE H+He stratified atmosphere. Using EUV photometry and phase resolved spectroscopy we also show that it is likely the helium abundance is not spatially uniform across the photosphere, in support of a wind accretion model. As a result we have been able to measure the rotation rate of the white dwarf ( days).
2 Observations and data reduction.
2.1 The EUVE data
An EUVE observation of RE J0720-318 was carried out during the period 1995 December 16–20 and is now available from the public archive at Goddard Space Flight Centre. The target was observed in dither mode, which consists of a series of discrete pointings slightly offset from each other and is carried out to minimize the effects on the data of detector spatial response variations. RE J0720-318 was detected in all three spectrometers and by the Deep Survey (DS) imager with effective exposure times of 122 459s (SW 70–190Å), 121 067s (MW 140–380Å), 112 861s (LW 280–760Å) and 112 564s (DS 70–180Å). Standard IRAF EUV and XRAY/PROS software were used to extract light-curves of RE J0720-318 from each of the four detectors, following procedures described in detail on the CEA website at Berkeley111http://www.cea.berkeley.edu. The count rates for all four were corrected for detector dead-time and an effect known as “Primbsching” which occurs when the satellite telemetry buffer saturates, resulting in some photon events being lost. Additionally, the DS count rates were modified to account for times when the source lay in the deadspot, a region of the detector with reduced gain (e.g. Sirk et al. sirk97 (1997)). The spectral extractions were also performed using IRAF/EUV software, following our standard procedures for reducing spectroscopic data which includes quadratically adding a 5% systematic error to the data to account for residual detector fixed pattern efficiency variations (FPN). A more detailed description of these methods may be found in our earlier work (e.g. Barstow et al. barstow97 (1997)).
2.2 The HST GHRS and optical observations.
A total of six HST GHRS observations of RE J0720-318 were obtained from the public archive at STSCI. These were taken with the G160M grating through the Large Science Aperture (LSA) and cover a waveband of 35Å with a resolution better than 0.1Å. Each dataset consists of several shorter exposures which were co-added to produce the resulting spectra. A Pt/Ne hollow cathode lamp exposure (WAVE) was acquired immediately prior to each of the science observations, allowing us to use IRAF/STSDAS routines to re-calibrate the wavelength solution and subsequently reduce the uncertainty in the wavelength scale from to . The observations were timed to coincide with binary quadrature as predicted by the optically derived ephemeris of Vennes & Thorstensen (vennes96a (1996)). Details of these, including wavebands, exposure times and the predicted binary phase are shown in Table 1.
| Obs. ID. | Date | Time(UT) | (Å) | Exp.(s) | |
|---|---|---|---|---|---|
| z3c80405 | 17/09/96 | 00:06 | 1623–1658 | 3x571 | 0.74 |
| z3c80408 | 17/09/96 | 01:35 | 1623–1658 | 4x598 | 0.79 |
| z3c80305 | 25/10/96 | 11:08 | 1532–1568 | 3x571 | 0.21 |
| z3c80308 | 25/10/96 | 12:38 | 1532–1568 | 4x598 | 0.26 |
| z3c8030b | 25/10/96 | 14:15 | 1623–1658 | 4x598 | 0.31 |
| z3c8030e | 25/10/96 | 15:51 | 1623–1658 | 4x598 | 0.36 |
The analysis of UV and EUV data is complemented by a re-analysis of a co-added optical spectrum of RE J0720-318 obtained on the 1.9m Radcliffe telescope at SAAO in February 1995. Full details of this dataset may be found in Barstow et al. (barstow95 (1995)).
3 Analysis and results.
3.1 Models and spectral analysis techniques.
Our non-LTE photospheric models are generated with the latest version of the atmosphere code TLUSTY (version 195, Hubeny hubeny88 (1988); Hubeny and Lanz hubeny95 (1995)) and the spectral synthesis program SYNSPEC (Hubeny et al. hubeny94 (1994)) and include the full effects of line blanketing. Detailed hydrogen and helium line profiles are calculated from the tables of Schning & Butler (private comm.) and Schning & Butler (schoning89 (1989)) respectively. To account for the opacity to EUV radiation of HI, HeI and HeII along the line of sight, during the analysis of EUV spectroscopic data, photospheric models are used in conjunction with the ISM model of Rumph et al. (rumph94 (1994)). This has been modified to include the effects of the converging Lyman line series of HeI and HeII at 504Å and 228Å respectively.
Our standard spectral analysis techniques have been described in detail in previous publications (e.g. Barstow et al. barstow97 (1997)) and will only be briefly re-iterated here. We carry out comparisons between models and data using the spectral fitting program XSPEC (Shafer et al. shafer91 (1991)). XSPEC works by folding a model through the instrument response before comparing the result to the data by means of a -statistic. The best fit model representation of the data is found by incrementing free grid parameters in small steps, linearly interpolating between points in the grid, until the value of is minimized. Errors are calculated by stepping the parameter in question away from its optimum value and re-determining the minimum . This is repeated until the difference between the two values, , corresponds to 1 for a given number of free model parameters as prescribed by Lampton et al. (lampton76 (1976)). All errors quoted in this work are 1 unless stated otherwise.
3.2 The optical data analysis
Previous studies of the optical spectrum of RE J0720-318 have employed LTE H+He models (e.g. Barstow et al. barstow95 (1995)). A re-analysis of the optical spectrum has been carried out with a grid of non-LTE, homogeneous, H+He models, primarily for consistency, since non-LTE models are used here in the analysis of both the UV and EUV data. Recently it has been demonstrated that estimates of the effective temperatures of hot DAs determined by fitting non-LTE model Balmer lines to the observed profiles are systematically lower by at compared to the earlier LTE analyses (Barstow et al. barstow98 (1998)). Barstow et al. (barstow98 (1998)) also report that in contrast to the results of Bergeron et al. (bergeron94 (1994)) who found that the inclusion of small amounts of helium into LTE models lowers the determined effective temperature by several at (Bergeron et al. bergeron94 (1994)), no similar effect occurs in non-LTE. Fitting our grid of non-LTE homogeneous H+He models we determine , and a helium abundance of . We adopt and for the subsequent analysis of UV and EUV data.
3.3 The GHRS spectra

3.3.1 Line velocity measurements
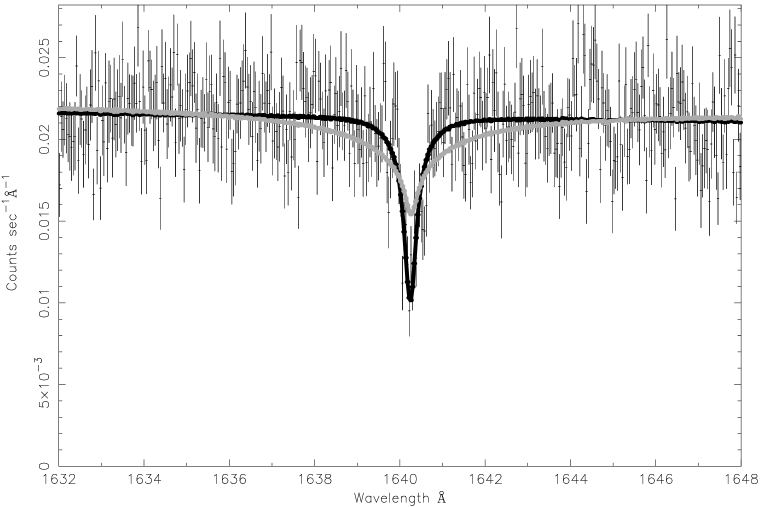
The two spectra covering the 1532-1568Å range both display a prominent CIV resonance doublet. A glance at Fig. 1 indicates that the doublet profiles may be complex with weaker, red-shifted absorption lines present besides the main components. A test of the significance of these was carried out by applying an F-test to the fit statistics obtained using XSPEC to match both single and double gaussian profiles to the observed lines. The result of this suggests they are real features (% confidence). A 1640Å HeII absorption line is displayed in the four spectra covering the 1623–1658Å waveband. This feature was assumed to arise in the stellar atmosphere as photospheric helium has previously been detected in both the optical (Barstow et al. barstow95 (1995); Vennes & Thorstensen 1994a ) and the EUV spectrum (Burleigh et al. burleigh97 (1997); Dupuis et al.1997a ) of RE J0720-318. Although the four spectra covering this waveband are rather noisy, close examination of z3c8030b suggests that there may also be a weak redward component to this profile, which can be consistent in velocity space with the weaker CIV features. However, from fitting gaussains to similar looking features in this spectrum which are attributable to noise, it was found that these could also be identified as absorption lines at a similar level of confidence (%). Furthermore, the spectrum taken immediately after and covering the same waveband (z3c8030e), does not appear to display this feature. Subsequently, the velocities of the lines in the six spectra were measured using the STARLINK package DIPSO to fit gaussians or where appropriate, double gaussians, to the observed profiles. The errors were calculated by quadratically adding the uncertainties in both the fitting procedure and in the wavelength calibration. The heliocentrically correct velocities along with their associated errors are given in Table 2.
The HeII velocities were used in conjunction with the binary ephemeris of Vennes & Thorstensen (vennes96b (1996)) to constrain the origin of features observed in the 1532-1568Å waveband. Unfortunately, since Vennes & Thorstensen (vennes96a (1996)) do not give their measured 4686Å HeII line velocities in tabular form, it has not been possible to fully update this ephemeris. Instead, the HeII measurements were used to adjust KWD and , the white dwarf semi-amplitude and the velocity offset (gravitational and system) respectively. Adopting the Vennes & Thorstensen binary period of P = 1.26245 days and epoch(HJD) of T, both of which should be sufficiently accurate for the purposes here, sinusoids of the form V(T) = + KWD [ + (T - T0) / P] were fit to the four data points. The best match was found between the observed and predicted velocities for a value of K and . Comparing these figures to the Vennes & Thorstensen (vennes96a (1996)) values of K and , within their respective errors, consistency is found between estimates of . However, the difference in KWD is rather large. It is possible that the weak 4686Å HeII profile from which their values for KWD and were determined, may be contaminated with emission from the irradiated face of the secondary star. It is interesting to note from Fig. 2 of Vennes & Thorstensen (vennes96a (1996)) that the two velocities which agree best with the lower value for KWD are obtained at phases 0.783 and 0.828 where re-processed emission is approaching a minimum and the HeII profile appears deepest. Furthermore, Vennes & Thorstensen (vennes96a (1996)) point out that the errors on their velocity values are formal and are likely to underestimate the true uncertainties. Comparing the measured CIV line velocities to the predictions of the modified ephemeris, it was found that the main components are consistent with the predicted photospheric velocity of the white dwarf. If this interpretation is correct then this represents the first direct detection of carbon in the atmosphere of this white dwarf. The weaker components, are red-shifted by with respect to the apparent photospheric velocity. We note that the system velocity is (Vennes & Thorstensen vennes96a (1996)). The possible origin of these features will be discussed later.
| Obs. ID. | Ion | Lab. | Obs. | Vel. |
| (Å) | (Å) | (km s-1) | ||
| 405 | HeII | 1640.474 | ||
| 408 | HeII | 1640.474 | ||
| 305 | CIV | 1548.195 | ||
| 305 | CIV | 1550.770 | ||
| 308 | CIV | 1548.195 | ||
| 308 | CIV | 1550.770 | ||
| 30b | HeII | 1640.474 | ||
| 30e | HeII | 1640.474 | ||
| 305 | CIV | 1548.195 | ||
| 305 | CIV | 1550.770 | ||
| 308 | CIV | 1548.195 | ||
| 308 | CIV | 1550.770 |
3.4 The abundances of He and C from UV data
Two small grids of models were generated to measure the photospheric abundances of helium and carbon. The first grid consists of models including a homogeneous mix of H, He and C. The second grid consists of models with a stratified atmospheric structure where the distribution of helium in the predominantly hydrogen envelope was calculated by integrating the equations of ordinary diffusion for a given hydrogen layer mass (Vennes et al. vennes88 (1988)). The homogeneous model grid was specified by the parameters log (He/H) and log (C/H) and the stratified grid by the parameters log(H-layer mass) and log (C/H). The analysis of the UV spectra was carried out in a three stage procedure which was repeated for each grid. First the carbon abundance was measured allowing the helium abundance/hydrogen layer mass to settle at an arbitrary value between the limits of the calculated grid. Second, with the carbon abundance frozen at the average value from the first stage, the grid was fit to the four spectra displaying the helium absorption profile. In the final step, with the helium abundance/hydrogen layer mass held at the average value obtained in the previous step, the carbon abundance was re-measured. The results from the two latter stages are given in Table 3. The best fitting homogeneous and stratified models to spectrum z3c8030b are shown in Fig. 2. It is clear that while the stratified structure predicts a HeII line core which is too shallow, the homogeneous model with a helium abundance of produces a good match. Similarly, in the remaining three spectra covering this wavelength range, the shape of the HeII 1640Å line is only accurately reproduced by a homogeneous model.
| Obs. ID. | Element | Abundance | H layer mass |
|---|---|---|---|
| log (N/H) | log (M☉) | ||
| z3c80405 | He | ||
| z3c80408 | He | ||
| z3c80305 | C | not applicable | |
| z3c80308 | C | not applicable | |
| z3c8030b | He | ||
| z3c8030e | He |
3.5 The EUVE data
3.5.1 The EUV spectrum
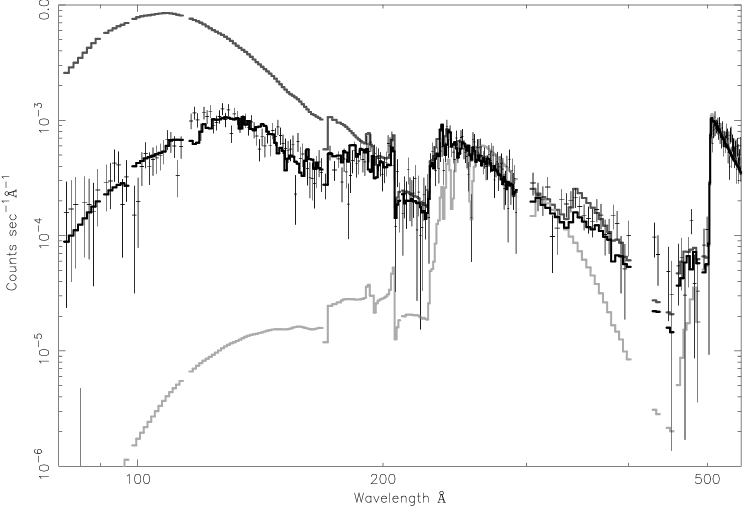
The grids of models calculated for the analysis of the UV spectra were extended to cover the EUV wavelength range. During the fitting process, the synthetic spectra were normalized to a V magnitude point and the ISM model parameters HI, HeI and HeII allowed to vary freely. The hydrogen layer/helium abundance and carbon abundance grid parameters were constrained by the most extreme 1 limits determined in the analysis of the UV data. An adequate fit could not be obtained with either model. As shown in Fig. 3 the best fit stratified structure predicted a flux between 80–240Å several orders of magnitude lower than observed, effectively ruling out this layered atmospheric configuration. On the other hand, although the homogeneous model could provide a good match to the observed spectrum at wavelengths above 180Å, shortward of this the predicted flux is too high. However, after the inclusion of other heavy elements including N,O,Si,Ne and Fe in the abundances shown in Table 4, an excellent match between the synthetic spectrum and data was achieved. Given that it was necessary to include these elements, this analysis strongly suggests that other metals, besides carbon, are present in the atmosphere of RE J0720-318. We note that Dupuis et al. (1997a ) have previously fit the spectrum with a homogeneous, LTE model including trace heavy elements.
3.5.2 The EUV Light Curve of RE J0720-318.
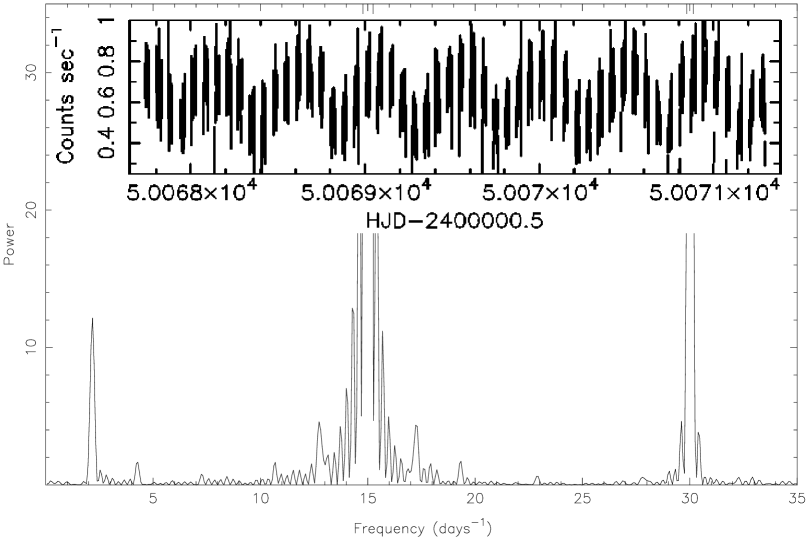
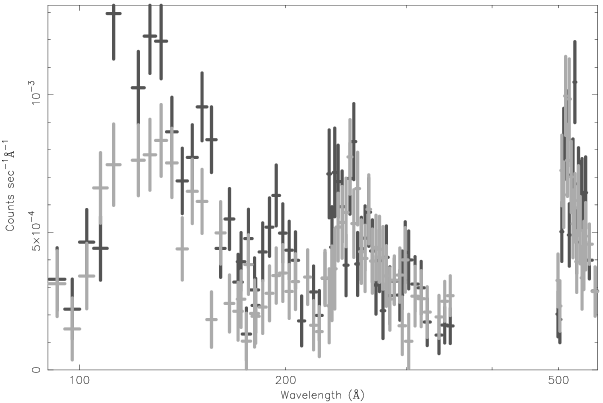
Light-curves of RE J0720-318 were extracted from the four detectors onboard EUVE and were analysed with a Fourier routine based on the Lomb algorithm (Lomb lomb76 (1976)) to look for power between 0.3 – 560.0 days-1. The three spectrometer light-curve power spectra all have high noise levels and no significant periodicities other than those related to the satellite orbit were found. Nevertheless, we noted a weak feature in the SW power spectrum centred on days-1. In contrast, in the power spectrum of the DS light-curve we found a significant peak at a confidence level greater than 3, centered on 2.160 days-1. We note that the South Atlantic Anomaly may introduce false peaks into the power spectra of EUVE lightcurves, principally at 0.98 days (Halpern and Marshall halpern (1996)), but also including an alias at half this cycle time. Power spectra of the primsching and deadtime correction tables for this observation do indeed reveal a periodicity on 0.989 days. However, the weak alias we detect at 0.50 days appears to be distinct from our 0.463 day period. Excluding satellite orbital power no other notable features are present. The DS light-curve and relevant section of the power spectrum are presented in Fig. 4. Fitting a sinusoid to this light-curve, the epoch of maximum EUV count rate (Å) was found to be . Folding the four light-curves on this ephemeris it was apparent that while the SW flux is also modulated on this period (Fig. 5), within statistical errors, both the MW and LW fluxes are constant in time, further suggesting that the 0.463 day period is real. Accepting this, the flux change is likely to be due to either variations in HeII opacity along the line of sight or the rotational modulation of spatial inhomogeneities in the photospheric helium and metal distribution. Two spectra corresponding to phases and of the folded DS light-curve were extracted. These are shown in Fig. 6. It can be seen that the variation in EUV flux actually occurs shortward of Å. This observation is inconsistent with the line of sight explanation outlined above. In such a case, any change would be restricted to Å. We suggest therefore that the flux modulation is most likely to be due to a day rotation of the white dwarf arising from inhomogeneous surface abundances. Such inhomogeneities on the surfaces of the white dwarfs in pre-CV systems V471 Tauri (Jensen et al. jensen86 (1986), Dupuis et al. 1997b ) and RE J1016-053 (Vennes et al. vennes96b (1996)) are believed to be the signature of accretion from the wind of the secondary.

3.5.3 Phase Resolved EUV Spectra
| Model Parameter | Value( ISM columns) |
|---|---|
| T | 55000K |
| log g | 7.50 |
| N(HI) | |
| N(HeI) | |
| N(HeII) | |
| log (He/H) | |
| log (C/H) | |
| log (N/H) | |
| log (O/H) | |
| log (Ne/H) | |
| log (Si/H) | |
| log (Fe/H) |
To constrain the nature of the surface abundance inhomogeneities, the two phase resolved spectra were examined with another small grid of photospheric models. This grid, hereafter grid 1, was built around the model shown in Table 4 such that this model point defined the grid centre. Grid 1 is specified by two independent parameters, the helium abundance, Y and the metal abundance, Z. The metal abundance ratios are fixed with respect to each other and are identical to those of the model described in Table 4. Metallicity, Z, can only vary as a whole and Z is directly indexed to the model carbon abundance. During the fitting procedure, two copies of model grid 1 were simultaneously fit to the two phased spectra while holding the line of sight columns fixed at the values given in Table 4. In this procedure, the -statistic provides a measure of the combined fit quality of the models to the two spectra. In a first step, to test the assumption that the spectral change was due to non-uniformities in the photospheric helium distribution the two grid metal parameters were coupled to each other. The best fit to the two spectra was found and the noted. Second, to test the assumption that the spectral change was due to non-uniformities in the photospheric metal distribution the grid helium parameters were coupled to each other. Again the best fit to the two spectra was found and the noted. The best fit model parameters for the two steps are given in Table 5, where subscripts b and d refer to spectral phases and respectively. As the two fitting steps have the same number of degrees of freedom, we may use the likelihood statistic of Edwards (edwards72 (1972)), given by the formula , to calculate that the spectral changes are more likely to be the result of helium as opposed to metal inhomogeneities on the surface of the white dwarf. Indeed, no significant improvement in the fit is achieved by allowing the helium and metal parameters to vary completely independently.
| Parameter | Value (log (N/H)) |
|---|---|
| Zb | |
| Yb = Yd | |
| Zd | |
| 250.4 | |
| Zb = Zd | |
| Yb | |
| Yd | |
| 241.3 |
With this in mind we have examined the possibly that the photospheric helium is confined to a limited region of the white dwarf surface. This was carried out by attempting to fit a linear combination of grid 1 and a further grid made up of models representative of the radiative levitation calculations of Chayer et al (chayer95 (1995)), hereafter grid 2, and described in Table 6. Grid 2 has only one variable parameter, log (Fe/H). This may vary between an abundance of , consistent with the theoretical prediction of Chayer et al. (chayer95 (1995)) and a lower limit of . The abundances of the other elements included, He,C,N,O,Si and Ne, are fixed at the values given in Table 6.
| Model Parameter | Value() |
|---|---|
| T | 55000 K |
| log g | 7.50 |
| log (He/H) | |
| log (C/H) | |
| log (N/H) | |
| log (O/H) | |
| log (Ne/H) | |
| log (Si/H) | |
| log (Fe/H) |
With the grid 1 Y fixed at the grid upper limit of , the grid 1 Z fixed at , and with the grid 2 iron abundance initially fixed at the theoretical value of , by allowing the ISM columns and relative model proportions to vary freely, no acceptable fit to the integrated EUV spectrum could be obtained. The predicted SW flux was several orders of magnitude too low. Next, the fitting procedure was repeated with a freely varying grid 2 iron abundance. An accurate match to the EUV data was found with log (Fe/H) = and relative model proportions of 60% and 40% for grid 1 and grid 2 respectively. The fit achieved here to the EUV data is as statistically significant as that of the model described in Table 4. As this linear combination is also as successful in reproducing the UV observations as our single component model, one cannot be preferred over the other. The EUV spectral variation may be reproduced by a 20% change in the relative proportions of the models i.e. – 70% grid 1 + 30% grid 2 and – 50% grid 1 + 50% grid 2.
4 Discussion
4.1 Is RE J0720-318 viewed through a circumbinary disk
The two previous studies of the EUV spectrum of RE J0720-318 both suggested that the peculiar N(HI)/N(HeI) 1 along this line of sight may be due to the presence of a circumbinary disk (Burleigh et al. burleigh97 (1997), Dupuis et al. 1997a ), a remnant of the prior phase of common envelope evolution. In comparing the spectrum to that of the DA, RE J0723-277, which lies at a distance of pc and is angularly separated in sky from, the pc distant, RE J0720-318 by 4∘, Dupuis et al. (1997a ) alternatively suggested that the line of sight towards the DAO intercepts an ionized cloud. However, neither study made a comparison between the columns observed towards the white dwarfs and the B stars CMa and CMa, two other objects in this region of sky which have been spectroscopically observed by EUVE. Using a grid of LTE, homogeneous H+He photospheric models calculated by Detlev Koester our measurements of the columns towards RE J0723-277 are N(HI), N(HeI) and N(HeII), consistent with the values found by Dupuis et al. (1997a ). The implied ionization fractions of f and f for H and He respectively are consistent with the typical values found by Barstow et al. (barstow97 (1997)) in a spectroscopic EUV study of 13 DA white dwarfs. It has been suggested that the similarities in ionization fractions observed towards the white dwarfs in their sample may indicate that the majority of the absorbing material lies within the local interstellar cloud (LIC; Holberg et al. holberg98b (1998)). Indeed, Holberg et al. (holberg98b (1998)) have found strong evidence supporting this from a high resolution HST STIS observation of the DA white dwarf RE J1032+53. Cassinelli et al. (cassinelli95 (1995)) report N(HI) towards CMa, which Hipparcos (ESA. hipparcos (1997)) measurements put at a distance of between 123-143pc. This is very similar to the measurement of N(HI) towards RE J0723-277 obtained here. Although constraints on N(HeI) towards CMa are not specifically given, examination of Fig. 5b of Cassinelli et al. (cassinelli95 (1995)) suggests that the neutral helium column along this line of sight may also be consistent with that observed towards the DA (). In fact high resolution observations of the line of sight towards CMa obtained with the HST echelle B and G190M gratings, indicate that most of the intervening material lies within 3pc of the Sun, consistent with residence in the LIC (Gry et al. gry95 (1995)). Over the remaining distance, the mean volume density is found to be less than . It seems likely then, that the opacity observed towards RE J0723-277 also resides within the LIC. In stark contrast, the columns observed towards CMa, only 14∘ away in the sky from CMa, but more distant at between 139-170pc, are N(HI) and N(HeI) (Cassinelli et al. cassinelli96 (1996)). This implies a ratio of N(HI)/N(HeI) along this line of sight, very similar to that found towards RE J0720-318. A comparison between the column densities measured towards these two objects, bearing in mind N(HI)= and N(HeI) towards RE J0720-318, may in fact indicate that both CMa and the DAO are viewed through the same LISM structure. The existence of an ionized gas cloud lying beyond the local cloud and in the direction of these objects is strongly supported by the findings of a high resolution study of the line of sight towards CMa (Dupin & Gry dupin98 (1998)). It appears that this is dominated by two ionized clouds distinct from each other in velocity space by 10kms-1, and which Dupin & Gry refer to as C and D. Neither has a velocity consistent with the LIC. Using sulphur, which is only slightly depleted in the interstellar environment, to map the distribution of hydrogen gas, they calculate that the total hydrogen column along this line is N(Htot). This is approximately the neutral helium column observed towards RE J0720-318. If the interpretation here, that these objects are viewed through the same structure, is correct, then such a region of ionized gas, residing at between 123-170pc away in the direction of the CMa tunnel, extends for more than 40pc in length. Further STIS observations of RE J0720-318 and RE J0723-277 would be able to confirm these conclusions. Additionally, a long duration EUVE observation of RE J0720-318 might allow a more accurate determination of fHe along this line of sight which may, in turn, shed further light on the mechanisms responsible for the observed degree of He ionization. For example, consistency with the fractions found by Barstow et al. (barstow97 (1997)) may indicate that the mechanism responsible for the level of fHe, operates over distances of the order pc. This might pressumably argue against a model in which the He ionization resulted from the ambient stellar EUV radiation field impinging on these clouds.
4.2 The elemental abundances in the atmosphere of an accreting white dwarf
In the Burleigh et al. (burleigh97 (1997)) analysis of RE J0720-318, LTE H+He models were used without the constraints imposed by the GHRS data. While the EUV spectrum was interpreted as originating from a white dwarf with a thin hydrogen layer of M☉, a product of mass transfer during a prior common envelope phase, it was suggested that the homogeneously mixed helium observed in the visible photosphere was accreted from the red dwarf wind. However, the evidence from the light-curves, the phase resolved spectra and the multi-wavelength non-LTE modelling reported here, supports a wind accretion origin for all of the observed helium, from the optical through to the EUV. To first order, this excessive abundance of helium, 1 dex above the radiative levitation prediction, is maintained by a balance between the accretion of helium into and the gravitational settling of helium out of the white dwarf photosphere and it is possible to obtain a crude estimate of the accretion rate by solving equation 1 (Sion & Starrfield sion84 (1984)). However, such an estimate may be rather inaccurate for several reasons. For instance, in our calculation it is assumed that the relative abundance of elements in the incoming material have solar values, although it is possible that a slowly rotating weakly magnetic hot white dwarf preferentially accretes certain elements (Alcock & Illarionov alcock80 (1980)). Furthermore, the size of the area of the photosphere onto which the material is accreted is unknown. Nevertheless, noting the following, it should be possible to eliminate the latter difficulty and obtain a rough lower limit to the accretion rate. The spectroscopic signature of a given abundance of helium in the photosphere may be reproduced by models making various assumptions about the abundance and distribution of this helium. For example, a uniform distribution can be assumed over the entire area of the visible hemisphere, or a higher abundance can be assumed over a smaller region, as was shown earlier. In fact, it is found from modelling and equation 1 , where is the mass accretion rate, A, the accretion surface area, the mass density at formation depth of the HeII line used to measure the abundance and v the diffusion velocity relative to the centre of mass, also at the line formation depth, that the minimum accretion rate occurs for a uniform distribution of helium.
| (1) |
The diffusion velocity has been calculated from equation 1 of Vennes et al. (vennes88 (1988)), by incorporating a diffusion coefficient determined from the tables of Paquette et al. (paquette86 (1986)). Putting the following values into equation 1 , A, , log (He/H) and a lower limit of M☉ yr-1 is determined. In fact optical data taken around 1995 January-February suggests that RE J0720-318 undergoes periods of more intense accretion (Finley et al. finley97 (1997)). A H-layer mass of only M☉ is capable of hiding traces of the underlying helium envelope in a 60000K hydrogen rich white dwarf (Vennes & Fontaine vennes92 (1992)), and it is found that this DAO may have acquired M☉ of hydrogen since it emerged from the CE some years ago. We conclude, that although RE J0720-318 most likely has a hydrogen layer mass greater than M☉ now, it may have been almost completely stripped of a hydrogen layer when it emerged from the CE phase of evolution as initially proposed by Burleigh et al. (burleigh97 (1997)).
Both successful model fits to the EUV spectrum of RE J0720-318 achieved here require a global iron abundance of log (Fe/H), although due to the limited wavelength coverage of the high resolution UV data it is not possible to exclude the likelihood that larger amounts of iron are in fact present in the atmosphere, and the abundance of the other elements such as O and N is lower. However, by assuming that an edge or line blend would be visible if predicted to be larger than twice the S/N of the data, the EUV spectrum can be used to set an upper limit of log (Fe/H) on the iron abundance. In the atmosphere of an accreting white dwarf such as RE J0720-318, where the elemental diffusion time-scales are very much shorter than the evolutionary time-scale, the elemental abundances should reach an equilibrium somewhere between those of the incoming material and the radiative levitation values (e.g Vennes et al. vennes96a (1996)). The theoretical radiative levitation prediction (Chayer et al. chayer95 (1995)) which is highly sensitive to the effective temperature and surface gravity of a star, for the abundances of iron and carbon is log (C/H) and log (Fe/H) . Again assuming the abundance of elements in the accreting material to be roughly solar it would be expected that the observed global iron abundance should be at least log (Fe/H) . In contrast to the observed log (C/H), the measured iron abundance for RE J0720-318 does not conform to a simple equilibrium prescription. Such inconsistencies between the theoretical and observed abundances of elements have been widely reported in previous studies of hot white dwarfs. For example Barstow et al. (barstow96 (1996)) find a silicon abundance in GD394 at least a factor 10 above that expected for a 38 500K DA white dwarf. In contrast, the silicon abundance of log (Si/H) in RE J1614-085, a DA of similar , is around a factor 10 below the theoretical value, while nitrogen is found to be over abundant by a factor 1000 (Holberg et al. holberg97 (1997)). Holberg et al. (holberg97 (1997)) suggest that both accretion and mass-loss are perhaps responsible for the non-equilibrium abundances observed in RE J1614-085. A mass-loss of only M☉ yr-1 has been shown to be capable of depleting the photosphere of a white dwarf of silicon on a time-scale of several thousand years (Chayer et al. chayer97 (1997)). In fact a star of RE J0720-318’s metallicity (1/100th solar) is expected to undergo mass-loss at a rate of M☉ yr-1 (Abbott abbott82 (1982)). However, any mass-loss would also reduce the efficiency of accretion (Mullan et al. mullan92 (1992)). The Bondi-Hoyle formalism can be used to provide a theoretical estimate of the rate of spherically symmetric accretion of wind material. The prediction is extremely sensitive to the relative velocity of the incoming material, being inversely proportional to its fourth power. If the separation between the primary and secondary binary components is taken to be cm, based on the ephemeris of Vennes & Thorstensen (vennes96a (1996)), and conservative estimates for the red dwarf mass-loss rate and relative wind velocity of 3 M☉ yr-1 and km s-1 respectively (Mullan mullan96 (1996)) are adopted, an accretion rate of M☉ yr-1 is predicted. Although the size of the area of the photosphere accreting is not known, detailed non-LTE modelling of the 1640Å line profile with linear combinations of pure hydrogen and mixed H+He composition synthetic spectra, allowing the helium abundance and relative model proportions to vary freely, suggests that it is sizable. In fact if the helium abundance is increased above log (He/H) corresponding to % of the visible surface, then a deterioration in the goodness of fit occurs at the 3 level. A solution of equation 1 for these parameters has . We stress that this estimate is extremely crude. However, in view of the observed upper limit on the iron abundance we suggest that, while material is being accreted into the atmosphere of this white dwarf, a weak radiatively driven wind may selectively expel heavy elements from the photosphere.
A EUV study of another DAO+dM system, RE J1016-053, detected in the WFC survey (Pounds et al. pounds93 (1993)) and having a binary period of 0.789 days (Thorstensen et al. thorstensen96 (1996)) also found low globally averaged heavy element abundances on the white dwarf. The line of sight neutral hydrogen column towards this binary of (Vennes et al. vennes96b (1996)) severely attentuates the EUV spectrum longward of 180Å making it more or less impossible to differentiate between helium or metal spatial abundance inhomogeneities as responsible for the 30% peak to peak variation on a 57.3 minute period observed in the EUV flux. The low global heavy element abundances led Vennes et al. (vennes96b (1996)) to suggest that perhaps metals were confined to a small region of the photosphere and were responsible for this variation. However, modeling indicates that the spectral changes observed in RE J1016-053 can be reproduced by an apparent global change in helium abundance of dex, similar to the result obtained here for RE J0720-318. It seems more plausible that the observed spectral changes are due mainly to inhomogenieties in the spatial distribution of photospheric helium.
4.3 Where do the weak red-shifted components originate
Weak, non-photospheric, high ionization features such as the resonance lines of CIV, SiIV and NV have been reported in the UV spectra of several white dwarfs (e.g. Shipman et al. shipmann95 (1995); Holberg et al. holberg95 (1995)). These are often observed to be blue shifted with respect to the photospheric velocity and hence are frequently attributed to a shell of photoionized circumstellar gas possibly formed as a result of weak mass-loss. However, the weak CIV lines detected in the GHRS spectra of RE J0720-318 are redshifted by km s-1 with respect to the observed photospheric velocity, so this material must be moving towards the white dwarf, arguing against a circumstellar origin.
The close proximity of CMa and CMa, separated in the sky from RE J0720-318 by and respectively allows an examination of the possibility that these features reside in the LISM. Distances to both stars are accurately known from Hipparcos (ESA. hipparcos (1997)) observations, CMa lies between 123-143pc away and CMa between 139-170pc. In their high resolution study of CMa with the HST, Gry et al. (gry95 (1995)) tentatively detect two separate non-photospheric components to the CIV resonance line profiles. The first, with a column density of cm-2 and velocity of they associate with a warm cloud probably lying beyond the LIC. The other, with a column desnity of cm-2 has a velocity of which is consistent with the projected velocity of the LIC along this line of sight. The velocity and strength of the possible non-photospheric CIV resonance lines observed in spectrum of CMa are also consistent with a formation in the LIC (Dupin & Gry dupin98 (1998)). However, for the CIV features in the GHRS spectra of RE J0720-318, although the weighted mean velocity of kms-1 suggests a formation in the LIC, assuming the lines to lie on the linear part of the curve-of-growth, a lower limit to the column density of N(CIV) can be set. This may be rather higher than expected from the and CMa observational results and the predictions of theoretical studies of the conductive interface where this species is believed to reside (N(CIV)cm-2; Cheng and Bruhweiler cheng90 (1990)).
Alternatively, it may be that they are related to the binary itself. Indeed, the radiation field from a hot hydrogen rich white dwarf is capable of creating and maintaining highly ionized species in a gas in close enough proximity (Dupree & Raymond dupree83 (1983)). For example, non-photospheric CIV absorption lines have been observed at a wide range of binary phases in IUE echelle spectra of the DA+dM pre-CV binary Feige 24 (Dupree & Raymond dupree82 (1982)). Vennes & Thorstensen (1994b ) used a simple photoionization model in their study of low density gas in the environment of the DA, and found for plausible electron temperatures in the range , that while the majority of the total carbon would be in the form of CV, a fraction of between would be in the form of CIV in its groundstate. They concluded that a likely origin for the absorption features was in circumstellar material possibly a remnant left over from the CE phase (Vennes and Thorstensen 1994b ). As the HST observations of RE J0720-318 were aquired close to binary quadrature, the possibility that they form in a cloud of remnant CE gas located at the L1 Lagrangian point can be discounted. Nevertheless, using the photoionization code XSTAR (Kallman & Krolik kallman97 (1997)) it is found that for gas with a plausible T, the elements of which are in solar proportions, lying outside the binary system at a distance of the binary separation, where effectively all CIV is in groundstate, the fraction of the total carbon in the CIV state, can be between , for hydrogen densities in the range . In contrast, the fraction of helium in the neutral state is , with the majority being twice ionized. Thus it seems plausible that our CIV features may also originate in material lying outside of the binary system, possibly remnants of the CE. Indeed, as pointed out by both Burleigh et al. (burleigh97 (1997)) and Dupuis et al. (1997a ), a circumbinary disk is theoretically predicted to form from the remains of the common envelope gas.
Further modelling of gas in the vicinity of the DAO was carried out to investigate whether these features may alternatively reside in a wind from the red dwarf companion. Departures from groundstate are likely negligible at the densities and temperature considered (Kallman & Krolik kallman97 (1997)), except within a few stellar radii of the white dwarf where photoexcitation may be significant. XSTAR was run to calculate the fraction of total gas in the form of CIV for a range of mass-loss rates (). The wind density was assumed to drop off as the square of the distance from the source and the wind velocity taken as , roughly the difference between the radial velocity of the CIV lines and the ephemeris prediction for the red-dwarf velocity. At a series of logarithmically spaced distances from the white dwarf, the local number density of CIV was calculated. By integrating along the line of sight an estimate for the CIV column was obtained. For the chosen mass-loss rates the predicted column was found to lie in the range N(CIV). A mass-loss rate of should produce N(CIV) consistent with the observational lower limit. Mullan (mullan96 (1996)) reports that a detection of the inactive Barnard’s Star at has been interpreted as free-free emission originating in a mass-loss wind of . Hence, it also seems plausible that these absorption features may be formed in a photoionized wind from the red dwarf. Furthermore, at the observed velocity, wind material would be moving towards the white dwarf and possibly accreting onto it, consistent with the wind accretion model cited to explain the EUVE data.
5 Summary
It has been demonstrated that all of the helium in the optical, UV and EUV spectra of RE J0720-318, and most probably heavy elements too, are likely accreted into the atmosphere from the wind of the dM companion. This conclusion is supported by the non-uniform spatial distribution of EUV opacity in the white dwarf photosphere. It has been found that even at the lower limiting rate of accretion, the white dwarf may well have gained its entire observable atmosphere from the wind of the secondary in the time since it emerged from the CE phase of evolution. Furthermore, the non-uniformity has allowed an estimate of the rotation period of the white dwarf (days) to be made. The photospheric iron abundance is at least a factor 10 lower than predicted by a simple balance between gravitational settling and the opposing upward pressure of the radiation field. Along with the rather lower than expected accretion rate, this has been interpreted as due to the possible presence of a selective mass-loss wind. Several possible origins for weak non-photospheric CIV lines observed in GHRS spectra of RE J0720-318 have been examined. Although the line velocities are consistent with a formation in the LISM, the column density may be rather larger than expected. Alternatively, we have shown that this CIV may reside in photoionized gas in close proximity to the white dwarf. This may take the form of either residual CE material surrounding the binary or in a putative wind from the secondary star. Finally, circumstantial evidence has been presented which argues against a circumbinary disk as responsible for the unusual N(HI)/N(HeI) along this line of sight. Instead, it has been shown that it is more likely due to an extended region of ionized gas lying in the direction of the CMa ISM tunnel.
Acknowledgements.
PDD, MAB and MRB acknowledge the support of PPARC, UK.References
- (1) Abbott, D.C. 1982, ApJ 259, 282
- (2) Alcock, C. & Illarionov, A. 1980, ApJ 235, 541
- (3) Barstow, M.A., Fleming, T.A., Diamond, C.J., et al. 1993, MNRAS 264, 16
- (4) Barstow, M.A., O’Donoghue, D., Kilkenny, D., et al. 1995, MNRAS 273, 711
- (5) Barstow, M.A., Holberg, J.B., Hubeny, I., et al. 1996, MNRAS 279, 1120
- (6) Barstow, M.A., Dobbie, P.D., Holberg, J.B., et al. 1997, MNRAS 286, 58
- (7) Barstow, M.A., Hubeny, I., Holberg, J.B. 1998, MNRAS 299, 520
- (8) Bergeron, P., Saffer, R.A., Liebert, J. 1992, ApJ 394, 228
- (9) Bergeron, P. Wesemael, F., Beauchamp, A., et al. 1994, ApJ 432, 305
- (10) Bowyer, S., Lieu, R., Lampton, M., et al. 1994, ApJS 93, 569
- (11) Bruhweiler, F.C., Kondo, Y. 1981, ApJL 248, 123
- (12) Bruhweiler, F.C., Feibelman, W. 1991, ApJL 248, 123
- (13) Burleigh, M.R., Barstow, M.A., Dobbie, P.D. 1997, A&AL 317, 27
- (14) Cassinelli, J.P., Cohen, D.H., MacFarlane, J.J., et al. 1995, ApJ 438, 932
- (15) Cassinelli, J.P., Cohen, D.H., MacFarlane, J.J., et al. 1996, ApJ 460, 949
- (16) Chayer, P., Vennes, S., Pradhan, A.K., et al. 1995, ApJ 454, 429
- (17) Chayer, P., Fontaine, G., Pelletier, C. 1997, In : White Dwarfs, eds. Isern, J., Hernanz, M., Garcia-Berro, E., Kluwer, 281
- (18) Cheng, K., Bruhweiler, F.C. 1990 ApJ 364, 573
- (19) Dupin, O., Gry, C. 1998, A & A 335, 661
- (20) Dupree, A.K., Raymond, J. 1982 ApJ 263, L63
- (21) Dupree, A.K., Raymond, J.C. 1983, ApJL 275, L71
- (22) Dupuis, J., Vennes, S., Bowyer, S. 1997a, In : White Dwarfs, eds. J. Isern, M. Hernanz and E. Garcia-Berro, Kluwer, 281
- (23) Dupuis, J., Vennes, S., Chayer, P., et al. 1997b, In : White Dwarfs, eds. J. Isern, M. Hernanz and E. Garcia-Berro, Kluwer, 281
- (24) Edwards, A.W.F. 1972, Likelihood, Cambridge University Press, Cambridge.
- (25) Finley, D. 1996, In : Astrophysics in the Extreme Ultraviolet eds. Bowyer, S., Malina, R., Kluwer, Netherlands.
- (26) Finley, D.S., Koester, D., Basri G. 1997, ApJ 488, 375
- (27) Fontaine, G., Wesemael, F. 1987, In : Proc. IAU 95, 2nd Conference on Faint Blue Stars, eds. Hayes, D.S, Liebert, J., Philip, A., Schenecdaty : Davis
- (28) Gry, C., Lemonon, L., Vidal-Madjar, A., et al. 1995 A&A 302, 497
- (29) Halpern, J.P. & Marshall, M.L. 1996 ApJ 464, 760
- (30) ESA 1997 The Hipparcos and Tycho Catalogues: ESA SP-1200
- (31) Holberg, J.B., Hubeny, I., Barstow, M.A., et al. 1994 ApJ 425, 105
- (32) Holberg, J.B., Bruhweiler, F.C., Andersen, J. 1995 ApJ 443, 753
- (33) Holberg, J.B., Barstow, M.A., Lanz, T., et al. 1997 ApJ 484, 871
- (34) Holberg, J.B., Barstow, M.A., Sion, E.M. 1998, Proceedings of the Conference “Ultraviolet Astrophysics, Beyond the IUE Final Archive”, Seville, Spain
- (35) Holberg, J.B., Bruhweiler, F.C., Barstow, M.A., et al. 1998 ApJ Accepted
- (36) Hubeny, I. 1988, Comp. Phys. Comm. 52, 103
- (37) Hubeny, I., Lanz, T., Jeffery C.S. 1994, In : Jeffery C.S., ed., Newsletter on Analysis of Astronomical Spectra No. 20, St. Andrews Univ., 30
- (38) Hubeny, I., Lanz, T. 1995, ApJ 439, 875
- (39) Jensen, K.A., Swank, J.H., Petre, R., et al. 1986, ApJL 309, L27
- (40) Jordan, S., Wolff, B., Koester, D., et al. 1994, A&A 290, 834
- (41) Kallman T.R., Krolik J.H. 1997, XSTAR: A Spectral Analysis Tool. Version 1.40 of the User’s Guide
- (42) Lampton, M., Margon, B., Bowyer, S. 1976, ApJ 208, 177
- (43) Lomb, N.R. 1976, ApSS 39, 447
- (44) Marsh, M.C., Barstow, M.A., Buckley, D.A., et al. 1997, MNRAS 287, 705
- (45) Mullan, D.J., Shipman, H.L., Sion, E.M., et al. 1992, ApJ 374, 707
- (46) Mullan, D.J. 1996 In : Cool Stars, Stellar Systems and the Sun, eds. Pallavicini, R., Dupree, A.K., ASPCS 109
- (47) Paquette, C., Pelletier, C., Fontaine, G., et al. 1986, ApJS 61, 177
- (48) Pounds, K.A., et al. 1993, MNRAS 260, 77
- (49) Reid, N., Wegner, G. 1988 ApJ 335, 953
- (50) Rumph, T., Bowyer, S. Vennes, S. 1993, AJ 107, 2108
- (51) Schatzmann, E. 1958, White Dwarfs, Amsterdam:North Holland
- (52) Schning, T. and Butler, K. 1989, A&AS, 78, 51
- (53) Shafer, R.A., Haberl, F., Arnaud, K.A., et al. 1991, ESA TM-09
- (54) Shipmann, H., Provencal, J., Roby, S., et al. 1995, AJ 109, 1220
- (55) Sion, E.M. & Starrfield, S. 1984, ApJ 286, 760
- (56) Sion, E.M., Schaeffer, K.G., Bond, H.E., et al. 1998, ApJL 496, L29
- (57) Sirk, M.M., Vallerga, J.V., Finley, D.S., et al. 1997, ApJS 110, 347
- (58) Thorstensen, J.R., Vennes, S., Bowyer, S. 1996, ApJ 457, 390
- (59) Tweedy, R.W., Holberg, J.B., Barstow, M.A., et al. 1993, AJ 105, 1938
- (60) Vauclair, G., Vauclair, S., Greenstein, J.L. 1979 A&A 80, 79
- (61) Vennes, S., Pelletier, C. Fontaine, G., et al. 1988, ApJ 331, 876
- (62) Vennes, S., Fontaine, G. 1992, ApJ 401, 288
- (63) Vennes, S., Thorstensen, J.R. 1994a, ApJL 433, L29
- (64) Vennes, S., Thorstensen, J.R. 1994b, AJ 108, 1881
- (65) Vennes, S., Thorstensen, J.R. 1996, AJ 112, 284
- (66) Vennes, S., Dupuis, J., Bowyer, S., et al. 1996, ApJL 482, L73
- (67) Weidemann, V. 1990, ARAA 28, 103
- (68) Wolff, B., Jordan, S., Koester, D. 1996, A&A 307, 149