Infrared Candidates for the Intense Galactic X-ray Source GX 17+2 111 Based on observations with the NASA/ESA Hubble Space Telescope, obtained at the Space Telescope Science Institute, which is operated by the Association of Universities for Research in Astronomy, Inc., under NASA contract NAS5-26555.
Abstract
We present new astrometric solutions and infrared Hubble Space Telescope observations of GX 17+2 (X1813–140), one of the brightest X-ray sources on the celestial sphere. Despite 30 years of intensive study, and the existence of a strong radio counterpart with a sub-arcsecond position, the object remains optically unidentified. The observed X-ray characteristics strongly suggest that it is a so-called “Z-source,” the rare but important category that includes Sco X–1 and Cyg X–2. Use of the USNO-A2.0 catalog enables us to measure the position of optical and infrared objects near the radio source to sub-arcsecond precision within the International Celestial Reference Frame, for direct comparison with the radio position, which we also recompute using modern calibrators. With high confidence we eliminate the star NP Ser, often listed as the probable optical counterpart of the X-ray source, as a candidate. Our HST NICMOS observations show two faint objects within our radius 90% confidence error circle. Even the brighter of the two, Star A, is far fainter than expected (), given multiple estimates of the extinction in this field and our previous understanding of Z sources, but it becomes the best candidate for the counterpart of GX 17+2. The probability of a chance coincidence of an unrelated faint object on the radio position is high. However, if the true counterpart is not Star A, it is fainter still, and our conclusion that the optical counterpart is surprisingly underluminous is but strengthened.
Accepted for publication in The Astrophysical Journal
received 1999 February 11; accepted 1999 May 10
1 INTRODUCTION
One of the brightest persistent X-ray sources in the Galaxy (and thus in the entire X-ray sky), GX 17+2 (X1813–140) has been observed since the early sounding rocket days (Friedman et al. 1967). The object is now deemed a classic low-mass X-ray binary, exhibiting variable, non-thermal radio emission, X-ray bursts, and “Z-source” characteristics, including quasi-periodic X-ray oscillations. As the group of Z-sources contains many of the X-ray brightest objects in the sky, including Sco X–1 and Cyg X–2, but is numerically small (about a half-dozen), it is clearly desirable to identify and study optical counterparts of as many as possible.
GX 17+2 was in fact “optically identified” more than a quarter-century ago (Tarenghi & Reina 1972) with a G star, now known as NP Ser, on the basis of an excellent X-ray position, and subsequently a sub-arcsecond radio position (Hjellming 1978). There is one problem, however: the optical “counterpart” stubbornly refuses to show any photometric or spectroscopic abnormalities (e.g., Davidsen et al. 1976; Margon 1978; Cowley, Hutchings, & Crampton 1988; Bandyopadhyay et al. 1999), despite the estimate of (Bradt & McClintock 1983). Imamura et al. (1987) reported a single, odd optical spike of three minutes duration in a aperture around this object, an observation to our knowledge not replicated or confirmed in the last decade. Naylor et al. (1991) reported possible IR variability, and colors inconsistent with a single, normal star.
At this low galactic longitude and latitude () projected near the galactic center, GX 17+2 is a clear case where the “optical identification” could be a chance superposition of an unrelated object. Indeed, Naylor et al. suggest NP Ser may be such a superposition on the X-ray source, based on incompatible absorption inferred from the optical and X-ray objects. Penninx et al. (1988) opine that there is no plausible optical counterpart. On the other hand, some very current reviews (e.g., van Paradijs 1995) still tabulate NP Ser as the identification.
Using high angular resolution imagery of the Hubble Space Telescope (HST) WFPC2, Deutsch et al. (1996) find that in the visible, NP Ser appears to be a single object, with no significant deviations from the typical WFPC2 point-spread function (PSF) of FWHM. By subtracting a model PSF, they set upper limits on a possible second nearby object which might be the real optical counterpart, with at angular separation larger than from NP Ser.
The astrometric relationship of the X-ray source, the radio source, and the visible object NP Ser as understood prior to this work is summarized by Deutsch et al. (1996). Based on astrometric data used to create the HST Guide Star Catalog (GSC), they concluded that the long-accepted agreement between the positions of the radio source and NP Ser, the only real evidence implicating that star as the counterpart, was likely spurious. The extinction towards GX 17+2, as determined both from absorption in the X-ray spectrum and the observed dust-scattered X-ray halo, is high (), and thus a high-resolution search for a counterpart in the near infrared may be more sensitive than previous work. A ground-based IR search by Naylor et al. (1991) did not yield any additional candidates besides NP Ser. Here we discuss an improved astrometric alignment of optical and radio frames, as well as new observations with NICMOS aboard HST. A preliminary discussion of the NICMOS data has appeared in Wachter (1998).
2 OBSERVATIONS AND DATA REDUCTION
2.1 Archival Radio and X-ray Observations
Grindlay & Seaquist (1986) published a precise radio position for GX 17+2 based on 1982 VLA A array observations. We have extracted and recalibrated these and more recent observations from the VLA data archive, and determined new positions and fluxes, using more modern positions for the calibrators. A summary of our results from the reprocessed data is presented in Table 1. Columns 1–3 list the observation date, array configuration, and wavelength of the observation, respectively. Column 4 lists the peak flux density or a upper limit and a uncertainty. The last two columns list B and B and the respective uncertainties. The early 1981 and 1982 positions agree well with the results of Grindlay & Seaquist (1986). The later 1988 and 1989 position are also consistent with each other, but disagree slightly in with the earlier observations. As the later observations are viewed as more reliable than very early VLA data, we determine our final best position by combining the top three positions (1988–1989) in Table 1. We then convert the B1950 system coordinates into J2000 with the IDL Astronomy User’s Library (Landsman 1993) jprecess procedure (calibrator epoch 1979.0) and give the final result, our preferred weighted radio position, in Table 2. This value differs slightly from the value in Deutsch et al. (1996), which was not converted from the FK4 to FK5 system properly, although the conclusions of that paper are not affected. We note in passing that the discrepancy between the 1981–1982 and 1988–1989 positions may include a component due to proper motion.
For completeness we have also extracted the three Einstein HRI X-ray observations available in the HEASARC data archive, and recentroided the positions of GX 17+2. These B1950 positions are combined into a single best position, converted from B1950 to J2000 in the same fashion as above, and also listed in Table 2. As the precision is far less than the radio data, the difference from Deutsch et al. (1996) is inconsequential.
2.2 Optical Astrometry
With the recent publication of the USNO-A2.0 star catalog (Monet et al. 1998), it has become possible to tie an arbitrary field rather easily to the International Celestial Reference Frame with sub-arcsecond precision. In a study of 283 extragalactic radio sources which have very accurate VLBI radio positions and are well detected in the USNO-A2.0 catalog, Deutsch (1999) reports that 90% of the optical positions are within of the radio coordinates and all are within . Also, when a solution is transferred from the USNO-A2.0 catalog to modern epoch, deeper images (the POSS II in Deutsch 1999) for 108 objects, 90% of the optical positions are within of the radio coordinates and all are within ; this latter comparison may be the most relevant for the current situation. Armed with this improved accuracy and quantification of the uncertainties in the optical astrometric frame, we recompute an optical astrometric solution for NP Ser from the available imagery.
We select 84 USNO-A2.0 stars brighter than red magnitude 17 which fall on an 1111′ ground-based R-band CCD image of this field discussed by Deutsch et al. (1996). Some of these stars are then rejected due to nearby companions, image defects, or significant proper motion. The final set of 73 stars yields a solution with residuals of = and therefore an approximate uncertainty () in the alignment to the USNO-A2.0 frame of . The frame is then transferred to the F675W-band HST WFPC2 image presented by Deutsch et al. (1996) using 5 stars, resulting in an alignment uncertainty of .
As there are only two well detected stars in common between the WFPC2 and NICMOS images, the astrometric scale and rotation in the NICMOS image headers are preserved but the absolute offset is adjusted such that the positions of these two stars agree to better than in the NICMOS and WFPC2 images. This process has yielded an alignment of the NICMOS images to the USNO-A2.0 reference frame with an uncertainty of less than . Our final measurement of the optical position of NP Ser on these various images in the USNO-A2.0 frame is listed in Table 2, and is from the radio position, a discrepancy larger than for any of the 108 solution transfer tests by Deutsch (1999). The improved accuracy of the USNO-A2.0 frame now implies that this current work supersedes the optical astrometry of Deutsch et al. (1996).
It must also be noted that NP Ser itself does have an entry in the USNO-A2.0 catalog as listed in Table 2. This position is from the radio position, a discrepancy which is larger than for any of the 283 radio sources studied by Deutsch (1999), and thus the association of NP Ser with the radio source is excluded at % confidence 444 Although the HST data suggest a slightly larger offset of the optical and radio positions than the USNO-A2.0 data, the confidence of exclusion is slightly lower due to an additional uncertainty term involving the transfer of frames and proper motions (Deutsch 1999).. As we have measured deeper images obtained at significantly better angular resolution, we are not alarmed by the level of agreement of the two NP Ser positions. It is possible that the discrepancy is a marginal detection of proper motion between the 1952.4-epoch USNO-A2.0 position and the 1995.8-epoch CCD frame. Further, NP Ser is among the fainter objects in the USNO-A2.0 catalog and thus the centroiding uncertainty therein may be significant at this level. For both reasons, we prefer our HST position, which is based on the USNO-A2.0 positions of many reference stars, over the USNO-A2.0 catalog entry for NP Ser itself. Most important, both positions imply that NP Ser is not the radio or X-ray source. Depending somewhat on the catalog consulted, GX 17+2 thus becomes the second or third brightest persistent X-ray source on the celestial sphere lacking an optical/infrared counterpart, a situation made yet more troubling given the excellent radio position.
It should also be stressed that the radio and X-ray sources are known to show correlated behavior (Penninx et al. 1988), and thus their cross-identification seems nearly certain, quite aside from their positional coincidence. We need therefore not consider the region inside the large X-ray error circle but well away from the precise radio position. For a relatively bright radio source such as this ( mJy at 6 cm), the internal precision of the radio position determination is very high, . Future precise X-ray observations, such as those from Chandra X-ray Observatory, will have internal precision which, while excellent by X-ray astronomy standards, will not equal this value, and will also in addition still be subject to similar external astrometric uncertainties discussed here. Thus while future X-ray determinations will nicely complement this discussion, they are unlikely to supersede it in accuracy.
2.3 HST NICMOS Observations
On 1997 August 14 we obtained brief HST NICMOS camera 1 ( pixel-1) images of NP Ser with the F110W and F160W filters, which are similar to the Johnson J and H passbands, respectively. A circular dither pattern of five exposures was used for each filter, yielding a total exposure of 480 s in F110W and 1519 s in F160W. These observations occurred early in NICMOS’s lifetime, and many of the reference files used in the original pipeline processing have since been replaced with newer, in flight versions. Thus we reprocess the raw data with the newer reference files (current as of 1999 January) using the STSDAS calnica task. Further reduction is performed with software written in IDL by E. W. D. or available in the IDL Astronomy User’s Library (Landsman 1993).
For each filter, the five exposures are mosaiced into a single frame as follows. First the fixed background pattern in each of the images is removed by subtracting the median image derived from the stack of images. Next the bad pixels are zeroed in each individual exposure and corresponding exposure mask. The five images and masks are then aligned using several reference stars. Finally the images are summed and the result divided by the sum of the exposure masks.
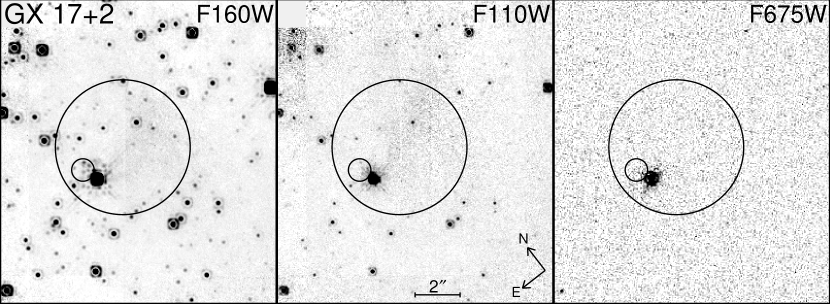
In Fig. 1 we show the mosaics of the GX 17+2 field in F160W and F110W as well as the WFPC2 F675W band. The large circle indicates the % confidence radius error circle of the X-ray position of GX 17+2. The small circle indicates the position of the radio counterpart to the X-ray source. The radius corresponds to the 90% confidence level in the alignment of the optical and radio frames. The bright star South of the radio circle is NP Ser itself.
2.4 PSF Subtraction
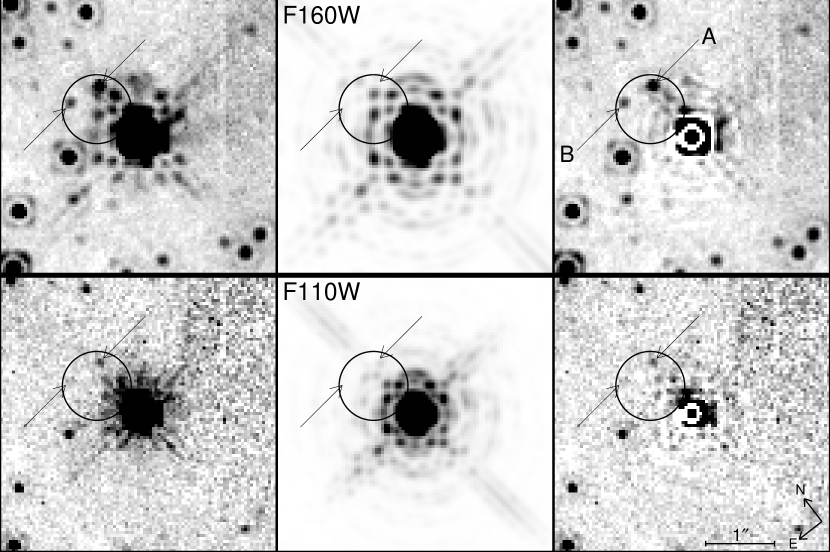
As NP Ser continues to be ruled out as the counterpart of GX 17+2 with good confidence on astrometric grounds, we examine the newly derived optical/IR region corresponding to the variable radio source. While the bright central core of NP Ser is not within the radio error circle, the complex wings of the HST NICMOS PSF visibly encroaches into the region of interest. We generate a synthetic PSF using version 4.4 of the Tiny TIM software package (Krist 1993) and attempt to subtract NP Ser from our images. The model PSF is slightly blurred with a Gaussian filter to better match to the combined image, which suffers a small loss of resolution in the mosaicing process and due to telescope jitter. Figure 2 displays a 44′′ region centered on NP Ser in F160W (top row) and F110W (bottom row) including the radio error circle from Fig. 1. The first panel in each row contains the original image; the second panel shows the model PSF at approximately the same stretch; the final panel displays the residual image after PSF subtraction. The residuals are high within the central of NP Ser at this stretch, but the subtraction is quite clean beyond that radius.
The PSF structure within the radio source error circle subtracts fairly well, although note some residual of the four-point pattern remains. In the F160W image, only two objects (indicated with arrows) remain within the entire 90% confidence error circle. These objects, which we denote A and B, are also clearly visible in the first panel before the PSF subtraction. We therefore suggest that only these two objects are compatible with being the IR counterpart of GX 17+2 to the depth of all searches conducted thus far. Our measured position for these candidates are listed in Table 2. The offsets of these objects from the radio coordinates are only and for Stars A and B, respectively, well within the 90% systematic uncertainties in the astrometric frame discussed in §2.2.
The bottom row of Fig. 2 shows results of a similar PSF subtraction for the F110W data, which is clearly not as deep. Star A is clearly detected, and there may be a F110W detection of an object at the location of Star B (indicated with an arrow), but this may instead be a random fluctuation in the background.
Naylor et al. (1991) have reported from ground-based observations infrared variability of the image of NP Ser, and suggested that a closely superposed counterpart of the X-ray source begins to contribute significantly to the total IR flux from this region, thus explaining their detection of modulation. As the new counterparts we discuss here are cleanly separated from NP Ser in our data, we can explicitly calculate the ratio of fluxes of NP Ser to Stars A/B, which is . Thus Naylor et al. (1991) and Imamura et al. (1987) cannot have observed flux from our candidates: they are simply far too faint.
2.5 NICMOS Photometry
Since the field is not very crowded by HST standards, we elect to use aperture photometry to measure each of the objects detected in this field. A total of 133 objects are found, but 60 are not confidently detected in the shallower F110W frame and only upper limits are available. There are no objects detected in the F110W frame which are not detected in the F160W frame. Each object is measured with a 2 pixel radius aperture and the result is adjusted with an aperture correction derived from a suitable Tiny TIM PSF. Count rates are converted to the VEGAMAG system using the PHOTFNU keyword from the (reprocessed) headers and from column 3 of Table 18.1 in the HST Data Handbook.
The resulting magnitudes are similar to Johnson and , but not identical. Since the final transformation depends on the stellar spectrum and reddening in a complex fashion, we choose not to attempt to convert our magnitudes to the Johnson system for all objects. The VEGAMAG magnitudes will be hereafter referred to as and . In some cases transformations between the Johnson and HST VEGAMAG systems are calculated, based on the described assumptions. We use the STSDAS synphot package to calculate colors for all stars in Gunn & Stryker (1983) and interpolate the required transformation based on the observed color. In the following discussion we will quote relative uncertainties, although additional % systematic calibration uncertainties apply for each color.
3 DISCUSSION
3.1 Color-Magnitude Diagram
Figure 3 shows a color-magnitude diagram derived from aperture photometry of the NICMOS F110W and F160W observations. Plotted as black circles are the 74 objects in the field which are detected in both frames. Objects with only an upper limit are not plotted, but we denote the upper limit as a dashed line. Magnitudes are in the VEGAMAG system, and formal uncertainties are provided for each source.
The brightest object in the field is NP Ser at , . The open square indicates the ground-based , measurements of NP Ser reported by Naylor et al. (1991), corrected to the HST VEGAMAG system, using transformations , , appropriate for a G star with . The error bars on the square denote the uncertainties quoted in Naylor et al. and do not include an unknown additional uncertainty in the transformation. Within the various uncertainties, our HST NICMOS measurement is in agreement with the previous ground-based result. Davidsen et al. (1976) have spectroscopically typed the star as G, and Cowley, Hutchings & Crampton (1988) as G8, and clearly of dwarf or subgiant luminosity, not giant. We overplot on our color-magnitude diagram a stellar main sequence with no reddening and a distance kpc for reference. The distance is selected such that NP Ser falls at late G on the sequence.
Two more dwarf stellar sequences are added to the diagram, one with stars reddened by E at a distance kpc, and one with stars reddened by E at a distance kpc. We also add a giant stellar sequence with stars reddened by E at a distance kpc, which may best describe the reddest of the bright stars. Clearly the color does not change drastically with stellar type, but rather mostly with interstellar reddening. This allows us to conclude that except for NP Ser itself, essentially all other stars in the field must have E. In addition, at the fainter end there appears to be a reasonably narrow locus of stars corresponding to E. These conclusions do not depend on the assumption that the field stars are actually of dwarf luminosity, and some may be giants, although the reddening per unit distance would then be rather low.
3.2 Nature of the Infrared Candidates
As pointed out in §2.4, there are now only two viable candidates based on the latest optical astrometric alignment. For Star A we measure , after subtracting the NP Ser PSF. For Star B, we find , and there may be be a faint detection of this object in the F110W image, although alternatively it may be a PSF residual or image defect. We report the possible detection with , and label the object with a triangle in Fig. 3. For objects with color , transformations to Johnson magnitudes of and are implied. Approximate magnitudes for Star A of , , and for Star B or , may thus be inferred.
Of course, one or perhaps both of these candidates may yet be further chance superpositions! In our 1314′′ F160W-band field of view, we detect 0.7 objects arcsec-2 with . As our 90% confidence radio error circle has area 0.8 arcsec2, it is easily inferred that the likelihood of one of these unrelated objects falling within our error circle is close to 50%. As with most a posteriori probability calculations, this one is extremely sensitive to arbitrary assumptions. Had we considered a confidence radio error circle, for example, the chance coincidence probability would almost halve.
Obviously a search for temporal variability of these candidates, and particularly spectroscopy of these stars, are future steps forward in the problem. Even for the brighter of the two, these will be challenging observations due to the small angular separation, , and large magnitude difference, , from NP Ser, as well as the small separation between A and B (). However, our photometry, combined with extinction estimates here and made previously in the literature, already allow some simple but quite interesting inferences.
Previous constraints on the extinction to GX 17+2 from X-ray observations have been summarized by Naylor et al. (1991), and go beyond the normal procedure of fitting the turnover in the soft X-ray spectrum, as independent data from a dust scattered X-ray halo (Catura 1983) are also available. These estimates are consistent, and yield . From our color-magnitude diagram (Fig. 3) we have concluded above that all objects in the field (except the presumptively irrelevant NP Ser) probably have , and many have , yet another consistent, albeit uncertain, estimate. We adopt (Cardelli, Clayton, & Mathis 1989) and for GX 17+2 for the remainder of this discussion; our most important conclusions are not unduly sensitive to this assumption.
Although the distance to GX 17+2 is poorly constrained, its projected location near the galactic center, the inferred extinction, as well as the observed X-ray flux and spectrum (Christian & Swank 1997) and characteristics of the X-ray bursts (Sztajno et al. 1986) all suggest that kpc is almost surely a very conservative range that includes the actual distance of the object. Including a correction for extinction, this implies for the brighter of the two candidates.
-band photometric data on Z-sources, for comparison with the results we obtain for GX 17+2, are relatively sparse in the literature. The two best studied sources are probably, not surprisingly, Sco X–1 and Cyg X–2, although their distances, and thus values, are still only approximately known. Luckily their extinction at is probably small. The Z-source GX 349+2, although more poorly studied, is confidently optically identified. The current best estimates of , reddening, distance, and the inferred for these three sources are collected from the literature in Table 1. As these objects are all photometrically variable, these values must be regarded as typical rather than precise. We see values in the range are represented.
We are therefore faced with the surprise that, despite the very similar X-ray behavior of GX 17+2 to that of the other Z-sources, at least at the time of our observations the optical/IR counterpart is intrinsically fainter, quite possibly by , than previously studied analogs. Furthermore, if Star A is not the true counterpart of the X-ray source, this conclusion is only strengthened, as there is nothing brighter within the radio error circle.
As at least the visible light from low mass X-ray binaries is typically dominated by reprocessing of the intense incident X-ray flux, we have considered if by bad luck the X-ray source could have been quiescent during our HST observations, although there is no incident in the literature of such dramatic behavior. The public data archive of the All Sky Monitor of the Rossi X-ray Timing Explorer allows us to effectively rule out this possibility. Although no RXTE ASM measurements coincide precisely with the NICMOS observations, a dozen measurements on the same day indicate modest variability about the mean intensity Jy, the same intensity value tabulated in the compendium of van Paradijs (1995). We thus believe that this unusually low luminosity of the counterpart is a genuine feature of the source. An obvious but interesting caveat is that if the system inclination is favorable and the timing of our observations highly fortuitous, we could have observed the system in a brief eclipse which has thus far escaped detection in X-rays. Even a small number of further infrared observation should clarify this possibility.
Barring this unlikely eclipse scenario, the inferred for this source is extremely high (a longstanding problem even if NP Ser were the counterpart). Bradt & McClintock (1983) derived based on the assumption that NP Ser is the identification with E; this is higher than any other LMXB in their compilation. More current determinations of E for NP Ser find it to be almost negligible, which implies an even higher value of . If instead the true optical counterpart lies within the radio error circle we have searched (Fig. 2), we can estimate a lower bound to as follows: by assuming Jy, an intrinsic spectrum of a 25,000 K blackbody, (based on X-ray constraints), and (Star A or fainter) we find . This is higher than the other Z-sources and the LMXB average (van Paradijs & McClintock 1995), but comparable to the remarkable 11 min binary X1820–303, which may exhibit the highest value of . We infer that the optical/IR candidate of GX 17+2 should be highly variable, yet another piece of evidence against NP Ser.
4 CONCLUSIONS
A new astrometric solution referring optical and infrared objects in the field of GX 17+2 to the International Celestial Reference Frame eliminates with high confidence NP Ser as the counterpart of the non-thermal, variable radio source. If we also consider the co-variability of the X-ray and radio objects (Penninx et al. 1988), NP Ser cannot be the counterpart of the X-ray source, a conclusion which has been mooted on and off over three decades, but never entirely accepted. New HST NICMOS observations identify two faint () stellar objects coincident with the radio position, although they may be additional chance superpositions of unrelated objects. Regardless of this possibility, the evidence is strong that the optical/IR counterpart of GX 17+2 is surprisingly underluminous compared with other Z-sources. We expect marked photometric variability from the counterpart.
Even after thirty years of observations, GX 17+2, though one of the most intense X-ray sources known, continues in many ways to defy a simple analysis.
References
- (1) Bandyopadhyay, R. M., Shahbaz, T., Charles, P. A., & Naylor, T. 1999, MNRAS, in press (preprint astro-ph/9901327)
- (2) Bradshaw, C. F., Fomalont, E. B. & Geldzahler, B. J. 1997, ApJ, 484, L55
- Bradt & McClintock (1983) Bradt, H. V. & McClintock, J. E. 1983, ARAA, 21, 63
- (4) Cardelli, J. A., Clayton, G. C., & Mathis, J. S. 1989, ApJ, 345, 245
- (5) Catura, R. C. 1983, ApJ, 275, 645
- (6) Christian, D. J., & Swank, J. H. 1997, ApJS, 109, 177
- (7) Cowley, A. P., Crampton, D. & Hutchings, J. B. 1979, ApJ, 231, 539
- (8) Cowley, A. P., Hutchings, J. B., & Crampton, D. 1988, ApJ, 333, 906
- (9) Davidsen, A., Malina, R., & Bowyer, S. 1976, ApJ, 203, 448
- (10) Deutsch, E. W. 1999, AJ, submitted
- (11) Deutsch, E. W., Margon, B., Wachter, S. & Anderson, S. F. 1996, ApJ, 471, 979
- (12) Friedman, H., Byram, E. T., & Chubb, T. A. 1967, Science, 156, 374
- (13) Grindlay, J. E., & Seaquist, E. R. 1986, ApJ, 310, 172
- (14) Gunn, J. E., & Stryker, L. L. 1983, ApJS, 52, 121
- (15) Hjellming, R. M. 1978, ApJ, 221, 225
- (16) Imamura, J. N., Steinman-Cameron, T. Y., & Middleditch, J. 1987, ApJ, 320, L41
- Krist (1993) Krist, J. 1993, in ASP Conf. Ser. 52, Astronomical Data Analysis Software and Systems II, ed. R. J. Hanisch, R. J. V. Bissenden, & J. Barnes (San Francisco: ASP), 530
- Landsman (1993) Landsman, W. B. 1993, in ASP Conf. Ser. 52, Astronomical Data Analysis Software and Systems II, ed. R. J. Hanisch, R. J. V. Bissenden, & J. Barnes (San Francisco: ASP), 256
- (19) Margon, B. 1978, ApJ, 219, 613
- (20) McClintock, J. E. Petro, L. D., Hammerschlag-Hensberge, G., Proffitt, C. R. & Remillard, R. A. 1984, ApJ, 283, 794
- (21) Monet et al. 1998, USNO-A2.0: A Catalog of Astrometric Standards, U.S. Naval Observatory
- (22) Naylor, T., Charles, P. A., & Longmore, A. J. 1991 MNRAS, 252, 203
- (23) Orosz, J. E. & Kuulkers, E. 1999, MNRAS, in press (preprint astro-ph/9901177)
- (24) Penninx, W. 1989, in Proc. 23rd ESLAB Symposium, Two Topics in X-Ray Astronomy, Volume 1: X Ray Binaries, ed. J. Hunt & B. Battrick, ESA SP-296, 185
- (25) Penninx, W., Lewin, W. H. G., Zijlstra, A. A., Mitsuda, K., van Paradijs, J., & van der Klis, M. 1988, Nature, 336, 146
- (26) Sztajno, M., van Paradijs, J., Lewin, W. H. G., Langmeier, A., Trümper, J., & Pietsch, W. 1986, MNRAS, 222, 499
- (27) Tarenghi, M. & Reina, C. 1972, Nat. Phys. Sci. 240, 53
- (28) van Paradijs, J. 1995, in X-Ray Binaries, ed. W. H. G. Lewin, J. van Paradijs, & E. P. J. van den Heuvel (Cambridge: Cambridge Univ.), 536
- (29) van Paradijs, J., & McClintock, J. E. 1995, in X-Ray Binaries, ed. W. H. G. Lewin, J. van Paradijs, & E. P. J. van den Heuvel (Cambridge: Cambridge Univ.), 58
- (30) Wachter, S. 1998, PhD. thesis, Univ. of Washington
- (31) Wachter, S. & Hoard, D. W. 1999, in preparation
| Observation | Array | Flux Density | |||
|---|---|---|---|---|---|
| Date | Config | (cm) | (mJy) | B | B |
| 1989 Mar 31 | B | 3.6 | 18 13 10.922 (0.002) | 03 14.47 (0.03) | |
| 1989 Mar 31 | B | 6 | 18 13 10.919 (0.004) | 03 14.45 (0.06) | |
| 1989 Mar 31 | B | 20 | |||
| 1988 Apr 05 | C | 2 | 18 13 10.921 (0.003) | 03 14.42 (0.05) | |
| 1982 Jun 21 bb Rereduction with modern calibration of the data reported by Grindlay & Seaquist (1986). | A | 6 | |||
| 1982 Feb 21 bb Rereduction with modern calibration of the data reported by Grindlay & Seaquist (1986). | A | 6 | 18 13 10.931 (0.004) | 03 14.52 (0.07) | |
| 1981 Mar 19 | A | 6 | 18 13 10.929 (0.003) | 03 14.47 (0.05) |
| aa offset from weighted, preferred radio position | aa offset from weighted, preferred radio position | R aa offset from weighted, preferred radio position | ||||||
|---|---|---|---|---|---|---|---|---|
| Object | Observation | J | J | |||||
| GX 17+2 | VLA 2-6 cm | 18 16 1.389 | 02 10.62 | 0.06 | 0.04 | ……. | ……. | ……. |
| GX 17+2 | Einstein X-ray | 18 16 1.25 | 02 10.9 | 2.8 | 2.8 | |||
| NP Ser | USNO-A2.0 | 18 16 1.356 | 02 11.06 | 0.18 | 0.18 | 0.65 | ||
| NP Ser | R-band CCD | 18 16 1.380 | 02 11.34 | 0.25 | 0.25 | 0.73 | ||
| NP Ser | WFPC2 F675W | 18 16 1.373 | 02 11.32 | 0.25 | 0.25 | 0.74 | ||
| NP Ser | NICMOS F160W | 18 16 1.373 | 02 11.32 | 0.25 | 0.25 | 0.74 | ||
| Star A | NICMOS F160W | 18 16 1.373 | 02 10.38 | 0.25 | 0.25 | 0.33 | ||
| Star B | NICMOS F160W | 18 16 1.406 | 02 10.32 | 0.25 | 0.25 | 0.39 |
| Object | E() | d (kpc) | Ref. | ||
|---|---|---|---|---|---|
| Sco X–1 | 11.3 | 0.3 | 2.0 | 1,2,3 | |
| GX 349+2 | 14.7 | 1.4 | 9.0 | 1,4,5 | |
| Cyg X–2 | 13.4aaThe mass donor probably contributes a substantial fraction of the IR brightness | 0.4 | 8.0 | 1,6,7,8 |
References. — 1. Wachter (1998), 2. Bandyopadhyay et al. (1999), 3. Bradshaw et al. (1997), 4. Wachter & Hoard (1999) 5. Penninx (1989), 6. McClintock et al. (1984), 7. Orosz & Kuulkers (1999), 8. Cowley et al. (1979)