Dating Starburst and Post-Starburst Galaxies
Abstract
Stellar population models to predict the H Balmer and HeI lines in absorption are presented. Models are computed for burst and continuous star formation. It is found that the Balmer and HeI line profiles are sensitive to the age, except during the first 4 Myr of the evolution, when the equivalent widths of these lines are constant. The comparison of these lines with the corresponding nebular emission lines indicates that H and the higher-order terms of the Balmer series and HeI (3819, 4026, 4388 and 4922) in absorption are very good age-indicators of starbursts. Models are applied to date the super-star cluster B in NGC 1569.
1 Introduction
The techniques to date starbursts are based on their radiative properties which are determined by their massive stellar content. At ultraviolet wavelengths, the spectrum is dominated by absorption features many of them formed in the stellar wind of massive stars. The profiles of these lines are a function of the evolutionary state of the starburst (Leitherer, Robert, & Heckman, 1995; González Delgado, Leitherer, & Heckman, 1997a). This technique has been successfully applied to age-date young starbursts (10 Myr) (see Leitherer and Robert in this conference). The optical spectrum of starbursts is dominated by nebular emission lines formed in the surrounding interstellar medium of the starburst that is photoionized by radiation from the massive stars. This emission-line spectrum depends on the density and chemical composition of the gas, and on the radiation field from the ionizing stellar cluster; therefore, on the evolutionary state of the starburst (García-Vargas, Bressan & Díaz 1995). A test of consistency between these two techniques was performed in the prototypical starburst galaxy NGC 7714 (González Delgado et al 1999). The age of the nuclear starburst derived from the wind resonance ultraviolet lines and the optical emission-line spectrum is 5 Myr old.
At the Balmer jump the spectra of starbursts can also show absorption features formed in the photospheres of O, B and A stars. The spectra of these stars are characterized by strong H and HeI absorption lines and with only very weak metallic lines. However, the detection of these stellar features at the optical wavelengths in the spectra of starburst galaxies is difficult because H and HeI absorption features are coincident with the nebular emission lines that mask the absorption. Even so, the higher-order terms of the Balmer series and some of the HeI lines are detected in absorption in many starburst galaxies or even in the spectra of giant HII regions (e.g. NGC 604, Terlevich et al 1996). These features can be seen in absorption because the strength of the Balmer series in emission decreases rapidly with decreasing wavelength, whereas the equivalent width of the stellar absorption lines is constant with wavelength. Since the strength of the Balmer and HeI absorption lines show a strong deppendency with the effective temperature and gravity, these lines are also an age indicator of starburst and post-starburst galaxies (Díaz 1988; Olofsson 1995).
In this contribution, evolutionary synthesis models are presented, to predict the profile of the H Balmer and HeI absorption lines of a single-metallicity stellar population up to 1 Gyr old. Models are used to predict the age of a super-star cluster in the starburst galaxy NGC 1569.
2 Description of the models
A stellar library of synthetic spectra which covers the main H Balmer (H, H, H, H8, H9, H10, H11, H12 and H13) and HeI absorption lines (HeI 4922, HeI 4471, HeI 4388, HeI 4144, HeI 4121, HeI 4026, HeI 4009 and HeI 3819) has been implemented in the evolutionary synthesis code Starburst99 (Leitherer et al 1999). Evolutionary models are computed for burst and continuous star formation up to 1 Gyr old and different assumptions about the stellar initial mass function. The stellar library is generated using a set of programs developed by Hubeny and colaborators (Hubeny 1988; Hubeny, Lanz & Jeffery, 1995) in three stages. For T 25000 K, the code TLUSTY is used to compute NLTE stellar atmosphere models. These models together with Kurucz (1993) LTE stellar atmosphere models (for T 25000 K) are used as input to SYNSPEC, the program that solves the radiative transfer equation. Finally, the synthetic spectrum is obtained after performing the rotational (100 km s-1 is assumed) and instrumental convolution. The final sampling of the spectra is 0.3 Å. The metallicity is solar.
3 Models results
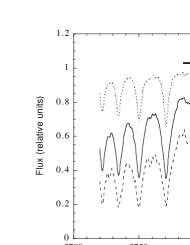
The Balmer and HeI line profiles are sensitive to the age (Figure 1), except during the first 4 Myr of the evolution, when the equivalent widths of these lines are constant. The equivalent widths of the Balmer lines range from 2 to 16 Å and the HeI lines from 0.2 to 1.2 Å.The strength of the lines is maximum when the cluster is a few hundred (for the Balmer lines) and a few ten (for the HeI lines) Myr old. In the continuous star formation scenario, the strength of the Balmer and HeI lines increases monotonically with time until 500 Myr and 100 Myr, respectively. However, the lines are weaker than in the burst models due to the dilution of the Balmer and HeI lines by the contribution from very massive stars.
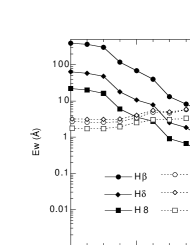
As anticipated, the higher-terms of the Balmer series have equivalent widths similar to H; therefore, this suggests that the higher-terms of the Balmer series are more useful to age-date starbursts than H. To show which lines are better age indicators, the equivalent widths of the Balmer and HeI lines in emission are estimated. Photoionization models using CLOUDY (Ferland 1997) are computed to predict HeI 4471/H assuming that the gas is spherically distributed around the ionizing cluster with a constant electron density. Figure 2 shows that H and the higher-order terms of the Balmer series and HeI are dominated by the stellar absorption component if an instantaneous burst is older than 5 Myr. If the star formation proceeds continuously, after 30 Myr and 100 Myr, the strengths of the stellar absorptions are equal to those of the nebular emission lines H8 and H, respectively. HeI 4471 is very little affected by the absorption; however, the equivalent width of the emission line HeI 3819 equals the stellar absorption line equivalent width at 20 Myr of continuous star formation, and after this time HeI 3819 is dominated by the stellar absorption.
4 Dating a super-star cluster in NGC 1569
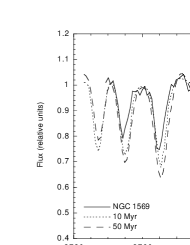
HST images of the starburst galaxy NGC 1569 suggest that the SSC B has an age of 15-300 Myr (O’Connell et al 1994) and ground-based optical spectra suggest an age of 10 Myr (González Delgado et al 1997). The later result is based on the analysis of the optical spectral energy distribution. Since the Balmer lines are partially filled with nebular emission, the fitting has to be done based on the wings of the absorption features. Figure 3 plots the observed lines and the synthetic models for a burst of 10 and 50 Myr at Z/4 metallicity (assuming Salpeter IMF, Mlow=1 M and Mup=80 M). The profiles indicate that the Balmer lines are more compatible with a burst of 10 Myr old than with the 50 Myr old. Ages older than 10 Myr produce profiles which are wider than the observed one. This comparison shows that this technique can discriminate well between a young and an intermediate age population.
References
- [1]
- [2] íaz, A.I. 1988, MNRAS, 231, 57
- [3]
- [4] erland, G.J. 1997, Hazy, a Brief Introduction to CLOUDY, University of Kentucky, Deparment of Physiscs and Astronomy Internal Report
- [5]
- [6] arcía-Vargas, M.L., Bressan, A. & Díaz, A. 1995, A&AS, 112, 35
- [7]
- [8] onzález Delgado, R.M., et al. 1999, ApJ, 513, 707
- [9]
- [10] onzález Delgado, R.M., Leitherer, C., & Heckman, T. 1997a, ApJ, 489, 601
- [11]
- [12] onzález Delgado, R.M., et al.. 1997b, ApJ, 483, 705
- [13]
- [14] ubeny, I. 1988, Compt. Phys. Commmm., 52, 103
- [15]
- [16] ubeny, I., Lanz, T.,& Jeffery, C.S. 1995, SYNSPEC-A User’s Guide
- [17]
- [18] urucz, R.L. 1993, CD-ROM 13, ATLAS9 Stellar Atmosphere Programs and 2 km/s Grid (Cambridge: Smithsoniam Astrophys. Obs.)
- [19]
- [20] eitherer, C., Robert, C., & Heckman, T. M. 1995, ApJS, 99, 173
- [21]
- [22] eitherer, C., et al. 1999, APJS, in press
- [23]
- [24] ’Connell, R., Gallagher, J., & Hunter, D. 1994, ApJ, 433, 65
- [25]
- [26] lofsson, K. 1995, A&A, 111, 57
- [27]
- [28] erlevich, E, et al. 1996, MNRAS, 279, 1219
- [29]