Optical Counterparts to Galaxies in the Cen A Group Discovered by HIPASS
Abstract
We have completed a 21-cm survey of a 600 square degree region of the Centaurus A group of galaxies at a redshift of 500 km as part of a larger survey of the entire southern sky. This group of galaxies was recently the subject of a separate and thorough optical survey (Côté et al. 1997), and thus presented an ideal comparison for us to test the survey performance. We have identified 10 new group members to add to the 21 already known in our survey area. Six of the new members are previously uncatalogued galaxies, while four were catalogued but assumed not to be group members. Including the 7 known members outside of our survey area, this brings the total known number of Cen A members to 38. All of the new Hi detections have optical counterparts, most being intrinsically very faint (M -13.0), late-type low surface brightness dwarfs. Most of the new members have Hi masses only a few times our survey limit of 107 M⊙ at an assumed distance for the group of 3.5 Mpc, and are extremely gas-rich, with a median MHI/L 1. Our limiting Hi sensitivity was actually slightly worse than the Hi follow-up observations of the Côté et al. optical survey, yet we have already increased the known number of group members by 50% using an Hi survey technique. While we have increased the known number of members by 50%, these new members contribute 4% to its light.
1 Department of Physics and Astronomy, The Johns Hopkins University, Bloomberg Center, Baltimore, MD, 21218-2695, USA
pmk@pha.jhu.edu
2 Visiting Astronomer, Cerro Tololo Inter-American Observatory, operated by AURA, Inc. under contract to the National Science Foundation.
Keywords: galaxies: general - galaxies: luminosity function, mass function - galaxies: statistics
1 Introduction
Most galaxies are thought to live in physical groups with a few to perhaps one hundred gravitationally bound members. Typically, these groups of galaxies are dominated by one to a few massive spirals and/or ellipticals which are surrounded by less massive “dwarfs”. Indeed, our own Local Group is now thought to contain 38 members, and is dominated by the Milky Way and M 31 (Mateo 1998) both in terms of mass and luminosity. Yet only 10% of the Local Group by number have . The clues to the formation and evolution of the Local Group - including the Milky Way - are closely tied to understanding the dwarf galaxy population. Furthermore, understanding where the Local Group fits in the formation and evolution of the universe requires determining if the Local Group is truly an “average” group of galaxies. Does 90% of the population of most groups galaxies have ? What fraction of the dwarf population is due to dwarf ellipticals and spheroidals (dE/dSphs), and what fraction is due to dwarf irregulars and dwarf spirals (dIrr/dSps)? Is there an environmental difference in this fraction depending on the morphological type of the gravitationally dominant members, or perhaps the depth of the potential well? Are most groups of galaxies truly bound systems? Are they typically in virial equilibrium? Answers to all of these questions depend on determining the complete membership of individual groups, which implies both needing to identify the members (many of which may be intrinsically quite faint) and determining their distance.
One of the nearest group of galaxies is the Centaurus A group (Cen A group). This group of galaxies not only contains NGC 5128 (Centaurus A), the nearest known radio galaxy, but according to de Vaucouleurs (1979), it has the largest spread of morphological types of any nearby group of galaxies. All of the most luminous members appear disturbed, leading Graham (1979) and van Gorkom et al. (1990) to suggest that perhaps this group has recently accreted a population of gas-rich dwarfs. Côté et al. (1997) recently completed a study of this group. They optically searched for potential members using the SRC survey films, then confirmed membership by follow-up H and Hi observations. They searched over a total area of approximately 900 square degrees, and in all, identified 27 group members. An additional member was discovered by Matthews & Gallagher (1996), bringing the total number of accepted members to 28 prior to the current study.
Given the recent, thorough, optically based study of the Cen A group, along with its intrinsic scientific interest, the Cen A group was selected as an ideal location to begin the Hi Parkes All Sky Survey (HiPASS), now being conducted on the CSIRO Parkes 64 m radio telescope in Parkes, Australia. The assumed distance of the Cen A group (3.5 Mpc, based on Cepheid distances for group members NGC 5253, Sandage et al. 1994, and NGC 5128, Hui et al. 1993) is such that HiPASS should detect galaxies with Hi masses of M⊙, which compares very favorably with the limiting sensitivity of the Hi follow-up studies of Côté et al. (1997). How does the population of group members identified via an Hi search compare with the population identified through a deep optical search? Of the 28 identified Cen A group members, 21 lie within the 600 square degrees of this initial HiPASS survey, where the boundaries were selected to fit in with the scanning grid of the larger HiPASS survey. The Côté survey region was 12h 30m 15h; -20 -50∘. This extends further north than the HiPASS region discussed here. A complete discussion of the Hi properties of detected members of the Cen A group will be presented in a separate paper (Banks et al. 1999). Here we concentrate on the first results of the optical follow-up of the HiPASS observations.
2 Observations
2.1 Hi Observations
The HiPASS, as mentioned above, is being conducted on the 64 m radio telescope at Parkes, Australia. It uses the Multibeam system, which comprises 13 separate beams (26 receivers). This system surveys 1024 velocity channels simultaneously as the telescope is scanned across the sky in declination at a rate of 1 degree/minute. For HiPASS the velocity coverage is -1200 to 12700 km . Scans are stored every 5 seconds, and the average system temperature is 23 K. In order to allow for rejection of time-dependent interference, the scanning pattern has been designed such that every source passes through several beams during a scan, and through several different scans separated by days or weeks of time. The effective total integration time per beam is 450 seconds, and the 5 sensitivity is measured to be 70 mJy/channel/beam.
The channel spacing is 13.2 km per channel, but the spectra are smoothed on-line using a 25% Tukey filter, to reduce “ringing” caused by the strong Galactic signal entering through spectral sidelobes. This causes a loss in velocity resolution of 37%. Consequently velocity resolution is 18.2 km , or 35 km after Hanning smoothing. The on-line data reduction, including the bandpass correction, is described in Barnes et al. (1998), while the whole Multibeam system is described in Staveley-Smith et al. (1996). HiPASS started early in 1997, and the southern sky should be complete within 3 years.
Data cubes are generated from the observations by gridding the individual spectra with 4 pixels. A by-eye search of velocity space from 0 to 1000 km resulted in many detections below 200 km , most of which were assumed to be due to high velocity clouds within our own Galaxy (Wakker 1991). Thus we chose not to include those detections, with the exception of one source at v km , which has previously been identified as a member of the Cen A group (CEN 5, Côté et al. 1997). Including CEN 5, 28 clear detections were found in the search, of which 18 were previously known members. The three known members within our search area which were not detected by HiPASS are Centaurus A itself, which is strongly self-absorbing at 21 cm, and NGC 5206 and ESO 272-G025, neither of which were detected in Hi by Côté et al. (1997) at a limit of M⊙. Thus we have recovered all of the known members with Hi masses above our sensitivity limit, and in addition we have identified 10 new candidate group members.
The new candidate members of the Cen A group are found scattered through the known distribution of velocities for the group, as can be seen in Figure 1. For this figure, we have corrected the velocities of the galaxies to their velocity with respect to the Local Group, vLG, following the prescription of Yahil et al. (1977). The filled squares represent previously identified galaxies within the HiPASS survey area, the stars represent previously identified galaxies outside the HiPASS survey area, and the open triangles represent new candidate group members identified through the HiPASS survey. The lack of new group members north of is artifical, since that region was not included within the original 600 square degrees surveyed in this study. The apparent cutoff in velocity at v km s-1, however, appears real. Scanning the data cubes to v km should detect systems with v km in the direction of the Cen A group. All of the newly detected galaxies had Hi masses several times higher than the nominal sensitivity limit of the HiPASS survey, thus it is unlikely that candidate members were missed at higher velocities because their Hi masses fell below the sensitivity limit due to their presumably being slightly farther away.

2.2 Optical Observations
and images were obtained of most of the candidate group members without previous photometry using either the 40-inch Swope telescope at Las Campanas Observatory (LCO) in Chile or the 40-inch telescope at Siding Springs Observatory (SSO) in Australia. The two primary observing runs were at LCO on 10–16 April 1997 and on 23–28 July 1997. Those galaxies observed in non-photometric conditions were calibrated with observations at SSO during January and April 1998, with a few additional calibrations using the Curtis Schmidt telescope at CTIO in April 1998. A chip was used, except during the January 1998 run at SSO, when a chip was used. For the two primary observing runs, the Tek#1 CCD chip was used, which is a thinned, blue-sensitive CCD. The field of view was 24′ with the chip mounted at f7.5, and pixel size was 0.7. Typical total integrations times are 3600 seconds in , and 1800 seconds in . Only the images have been used for the following analysis. For the galaxy HiPASS 1337-39, the blue magnitude has been estimated from the Digitized Sky Survey, and should be considered to be very uncertain.
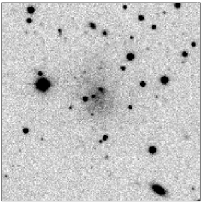
Data processing proceeded in the usual manner. The data were overscan-subtracted, and then bias subtracted using a median filtered bias from each night. Primary flat fielding was done using sky flats obtained each evening. Several Landolt standard fields (Landolt 1992) were observed each night in the broadband filters. The atmospheric extinction was determined using the Landolt standards and found to be similar to the standard CTIO extinction coefficients. Figure 2 shows an example of the final image of one of the newly identified galaxies, HiPASS1321-31.
Optical counterparts were identified for all of the new Cen A group members detected by HiPASS.
3 Discussion
The galaxy presented in Figure 2, HiPASS1321-31, is typical of the dwarfs which were discovered through the HiPASS. In general these dwarfs are very low surface brightness ( mag arcsec-2 in for HiPASS1321-31), with “by-eye” diameters of order 30′′, which corresponds to 0.5 kpc at the distance on the Cen A group. This is comparable to the values found for Local Group dwarf galaxies, which have diameters between 0.18 and 3 kpc, based on their disk scale lengths (Mateo 1998).
The newly detected dwarfs are also represented by HiPASS1321-31 morphologically. Like HiPASS1321-31, most of the new members appear to be dwarf irregulars. This is not unexpected, as the HiPASS is going to select out galaxies which possess atomic gas, introducing a bias toward late-type systems. A few do have higher surface brightness inner regions, similar to some of the late-type galaxies with surface brightness “steps” discussed by Matthews & Gallagher (1997). Also similar to the Matthews & Gallagher systems, a few appear to have unresolved, point-like nuclei. In this respect, they differ from Local Group dwarfs, where only gas-poor, dwarf spheroidals, have nuclei. Apparently, even these small systems can have multi-component disks and/or a nuclear component, suggesting a complex evolutionary history.
The Cen A group also appears to differ from the Local Group, and other groups of galaxies, in the morphological composition of the group. It has already been noted by de Vaucouleurs (1979) that the Cen A group has the largest morphological variety seen in any nearby group. The dwarf population only has two members which Côté et al. (1997) claim can be classified as early-type dwarfs, NGC 5206 and NGC 5237, based strictly on optical morphology. Although detailed morphological classification has not yet been possible, the optical appearance of all the newly detected dwarfs is consistent with their being late-type dwarfs. Thus, while at least 30% of the Local Group members with M appear to be early-type systems, only 7% of the Cen A group members currently known are early-type, unless the two luminous S0s are included, NGC 5102 and NGC 5128. If the two groups actually have a similar morphological composition, this implies that the Cen A group contains at least 60 members.
In order to study the optical integrated properties of the Cen A group, we present a histogram of the distribution in absolute magnitudes in Figure 3 for the members of the Cen A group within the Survey area (solid line) with photometry, in comparison with a histogram of all known Local Group members (dotted line). We have chosen to display only the Cen A group members within our survey area since the correction for dwarfs outside the survey area is unknown. The absolute magnitudes for the Cen A group members were determined assuming a distance of 3.5 Mpc, and corrected for Galactic extinction. Internal extinction corrections have not been made. The Local Group data are from Mateo (1998), except for M 31, M 33, the LMC, the SMC, which are from de Vaucouleurs et al. (1991), scaled to the distances given in Mateo (1998), and the Milky Way, which is from van den Bergh (1992).

The dearth of galaxies in the Cen A group seen in Figure 3 at M is a selection effect. Most of the Local Group galaxies that are that faint are dwarf spheroidals with no detected Hi gas. The three late-type Local Group members which do have such low luminosities have MHI/LB of 0.2 - 1.4. HiPASS would not detect galaxies that faint unless they had an ratio of MHI/L, while the Côté et al. (1997) study deliberately targeted late-type dwarf galaxies. Furthermore, at the distance of the Cen A group, a M implies an integrated apparent magnitude of m not including Galactic extinction, which is generally significant for this group of galaxies (values for AB range from 0.14 - 2.12, with 1/3 of the galaxies having A. Thus, the determination of membership at the faint end of the luminosity function will have to wait for more sensitive studies. Even though the newly detected galaxies all have M, however, they contribute very little to the integrated blue luminosity of the group. After correcting for Galactic extinction, the new members are found to add % to the total blue luminosity of the group.
Overall, the two groups have similar luminosity distributions, at least to M. This is consistent with the luminosity function being the same in both groups. For the Local Group, Mateo (1998) found the best fitting Schechter (1976) function to have , and M. It is interesting that the luminosity distribution of the two groups is so similar, while the morphological composition is so different. As noted above, for M, about 30% of the Local Group are early-type galaxies, whereas 15% of the Cen A group appear to be early-types, and the percentage is only that high if you include the luminous S0s NGC 5102 and NGC 5128. If the Hi PASS and Côté et al. (1997) survey techniques have truly missed the corresponding early-type, gas poor galaxies in the Cen A group, then the luminosity functions of the two groups may differ significantly. If the luminosity functions are actually the same, then, at least for M, the morphological composition of the two groups differs significantly.
Another way of stating the difference between the two groups is to look at the ratio of gas mass to blue luminosity for the individual members. The ratio of atomic gas mass-to-blue luminosity, MHI/LB, is shown in Figure 4 versus the absolute blue magnitude, MB, for all Cen A group members for which optical photometry was available, and for the Local Group. The Hi mass of NGC 5128 is from Richter et al. (1994). Local Group Hi data are from Mateo (1998), except for M 31, M 33, the LMC, the SMC, and the Milky Way, which are from Lang (1980), scaled to the distances given in Mateo (1998). The error bar shown in the upper right corner of Figure 4 is a representative error bar for the new galaxies identified in this study, assuming a magnitude error of 0.3 mags and an Hi mass error of 50%. This is very likely an overestimate of the errors. The mean MHI/LB for these new galaxies is 2.7, while the median is 1.5. Thus, these galaxies have typical atomic gas to blue light ratios which are 10 times higher than that found in late-type disk galaxies, and which are comparable to the highest values found by Matthews & Gallagher (1997) in their study of extreme late-type galaxies.

From Figure 4 it can be seen that the ratio of gas mass to blue luminosity is similar for the brightest galaxies in both the Cen A group and the Local Group. However, for , a significant number of the galaxies in the Cen A group appear to be gas rich. In fact, more than three times as many galaxies in the Cen A group have MHI/L as in the Local Group. If Cen A has recently acquired a population of dwarfs which have not yet been significantly affected by the group dynamics, as suggested by Graham (1979) and van Gorkom et al. (1990), this might explain the population of extremely gas-rich dwarfs. However, the line-of-sight velocity dispersion of the group is only 135 km within the HiPASS survey region, and only 140 km including all known members. As noted by Côté et al. (1997), while this implies that the Cen A group is not virialized, the velocity dispersion is quite typical of groups of galaxies of this size. It is not obvious, then, that this group of galaxies has accreted a new, gas rich population of dwarfs, while other similar groups of galaxies apparently have not.
4 Conclusions
Our initial survey of 600 square degrees of the Centaurus A group of galaxies in 21-cm has yielded 10 new candidate members, bringing the number of known members within this initial HiPASS survey region to 31, and the total number group members to 38. The new members add 50% to the number of members known, but only 4% to the total luminosity of the group. The new members all have optical counterparts, and most are very faint, late-type, gas-rich low surface brightness dwarfs. Due to our survey technique, and that of the previous survey by Côté et al. (1997), very little is known about the possible early-type (dE/dSph) population of the Cen A group. However, the luminosity distribution of the Cen A galaxies is entirely consistent with the Local Group luminosity distribution to the optical limit of galaxies detected within the Cen A group. While 30% of the Local Group galaxies with M are early-type systems, 15% of the known Cen A galaxies are. If there is a Local Group type population of early-type galaxies, then the luminosity distributions of the two groups may be significantly different.
Acknowledgements
I would like to thank Gareth Banks, Mike Disney, and Robert Minchin for much of the data reduction and analysis that is used in this paper, as well as the entire Multibeam Working Group. This research is based on results for the HiPASS being conducted using the CSIRO Parkes telescope in Parkes, Australia. The Johns Hopkins University has generously supported my frequent observing trips to CTIO. This research has made use of the Digitized Sky Survey, produced at the Space Telescope Science Institute under U.S. Government grant NAG W-216. It has also made use of the NASA/IPAC Extragalactic Database (NED) which is operated by the Jet Propulsion Laboratory, California Institute of Technology, under contract with the National Aeronautics and Space Administration.
References
Banks, G. et al. 1999, ApJ, in press
Barnes, D. G., Staveley-Smith, L., Ye, T. & Oosterloo, T., 1998, in Astronomical Data Analysis Software and Systems VII, eds. R. Albrecht, R.N. Hook& H.A. Bushouse (San Francisco: ASP), 145, 89
Côté, S., Freeman K. C., Carnigan, C., & Quinn, P. 1997, AJ, 114, 1313
de Vaucouleurs, G. 1979, AJ, 84, 1270
de Vaucouleurs, G. et al. 1991, Third Reference Catalogue of Bright Galaxies (New York: Springer)
Graham, J. A. 1979, ApJ, 232, 60
Hui, X. et al. 1993, ApJ, 414, 463
Landolt, A. U. 1992, AJ, 104, 340
Lang, K. R. 1980, Astrophysical Formulae (Berlin: Springer-Verlag)
Mateo, M. L. 1998, ARAA, 36, 435
Matthews, L. & Gallagher, J., 1997, AJ, 114, 1899
Matthews, L. & Gallagher, J., 1996, AJ, 111, 1098
Richter, O.-G., Sackett, P. D., & Sparke, L. S. 1994, AJ, 107, 99
Sandage, A. et al. 1994, ApJ, 425, 14
Schechter, P. 1976, ApJ, 203, 297
Staveley-Smith, L., et al. 1996, PASA, 13, 243
van den Bergh, S. 1992, A&A, 264, 75
van Gorkom, J. H., van der Hulst, J. M., Haschick, A. D., & Tubbs, A. D. 1990, AJ, 99, 1781
Wakker B. 1991, A&AS, 90, 495
Yahil, A., Tammann, G., & Sandage, A. 1977, ApJ, 217, 903