Microjansky sources at 1.4 GHz
Abstract
We present a deep 1.4 GHz survey made with the Australia Telescope Compact Array (ATCA), having a background RMS of Jy near the image phase centre, up to Jy at the edge of a field of view. Over 770 radio sources brighter than Jy have been catalogued in the field. The differential source counts in the deep field provide tentative support for the growing evidence that the microjansky radio population exhibits significantly higher clustering than found at higher flux density cutoffs. The optical identification rate on CCD images is approximately 50% to , and the optical counterparts of the faintest radio sources appear to be mainly single galaxies close to this optical magnitude limit.
keywords:
surveys — radio continuum: galaxies — galaxies: generalSubmitted to ApJ Letters \leftheadHopkins et al. \rightheadMicrojansky sources at 1.4 GHz
and
and
and
1 Introduction
Our understanding of the faintest radio sources has advanced over the last decade through increasingly sensitive radio surveys and through follow-up work at optical and infrared wavelengths. The appearance of a ‘new’ population of radio galaxies at millijansky and sub-millijansky levels, first revealed by the changing slope of the 1.4 GHz radio source count distribution, has been confirmed by spectroscopic and multicolour studies ([Windhorst et al. 1985, Thuan & Condon 1987, Benn et al. 1993, Windhorst et al. 1994, Hammer et al. 1995, Hopkins et al. 1998, Richards et al. 1998]). The population comprises star forming galaxies whose numbers increasingly dominate classical (AGN-powered) radio sources as the flux density limit falls below 1 mJy. The evolution of these galaxies, and the role of interactions and mergers in the population, are only partially understood.
The number of catalogued microjansky radio sources at 5 and 8 GHz is a few hundred, and at 1.4 GHz there are few catalogued sources fainter than Jy. The Phoenix Deep Survey (PDS) aims to increase the number of known 1.4 GHz sources fainter than Jy. The PDS covers a 2\arcdeg diameter field selected to lie in a region of low optical obscuration and devoid of bright radio sources ([Hopkins et al. 1998]). The PDS provides a large, homogeneous sample of 1.4 GHz sources which, through multiwavelength observations, is being used to investigate starburst and post-starburst galaxies in the the faint radio population ([Hopkins et al. 1997, Hopkins et al. 1998, Cram et al. 1998, Hopkins et al. 1999, Georgakakis et al. 1999, Mobasher et al. 1999]). We present here the source counts and optical identifications in a Phoenix mosaic image which contains many sources fainter than Jy.
2 Observations, data reduction and imaging
Earlier radio observations of the PDS at 1.4 GHz provided images with a sensitivity of Jy over the 2\arcdeg Phoenix Deep Field (PDF), and Jy in a sub-region of diameter, referred to as the Phoenix Deep Field Sub-region (PDFS) ([Hopkins et al. 1998]). Additional observations were made in 1997 November and December, using the ATCA-6C configuration in mosaic mode with 32 channel, 128 MHz bands centred at 1.380 GHz and 1.472 GHz. The mosaic has seven pointings, six arranged hexagonally around a pointing centred on the PDFS [, ]. A integration of 122 hours was spent on the mosaic. The primary calibrator was B1934-638. The phase calibrator, B0153-410, was observed for ten minutes every hour. An additional 42 hours of data obtained in 1994 September on the central PDFS pointing were included in the imaging.
The miriad (Multichannel Image Reconstruction, Image Analysis and Display) data analysis package was used to edit and calibrate the data, as with previous PDS observations ([Hopkins et al. 1998]). An artifact at the phase centre of earlier PDS images due to self-interference from the sampler clocks is no longer present.
An imaging cell of arcsec2 per pixel was used, providing at least 3 pixels across the shortest FWHM of the synthesised beam. Naturally and uniformly weighted images were produced. The RMS noise in the naturally weighted image is lower, but the synthesised beam larger ( compared with for uniform weighting). Sources have been detected in the naturally weighted image, and individual sources (when detected) have been investigated using the uniformly weighted image.
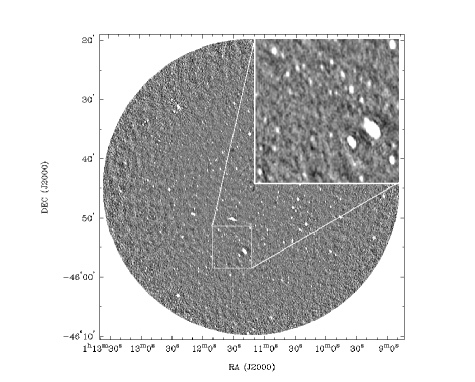
Mosaic components at each pointing were made 2100 pixels () square, to allow correct cleaning of the sidelobes of out-of-field sources. Although the PDF and PDFS fields were chosen to avoid bright sources, the two westernmost pointings were affected by the sidelobes of a strong source outside the field. These were removed by imaging, modelling and removing this source (using the miriad task uvmod) when constructing the images for those pointings. The images for each pointing were cleaned individually, in each case reaching the thermal noise, before being combined to form the final mosaic. The central 50′ diameter of the mosaic is shown in Figure 1.
Because the final image is a mosaic in which the individual pointings have different integration times, spatial overlap, and primary beam attenuation, the distribution of noise in the image is not uniform. The RMS noise is a minimum at the centre (Jy) rising uniformly to Jy at a radius of . The RMS noise at the centre is a factor of 2.5 lower than the previous PDFS image ([Hopkins et al. 1998]), consistent with the 4-fold increase in integration time and the absence of the phase-centre artifact present in the earlier observations. The dynamic range of the image can be described in two ways: the brightest source (in the NE, 22.7 mJy) lies more than a factor of 100 above the RMS noise of its surrounds, while the ratio of the flux densities of the brightest and faintest reliably detected sources exceeds 500:1.
3 Radio and optical sources
3.1 1.4 GHz sources
The mosaic achieves wide-field coverage and good sensitivity at the price of having an unavoidably non-uniform noise distribution. The detection and statistical characterisation of sources is thus a more complex procedure than it is in single-pointing interferometer images. An important auxiliary in this process is the noise image, in which each pixel is assigned a value equal to the theoretical noise level accounting for the observing time, mosaic overlap and primary beam attenuation. The miriad task sfind ([Hopkins et al. 1998]) was used to compile a list of sources which have a peak flux density greater than 4 times the value in the noise image at the same position, lying in the central diameter disk of the mosaic. This disk is the area bounded by the Jy () contour. Over 770 sources within this region having a peak flux density brighter than the local value of survive visual inspection in the interactive confirmation phase of sfind. There is some deviation from Gaussian statistics in the distribution of negative pixel values (% of pixels lie in a non-Gaussian tail associated with visible sidelobes and the edges of the image) which evidently exists in the positive pixel values as well, albeit masked by true sources. However, the procedure we have adopted provides a very robust estimate of the noise level above which we claim detections, and excludes essentially all spurious positive candidates.
The construction of the source count distribution takes account of two significant corrections (c.f. [Hopkins et al. 1998]). First, the use of a peak detection algorithm to locate sources will underestimate the total number of sources to a given total flux density. A correction based on the statistical distribution of source sizes has been applied. Secondly, it is necessary to correct the raw counts at any noise level for the fraction of the total area over which such sources could be detected above . Figure 2 illustrates the magnitude of this latter correction, while Figure 3 shows the corrected counts.
Questions of sensitivity, completeness, spurious sources, and source confusion are important in a survey exploited close to its limit, but are somewhat difficult to answer in view of the non-uniform noise properties of the mosaiced images and the fact that some but not all of the sources are resolved. The observed field contains approximately independent beam areas and some 750 sources, resulting in over 100 beam areas per source except in the few small regions of highest source density within the highest sensitivity area (only a few percent of the field). Hence we have not quite reached the sensitivity and source density at which confusion would become a serious problem. We have established that there are only a few deviations from a Gaussian distribution in the negative pixels, due to fluctuations similar to those edited out in sfind. We thus expect approximately 10 spurious sources due to noise statistics with our peak flux cut-off. The catalogue completeness can be described in terms of the factors required to correct for the primary beam weighting and the presence of resolved sources ([Hopkins et al. 1998]). The survey has 50% completeness at that peak flux density which requires a factor of 2 correction for these effects. The peak flux density of the 50% completeness limit varies with radial position, . It is Jy for ; Jy for ; and Jy for . The faintest catalogued source has an integrated flux density of Jy.
3.2 Optical counterparts
The optical catalogue is derived from Anglo-Australian Telescope (AAT) prime-focus CCD observations made in the Johnson-Kron-Cousins -band ([Georgakakis et al. 1999]). The most probable optical candidate (where one exists) is chosen by searching a radius of , and selecting the source with the least probability of being an accidental alignment (given the known surface density of sources as bright or brighter than the candidate) provided that that probability %. While some true associations may be missed by this method it minimises spurious associations. Of the 773 detected radio sources, 52% have been optically identified. As explained by [Georgakakis et al. 1999] the 50% completeness limit of the optical survey is although sources fainter than this have been reliably detected and are included in the analysis.
Figure 4 presents histograms of the distribution of apparent -band magnitude as a function of the radio source flux density. The median optical magnitude () of the detected optical counterparts falls with decreasing radio flux density. The magnitude bounding the first decile () also decreases to fainter optical magnitudes as the radio brightness declines. The fraction of sources in each flux density bin with identified optical counterparts, , is smaller for the faintest bin, to our fixed limiting optical magnitude.
4 Discussion
Over 50% of the Jy radio sample is optically identified to , with a lower rate (44%) for fainter radio sources. Visual inspection shows that the faint (Jy) sources are mostly identified with single optical galaxies, rather than interacting systems. This may reflect the fact that these identifications are made quite close to the limit of the CCD images, or it may indicate that the very faint radio counterparts to a fixed optical magnitude are located in galaxies different from harbouring slightly brighter sub-mJy radio sources (c.f. [Gruppioni et al. 1997]).
Figure 3 reveals considerable scatter in different determinations of the 1.4 GHz source counts below about 1 mJy. Counts from different surveys fluctuate by amounts large compared with the Poisson errors and with the respective image variances. The effect can be seen between counts in the diameter survey area presented here and those in the entire 2\arcdeg Phoenix field. It seems unlikely that limited dynamic range, sidelobe confusion, or the blending of faint sources to mimic single brighter sources could account for the effect within the Phoenix data set or within the other catalogues.
It is known that large samples of radio sources brighter than mJy at 1.4 GHz show no or weak evidence of clustering (e.g. [Baleisis et al. 1998]). However, fainter samples may have revealed clustering ([Cress et al. 1996]), and it is predicted ([Benn & Wall 1995]) that a diameter survey with Jy might well reveal fluctuations above Poisson statistics. Indeed, Benn & Wall caution that deep radio surveys with pencil beams may not be representative. Since the clustering scale responsible for the observed fluctuations is likely to be , extending the Phoenix survey at its current sensitivity limit to a field of several degrees could provide constraints to large-scale structure on scales intermediate between those probed by microwave background experiments and by optical redshift surveys.
5 Conclusions
A new 1.4 GHz radio survey with the ATCA has been completed as part of the Phoenix Deep Survey. A catalogue of 773 sources with Jy has been compiled. This sample is homogeneously selected and thus uniform across the entire flux density range. The new sample provides an opportunity to investigate a large number of faint radio galaxies through multicolour photometry and spectroscopy.
Statistical fluctuations in observed 1.4 GHz source counts below Jy provide a tantalising hint that very sensitive large area 1.4 GHz surveys may be used to provide constraints to cosmic structure on the scale , intermediate between scales probed by microwave background experiments and by optical redshift surveys.
Acknowledgements.
We thank the ATCA HDF-S team for generously making their 1.4 GHz source count data available. We are grateful to Eric Richards for helpful comments and discussion. JMA gratefully acknowledges support in the form of a scholarship from Fundação para a Ciência e a Tecnologia through Programa Praxis XXI. The Australia Telescope is funded by the Commonwealth of Australia for operation as a National Facility managed by CSIRO.References
- [Baleisis et al. 1998] Baleisis A., Lahav O., Loan A. J., Wall J. V., 1998, MNRAS, 297, 545
- [Benn et al. 1993] Benn C. R., Rowan-Robinson M., McMahon R. G., Broadhurst T. J., Lawrence A., 1993, MNRAS, 263, 98
- [Benn & Wall 1995] Benn C. R., Wall J. V., 1995, MNRAS, 272, 678
- [Cram et al. 1998] Cram L., Hopkins A., Mobasher B., Rowan-Robinson M., 1998, ApJ, 507, 155
- [Cress et al. 1996] Cress C. M., Helfland D. J., Becker R. H., Gregg M. D., White R. L., 1996, ApJ, 473, 7
- [Georgakakis et al. 1999] Georgakakis A., Mobasher B., Cram L., Hopkins A., Lidman C., Rowan-Robinson M., 1999, MNRAS, (in press)
- [Gruppioni et al. 1997] Gruppioni C., Zamorani G., de Ruiter H. R., Parma P., Mignoli M., Lari C., 1997, MNRAS, 286, 470
- [Hammer et al. 1995] Hammer F., Crampton D., Lilly S. J., Le Fèvre O., Kenet T., 1995, MNRAS, 276, 1085
- [Hopkins et al. 1997] Hopkins A. M., 1997, PhD thesis, University of Sydney
- [Hopkins et al. 1998] Hopkins A. M., Mobasher B., Cram L., Rowan-Robinson M., 1998, MNRAS, 296, 839
- [Hopkins et al. 1999] Hopkins A. M., Cram L., Mobasher B., Georgakakis A., 1999, in “Looking Deep in the Southern Sky,” eds R. Morganti & W.J. Couch, (Springer:Berlin) 120
- [Mobasher et al. 1999] Mobasher B., Cram L., Georgakakis A., Hopkins A., 1999, MNRAS, (in press)
- [Norris et al. 1999] Norris R., Hopkins A., Sault R., Ekers R., Ekers J., Badia F., Higdon J., Wieringa M., Boyle B., 1999, (in preparation)
- [Richards et al. 1998] Richards E. A., Kellermann K. I., Fomalont E. B., Windhorst R. A., Partridge R. B., 1998, AJ, 116, 1039
- [Thuan & Condon 1987] Thuan T. X., Condon J. J., 1987, ApJ, 322, L9
- [Windhorst et al. 1985] Windhorst R. A., Miley G. K., Owen F. N., Kron R. G., Koo D. C., 1985, ApJ, 289, 494
- [Windhorst et al. 1993] Windhorst R. A., Fomalont E. B., Partridge R. B., Lowenthal J. D., 1993, ApJ, 405, 498
- [Windhorst et al. 1994] Windhorst R. A., Gordon J. M., Pascarelle S. M., Schmidtke P. C., Keel W. C., Burkey J. M., Dunlop J. S., 1994, ApJ, 435, 577