CLASS B1152+199 and B1359+154: Two New Gravitational Lens Systems Discovered in the Cosmic Lens All-Sky Survey
Abstract
The third phase of the Cosmic Lens All-Sky Survey (CLASS) has recently been completed, bringing the total number of sources imaged to over 15000 in the CLASS and JVAS combined survey. In the VLA observations carried out in March and April of 1998, two new candidate lensed systems were discovered: CLASS B1152+199 and B1359+154. B1152+199 is a double, with a background quasar at lensed by a foreground galaxy at . The relatively flat radio spectra of the lensed images (), combined with a previous ROSAT detection of the source, make B1152+199 a strong candidate for time delay studies at both radio and X-ray wavelengths. B1359+154 is a quadruply lensed quasar at , with a maximum image separation of . As yet, the redshift of the lensing object in this system is undetermined. The steep spectral index of the source () suggests that B1359+154 will not exhibit strong variability, and is therefore unlikely to be useful for determining from measured time delays.
1 Introduction
CLASS, the Cosmic Lens All-Sky Survey, commenced observations in 1994 (Myers et al. 1995), building upon the foundation of JVAS, the Jodrell-VLA Astrometric Survey (Patnaik et al. 1992). In the three observing “seasons” since that time, CLASS has observed over 10000 targets selected as flat-spectrum between 4.8 GHz and 1.4 GHz, bringing the CLASS total (including JVAS) to over 15000 sources. Details of the CLASS survey and statistical sample will be presented in a forthcoming paper (Myers et al. 1999, in preparation). In this paper, we present the discovery of two new lenses from the CLASS-3 observations.
As in the other CLASS papers, we adopt the convention
| (1) |
where is the frequency of observation. Our flat-spectrum sample is defined as those sources with between 4.85 GHz in the improved Green Bank survey (GB6; Gregory et al. 1996) and 1.4 GHz in the NRAO-VLA Sky Survey (NVSS; Condon et al. 1998).
The CLASS-3 observations mainly concentrated on the region from to declination. A lower density of fainter sources filled in gaps in the rest of the CLASS survey area from to declination using the new NVSS selection. With CLASS-3, nearly all GB6 sources 30 mJy or brighter satisfying the spectral selection have been observed, with the exception of a small number () falling in the remaining gaps of NVSS.
2 Observations
The third phase of the survey (CLASS-3) was carried out with the NRAO Very Large Array111The National Radio Astronomy Observatory is operated by Associated Universities, Inc., under cooperative agreement with the National Science Foundation. (VLA) in the A-configuration during March – May 1998. The VLA default X-band IFs were used in CLASS-3: GHz and GHz, with an average frequency of GHz. As in previous CLASS sessions, 30-second integrations were taken on each source, with phase calibrators (selected from JVAS) inserted in the schedule after every 10th CLASS target. On average, 54 CLASS sources were observed per hour. A total of 5096 targets were observed in CLASS-3.
The data reduction pipeline was identical to that used in CLASS-1 and CLASS-2 (eg. Myers et al. 1995). Calibration was performed in AIPS, with mapping automatically carried out in DIFMAP (Shepherd, Pearson & Taylor 1994). At the end of the “automap” procedure, model-fitting was performed by using Gaussian components placed at the positions of the individual small “clean” boxes found in the main search loops. As the goal of CLASS is to search for the lensing of compact radio cores, any sources exhibiting multiple compact model-fit components were identified promptly after sections of the observations had been completed to allow follow-up in later parts of CLASS-3.
The preliminary automap output from CLASS-3 indicated two excellent lens candidates: CLASS B1152+199 and B1359+154. B1152+199 is a double, with two distinct compact components. The map of B1359+154 shows five components, with four compact and one extended in the X-band snapshot. This is believed to be a quadruple lens system where lensing galaxy emission is also seen, making it similar to CLASS B2045+265 (Fassnacht et al. 1998). Follow-up VLA observations of the two candidates at U band ( GHz) were carried out in the April run, confirming the multiplicity, compactness, and identical component spectra expected for the lensing hypothesis.
Analysis and model-fitting with point and Gaussian components was done in DIFMAP. DIFMAP functions by working on the residual “difference map” produced by transforming the residual uv data after subtraction of the current model from the original uv dataset (see Shepherd, Pearson & Taylor 1994 and Shepherd 1997 for more details on DIFMAP). Maps were made using both uniform uv weighting (to get the highest resolution possible, at the cost of noise level) and natural uv weighting (to get the best signal-to-noise ratio possible, at the cost of resolution). Uncertainties in the positions and flux densities were determined using the square-root of the diagonal elements of the covariance matrix that DIFMAP computes during the model-fitting procedure. For the flux densities, this is very nearly identical to the rms in the naturally-weighted residual image, and this is what we present in the tables below. Images were constructed using the residual maps as a noise floor, and then adding the model components convolved with a Gaussian restoring beam of width appropriate to the core of the synthesized (“dirty”) beam for the chosen weighting.
The overall flux density scale used for the X-band observations was based on Jy for J1331+305 (3C286) and Jy for J0137+331 (3C48). This calibration should be good to or better, as estimated from the scatter in VLA calibrator measurements over the time period of CLASS-3 (this information is available from the VLA). In addition to these primary calibrators, we used compact steep-spectrum sources J0713+438 ( Jy) and J1945+709 ( Jy). The gain stability of the VLA at X band is superb, and the internal consistency between the correlator counts per Jansky as determined by these independent sources was better than 2% for the 5 April 1998 data, for example. At U band, however, the flux density scale is more uncertain. We adopted Jy for J1331+305 and as a secondary calibrator assumed Jy for J0713+438. We estimate an overall calibration accuracy of at X band, and at U band, from the scatter in VLA calibrator measurements during the several months of the CLASS-3 observations. In the following discussion of uncertainties, and in the error estimates given in the tables, we do not include these overall scale errors. However, these should be kept in mind, especially in the quoted spectral indices between X band and U band, as the conservative 3% and 5% estimated uncertainties in the X-band and U-band flux densities translate to a spectral index uncertainty of when propagated.
2.1 Optical Follow-Up
Both lens candidates were observed with the Low Resolution Imaging Spectrograph (LRIS; Oke et al. 1995) on the W. M. Keck II Telescope on 1998 April 21. The 15 long-slit and 300 gr/mm grating were used for the observation. The wavelength coverage was 4024Å– 9012Å, with a scale on the detector of 2.44Å/pix. For each lens candidate the long slit position angle was chosen to cover the lensed images and the predicted position of the lensing galaxy. The data were reduced using standard IRAF222IRAF (Image Reduction and Analysis Facility) is distributed by the National Optical Astronomy Observatories, which are operated by the Association of Universities for Research in Astronomy under cooperative agreement with the National Science Foundation. routines. The flat-field frames were constructed from dome flat observations. The sky lines in each spectrum were used to make corrections for flexure in the spectrograph. Observations of the Oke standard star Feige 34 (Oke 1990) were used to determine the response of the detector. The spectra were extracted using the optimal weighting routines in IRAF.
In addition, each candidate was observed with the COSMIC camera on the Palomar 5-m telescope on 1998 May 31. A set of images was taken in the Gunn and filters. The observing conditions were not photometric, with high cirrus present throughout the evening. The average seeing was found to be 11. The standard star Feige 67 was observed to set the magnitude scale. Magnitudes were derived using the IRAF “apphot” package. We estimate errors in calibration of as much as several tenths of a magnitude given the conditions.
3 CLASS B1152+199
CLASS B1152+199 was selected as GB6 J11553+1939 with a 4.85 GHz flux density of 76 mJy. The corresponding 1.4 GHz flux density in the NVSS is 77.4 mJy, and thus the overall two-point spectral index is . The target GB6 J11553+1939 also corresponds to MG2 J115518+1940 (Langston et al. 1990), which is identified with a mag optical object in the Palomar Sky Survey E plates (Brinkmann et al. 1997), consistent with what we find in our follow-up. Note that Brinkmann et al. were observing counterparts to X-ray sources seen in the ROSAT All-Sky Survey, and located a 69 mJy radio source at 4.85 GHz (VLA D configuration 1992) in this location (Laurent-Muehleisen et al. 1997).
Examination of the ROSAT All-Sky Survey catalogue identifies CLASS B1152+199 with RXS J115517.6+193935. Analysis of the ROSAT data gives a (0.5–2 keV) flux density of . ROSAT detection of X-ray emission at this position argues for quasar identification. The bright X-ray emission, combined with the compact flat-spectrum radio structure, strongly suggest that this source will be variable and therefore a good target for both radio and X-ray time delay monitoring.
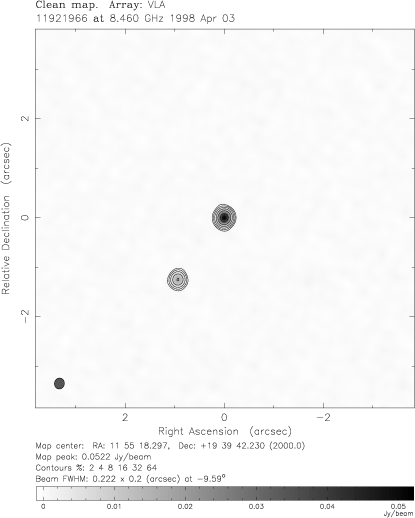
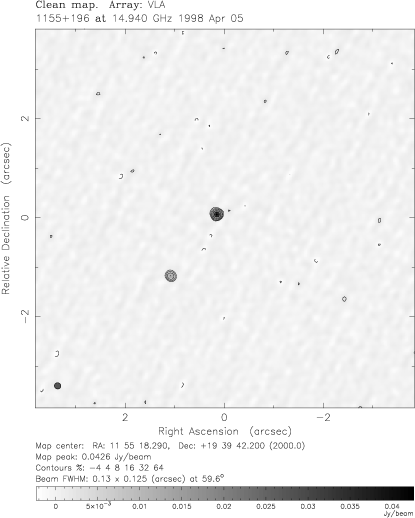
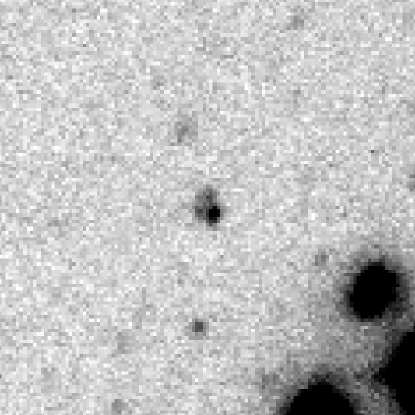
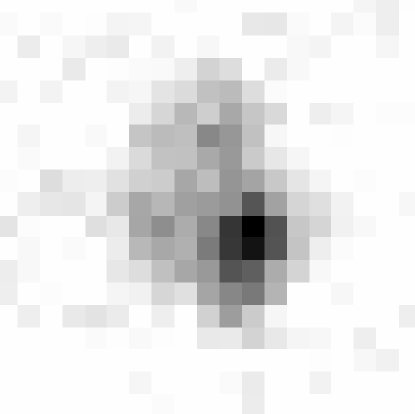
The X-band discovery 30-second snapshot and U-band 5-minute image are shown in Fig. 5. Because this is a relatively bright source, we show the uniformly weighted images, with resolutions of 021 (X band) and 013 (U band). We find two components with a relative separation of and a flux density ratio of 3:1. Further examination reveals a third faint radio source in the field. This object is 23″ from the two compact components, and is probably unrelated (in a lensing sense) to the flat spectrum double. This source is designated as component C in the tables. Positional and flux density data for B1152+199 are listed in Table 1.
The combined flux densities of components A and B in the VLA maps are mJy at GHz, and mJy at GHz. Thus, the overall spectral index between the X and U bands is , slightly steeper than the spectral index found at lower frequencies. Both components A and B are compact in the uniformly weighted X-band and U-band images, and the spectral indices of the components are identical within the uncertainties.
Although the distant component C was extremely faint in the U-band image, model-fitting was able to solve for a component which converged to the same position as in the X-band data. The spectral index of source C between the X band and U band is significantly steeper than that of components A and B, and therefore it is unlikely to be another image. However, it might be the compact hot-spot in a lobe or an altogether unrelated source.
3.1 Optical Follow-up of B1152+199
Spectra of B1152+199 were extracted from two 600-second observations using a single slit position (PA ), with lines from both source and lens seen. Fig. 5 is dominated by light from the background source. Three emission lines from the source are observed: strong broad Mg II 2800Å at 5650Å, [O II] 3727Å at 7526Å, and H at 8760Å. These lines establish the source redshift at . In addition, at the blue end of the spectrum Mg II and Mg I absorption lines associated with the lens are seen. A second spectrum was extracted offset along the slit from the main emission (Fig. 5), and is dominated by light from the lensing galaxy. The features associated with the lens include the Mg I absorption seen in Fig. 5 at 4104Å, [O II] 3727 emission at 5368Å, and Ca II H and K absorption at 5660 and 5706Å. These lines give a consistent lens redshift of . Note that the spectrum around the Ca H and K lines is distorted by the broad Mg II emission line from the source. Several narrow emission lines associated with the background source are also seen in Fig. 5, including Ne V 3346Å at 6756Å, Ne V 3427Å at 6918Å, and the [O II] and H observed in Fig. 5.
The band COSMIC image of B1152+199 is shown in Fig. 5. There is a bright stellar object ( and ) located at the radio position. Presumably, this is the brighter of the two lensed images, with the weaker image significantly attenuated by dust extinction from the lens. Given that the Keck spectrum clearly shows two system redshifts, with the brighter background source spectrum consistent with that of a quasar, it is unlikely that this is simply a chance mis-identification. Improved ground-based imaging or HST observations will be required to clearly sort out the optical properties of this system.
3.2 Preliminary Lens Model for B1152+199
B1152+199 is a two component system, and current imaging data provides only three active constraints on the modeling – two relative coordinates and a flux density ratio. Furthermore, since B1152+199 is flat-spectrum, the true magnification ratio may be masked by variability (though the consistency between the 4.85 GHz flux densities in GB6 and the VLA data of Laurent-Muehleisen et al. argues against strong variability). The modeling of this system will therefore be postponed until additional constraints can be obtained, such as the location of the lensing galaxy relative to the images from optical or infrared observations, or substructure seen in higher resolution radio maps.
4 CLASS B1359+154
CLASS B1359+154 was selected as GB6 J14016+1513, with a flux density of 66 mJy at 4.85 GHz. At 1.4 GHz, the NVSS flux density is 115 mJy, giving an overall low-frequency spectral index of , near the limit of our spectral index cutoff ().
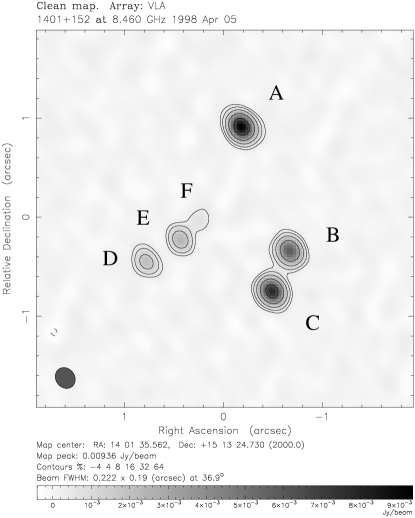
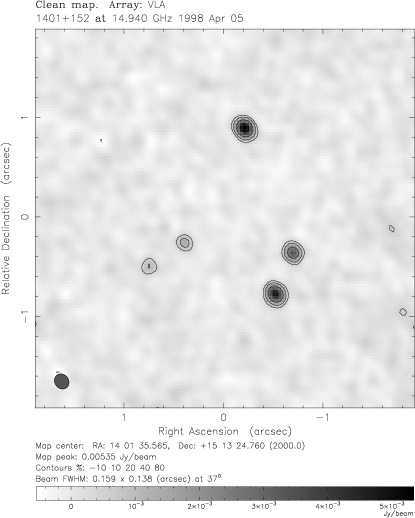
The X-band discovery 30-second snapshot (not shown) was taken on 16 March 1998. Follow-up 5-minute X-band and 10 minute U-band observations were made on 5 April 1998. The deep X-band image is shown in Fig. 5 (a) with uniform weighting to enhance the resolution (). The map of the U-band data shown in Fig. 5 (b) at a resolution of was made using natural weighting to show the fainter components. A total of six components are seen in the deeper X-band image, with an additional component (F) found near the center component (E). This component was later found using model-fitting in the original X-band snapshot, and appears in the tables. We tentatively identify the outer components, labeled A–D clockwise from the brightest (North) component, as the images of a single background source. The two central components, E and F, are both found to be extended in the deep X-band dataset, supporting the hypothesis that these are due to lensing galaxy emission. The positions and flux densities of the B1359+154 radio components are listed in Table 2. Positions were computed without any self-calibration applied to the data, to minimize biases introduced by those steps.
The total flux density of the components in the deep X-band image is mJy, significantly less than the GB6 flux density, possibly indicating the presence of extended emission that is resolved out of the VLA images. For the brightest five components (A–E) detected in both of the 5 April 1998 images, the overall high-frequency spectral index is . Note that the central component E has a spectral index flatter than that of the outer components, also indicating that it is probably associated with the lensing galaxy, rather than being an additional lensed image. Component F is too faint to see in the U-band image (it would be less than if it is as flat-spectrum as E).
As in the case of B1152+199, wide-field images were made of the data to look for companion sources. In the deep X-band image, for example, no sources are found above a flux density of mJy within of the location of B1359+154.
4.1 Optical Follow-up of B1359+154
The spectrum of B1359+154 was extracted from a single 480-second exposure with the slit at PA . This is shown in Fig. 5. Several emission lines are observed with almost no detected continuum. These emission lines can all be identified with a source at redshift . The lines seen are Ly at 5150Å, N V 1240Å at 5252Å, C IV 1549Å at 6556Å, He II 1640Å at 6948Å, and C III 1909Å at 8073Å. No features associated with the lensing galaxy are observed.
A wide-field () Gunn band COSMIC image of B1359+154 is shown in Fig. 5, while a closeup band image is shown in Fig. 5. The quad structure is clearly observed, and agrees well with the orientation seen in the radio images. However, the seeing and image quality are insufficient to separate out the images and possible lensing galaxy emission. This will likely have to await Hubble Space Telescope imaging. The total magnitude of the system (images plus lens emission) is in Gunn and in Gunn .
4.2 Preliminary Lens Model for B1359+154
The modeling of a gravitational lens system with unresolved components is constrained by relative image coordinates and magnification (flux density) ratios. The VLA maps of B1359+154 therefore provide modeling constraints. Image positions and flux densities are taken from the deep X-band data. We assume , km s-1 Mpc-1, and a lens redshift of for all calculations.
Optimization was performed using a pseudo-image plane minimization technique, as described in Kochanek 1991. Once the model has converged, the lens equation is inverted to solve for the true images of the recovered source position. Coordinates are shifted to fix component A at (0,0). A is calculated using the relative positions () and magnification ratios () of the resulting images,
where primed quantities are model-predicted and unprimed quantities are observed. The overall quality of the model is determined by , where NDF is the number of degrees of freedom.
The simplest model consists of a background source being lensed by an isolated foreground galaxy. We therefore attempted to model B1359+154 using a singular isothermal ellipsoid (SIE; Kormann et al. 1994). An SIE model is described by five parameters (the lens plane coordinates, velocity dispersion, axial ratio and position angle), so NDF . Unfortunately, the best possible model using an isolated SIE deflector proves unsatisfactory due to a remarkably poor positional mismatch. Models including external shear of constant magnitude and direction (NDF ) also fail to offer a sufficient fit. We thus conclude that a single galaxy, even in the presence of significant external shear, is unlikely to account for the observed image configuration of B1359+154.
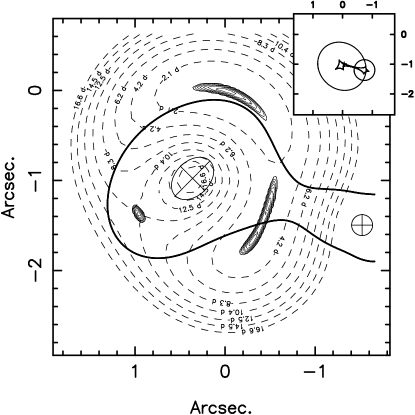
A more advanced model may be constructed by adding a second deflector, parametrized by a singular isothermal sphere (SIS), at the same redshift as the SIE. Since an SIS is described completely by its velocity dispersion and position, NDF for a compound SIE+SIS model. (Note that the coordinates of each deflector are left as free parameters.) Such models provide excellent fits to the image positions, but fail to reproduce the flux density ratios to the accuracy required by the deep X-band dataset. Source variability may however lead to confused estimates of the magnification ratios from a single epoch of radio data. If we artificially set the flux density ratio uncertainties at to account for possible variability, an acceptable fit can be obtained. This procedure is extremely ad hoc, as there is presently no evidence for variability in B1359+154. Moreover, the rather steep spectral indices of the lensed components make it unlikely that the source is strongly variable. We expand the error bars merely to illustrate that B1359+154 can be modeled as a gravitational lens system. The parameters of a possible SIE+SIS model (NDF) are listed in Table 3. Model-predicted image positions, magnification factors and time delays are listed in Table 4. Critical curves and caustics for the model are displayed in Fig. 5. Note that neither the SIE nor SIS coordinate centers can be identified with the extended radio components E and F. Fixing the SIE at either location leads to extremely poor models.
If core radii are fit to each of the deflectors, it is possible to reproduce the flux density ratios to within the true error bars derived from the deep X-band observation. These models are underconstrained (NDF ), however, and we will not discuss them here.
Additional information is clearly required to construct a viable lens model for B1359+154. The above SIE+SIS model is merely a first attempt to describe the system, and will likely be modified as high resolution optical and radio data are obtained. However, we believe that the above exercise has demonstrated two important points. First, B1359+154 may be modeled as a gravitational lens system, though constraints provided by the flux densities must be relaxed to obtain a sufficient fit. Second, the deflector system for this lens is almost certainly compound, as single galaxy models are strongly excluded by our findings. We therefore predict that HST imaging will reveal a second deflector, making B1359+154 similar to CLASS B1608+656 (Koopmans & Fassnacht 1999).
5 Discussion
The source CLASS B1152+199, discovered in the 1998 CLASS-3 observations, is clearly a lens. With two bright compact components exhibiting identical flat radio spectra, it is unlikely that these are two components of the same radio source, and even more unlikely that this is a chance superposition of two unassociated radio galaxies. Furthermore, the optical spectra obtained with the Keck-II LRIS show unambiguous lines from systems at two distinct redshifts. We interpret these as a lensing galaxy at and a background source (presumably a quasar) at .
Although only a single redshift component was identified in the LRIS spectrum of CLASS B1359+154, which we assume is due to the background lensed source at , the unusual morphology exhibited in the radio maps almost certainly points toward a lensing origin. The geometry, compactness and identical spectra of the four outer components is compelling evidence for this hypothesis, while the extended dual central components can be reasonably identified with emission from the lensing galaxy or galaxies. The similarities to the lenses CLASS B1608+656 in configuration (Myers et al. 1995) and CLASS B2045+265 with lens emission (Fassnacht et al. 1999) are striking. Although the optical image does not clearly resolve the structure, it is similar enough to the radio geometry to confirm this system as a gravitational lens. To test this hypothesis, we attempted to model B1359+154 as a gravitational lens system. Though our results are very preliminary, we believe that a single deflector model can be excluded by our findings. A compound SIE+SIS deflector provides an adequate fit if the uncertainties in the flux density ratios are set at to account for possible variability. We therefore predict that better optical and IR images of this field will show a second lensing galaxy. Constraints derived from such images are required to construct a more believable mass model for this system.
If it is indeed a lens, the prospects for using CLASS B1152+199 to measure time delays, and thus the Hubble Constant , are good. It is bright, well separated, and likely to show measurable variability, having a flat spectrum (). The prospects for optical or IR monitoring are poor, due to the lack of a second image in the Palomar data. However, the ROSAT detection of X-ray emission from this source suggests the possibility of monitoring by AXAF.
On the other hand, CLASS B1359+154 is weak, and the steep spectral index ( for the brightest component) makes it unlikely that this source will be strongly variable. However, when combined with the other lenses previously found in the JVAS and CLASS surveys, both these new lens systems will add to the statistical evidence placing limits on the values of cosmological parameters such as the matter density and cosmological constant (eg. Falco et al. 1998).
References
- (1)
- (2) Brinkmann, W., et al. 1997, A&A, 323, 739
- (3)
- (4) Condon, J.J., et al. 1998, AJ, 115, 1693
- (5)
- (6) Falco, E.E., Kochanek, C.S. & Munõz, J.A. 1998, ApJ, 494, 47
- (7)
- (8) Fassnacht, C.D., et al. 1999, AJ, in press
- (9)
- (10) Gregory, P.C., et al. 1996, ApJS, 103, 427
- (11)
- (12) Kochanek, C.S. 1991, ApJ, 373, 354
- (13)
- (14) Koopmans, L. V. E & Fassnacht, C. D. 1999, ApJ, submitted
- (15)
- (16) Kormann, R., Schneider, P. & Bartelmann, M. 1994, A&A, 284, 285
- (17)
- (18) Langston, G.I., et al. 1990, ApJS, 72, 621
- (19)
- (20) Laurent-Muehleisen, S.A., et al. 1997, A&AS, 122, 235
- (21)
- (22) Myers, S.T., et al. 1995, ApJ, 447, L5
- (23)
- (24) Myers, S.T., et al. 1999, AJ, in preparation
- (25)
- (26) Oke, J.B. 1990, AJ, 99, 1621
- (27)
- (28) Oke, J.B., et al. 1995, PASP, 107, 375
- (29)
- (30) Patnaik, A.R., Browne, I.W.A., Wilkinson, P.N. & Wrobel, J.M. 1992, MNRAS, 254, 655
- (31)
- (32) Shepherd, M.C., Pearson, T.J., & Taylor, G.B. 1994, BAAS, 26, 987
- (33)
- (34) Shepherd, M.C. 1997, in Astronomical Data Analysis Software and Systems VI, ed. G. Hunt & H. E. Payne, ASP Conference Series, v125, 77-84
- (35)
| Comp | Offset (E) | Offset (N) | (mJy) | (mJy) | ||
|---|---|---|---|---|---|---|
| A | ||||||
| B | ||||||
| C |
| Comp | Offset (E) | Offset (N) | (mJy) | (mJy) | (mJy) | ||
|---|---|---|---|---|---|---|---|
| A | |||||||
| B | |||||||
| C | |||||||
| D | |||||||
| E | |||||||
| F | … |
| Comp | Offset (E) | Offset (N) | (km/s) | PA (deg) | |
|---|---|---|---|---|---|
| SIE | |||||
| SIS | |||||
| Source |
| Comp | Offset (E) | Offset (N) | ( days) | |
|---|---|---|---|---|
| A | ||||
| B | ||||
| C | ||||
| D |
The gravitational lens CLASS B1152+199. (a) 8.46 GHz VLA radio image, resolution, uniform weighting. (b) 14.94 GHz VLA image, resolution, uniform weighting.
Keck-II LRIS spectrum of B1152+199 dominated by light from the background source. The strong broad lines establish the source redshift as . The absorption lines at the blue end are associated with the lens.
Keck-II LRIS spectrum of lensing galaxy in B1152+199. The lines from the lens give . Lines associated with the background source are also seen in this spectrum.
The COSMIC band contour map of B1152+199, showing the 16.5-mag stellar object at the lens position. Contours are at intervals, and there is no sign of a secondary image. The field-of-view displayed is .
The gravitational lens CLASS B1359+154. (a) Deep 8.46 GHz VLA radio image, resolution, uniform weighting. (b) 14.94 GHz VLA image, resolution, natural weighting.
Keck-II LRIS spectrum of B1359+154. The identified emission lines give a source redshift of .
Wide field () COSMIC band image of CLASS B1359+154. The object is centered in the frame.
Close-up COSMIC band image of CLASS B1359+154. The pixel size is .
Critical curves (solid lines), caustics (inset), and curves of constant time delay (dashed lines) for the best-fit SIE+SIS model of CLASS B1359+154.