Now at Forschungszentrum Karlsruhe, P.O. Box 3640, D-76021 Karlsruhe, Germany
Now at Enrico Fermi Institute, The University of Chicago, 933 East 56th Street, Chicago, IL 60637, U.S.A.
Now at Universidad Autónoma de Barcelona, Instituto de F ísica d’Altes Energies, E-08193 Bellaterra, Spain
On leave from Altai State University, Dimitrov Street 66, 656099 Barnaul, Russia
Now at LPNHE, Universités Paris VI-VII, 4 place Jussieu, F-75252 Paris Cedex 05, France
Observations of Mkn 421 during 1997 and 1998 in the energy range above 500 GeV with the HEGRA stereoscopic Cherenkov telescope system
Abstract
Since its commissioning in fall 1996, the stereoscopic system of Imaging Atmospheric Cherenkov Telescope (IACTs) of HEGRA with an energy threshold of 500 GeV, an angular resolution of 0.1∘ and an energy resolution of 20% per individual photon, and an energy flux sensitivity Fν at 1 TeV of 10-11 (S/N = 5) for one hour of observation time has been used to monitor the BL Lac object Mkn 421 on a regular basis. In this letter, we report detailed temporal and spectral information about the TeV characteristics of Mkn 421 in 1997 and 1998. We study the light curve, the shortest time scales of flux variability, the differential spectra on diurnal basis for several days with good -ray statistics and the time averaged energy spectrum. Special emphasis will be put on presenting the data taken during the world-wide April 1997 multiwavelength campaign. We compare the Mkn 421 results with the results obtained for the BL Lac object Mkn 501 and discuss possible implications for the emission mechanism and the Diffuse Intergalactic Background Radiation.
Key Words.:
BL Lacertae objects: individual: Mkn 421 - 1997 and 1998 TeV characteristics1 Introduction
The advent of the Compton Gamma Ray Observatory and the EGRET instrument on board has led to the spectacular discovery of intense high energy -ray radiation from as many as 65 Active Galactic Nuclei (AGN) in the 0.1 to 10 GeV energy range (Hartman et al. Hart:99 (1999)). The recorded sources belong mainly to the blazar class, i.e. BL Lac objects, Optically Violent Variables (OVVs), and highly polarized quasars, all radio-loud sources which show variability on short time scales in most of the observed frequency bands. The power emitted in -radiation frequently dominates the power radiated by the source (see e.g. the spectral energy distributions shown by Fossati et al. Foss:98 (1998)). It is widely believed, that the non-thermal -ray emission is produced in a relativistic jet by a population of electrons, emitting synchrotron radiation at longer wavelengths and -rays in Inverse Compton (IC) processes of the highest energy electrons with lower energy seed photons (see for recent reviews Coppi Copp:97 (1997); Sikora Siko:97 (1997); Ulrich et al. umu:97 (1997)). The origin of the IC seed photons has not yet been established, debated possibilities include a target photon population dominated by lower energy synchrotron photons (the Synchrotron Self Compton mechanism, see e.g. Bloom & Marscher Bloo:93 (1993); Ghisellini et al. GhisMD:1996 (1996); Mastichiadis & Kirk Mast:97 (1997)), or dominated by external photons, e.g. by radiation from the nuclear continuum scattered or reprocessed in the broad-line regions (Sikora, Begelmann & Rees Siko:94 (1994); Blandford & Levinson Blan:95 (1995)), or by accretion disc photons (Dermer & Schlickeiser Derm:94 (1994)). Although these possibilities have been studied in great detail, models where hadrons are the particles primarily accelerated (see e.g. Mannheim et al. Mann:93 (1993)) can not be ruled out yet. Clearly, the study of the emission process could yield crucial clues regarding the structure of the jets leading ultimately to an understanding of the mechanisms of energy extraction operating in the surrounding of the central supermassive object.
In this paper, we report on the 1997 and 1998 observations of the BL Lac object Mkn 421 (redshift = 0.031) with the IACT system of HEGRA (Daum et al. Daum:97 (1997)). The system provides an energy threshold of 500 GeV, an angular resolution of 0.1∘ and an energy resolution of 20% for individual photons, and an energy flux sensitivity Fν at 1 TeV of 10-11 (S/N = 5) for one hour of observation time. It has been used to monitor Mkn 421 on a regular basis ever since its commissioning in fall 1996 to gain detailed temporal and spectral information.
TeV observations yield information about the emitting particles with very high energies, complementary to the information from longer wavelengths. Due to the extreme conditions needed for the production of TeV photons, TeV blazars could be extremely revealing laboratories for the understanding of these sources in general. It should be pointed out, that the TeV radiation is expected to be partially absorbed by the Diffuse Extragalactic Background Radiation (DEBRA) (e.g. Gould & Schréder Goul:65 (1965); Stecker, de Jager & Salomon Stec:92 (1992)). While on the one hand the DEBRA extinction opens unique possibilities to infer information about the DEBRA density in the largely unconstrained 0.5 to 100 m wavelength region (see Aharonian et al. 1999b , called Paper 2 in the following), on the other hand it renders the understanding of the source more difficult (e.g. Coppi & Aharonian Copp:99 (1999); Bednarek & Protheroe Bedn:99 (1999)).
The BL Lac Mkn 421 was the first extragalactic object to be discovered as a TeV emitter (Punch et al. Punc:92 (1992); Petry et al. Petr:96 (1996)). The early HEGRA observations during the 1994/1995 observation period showed, that the spectrum of Mkn 421 was significantly softer than the Crab spectrum (Petry et al. Petr:96 (1996)). While the mean TeV flux level of Mkn 421 is about 0.5 Crab units (Petry et al. Petr:96 (1996)), flares exceeding five Crab units on timescales as short as 15 minutes have been observed (Gaidos et al. Gaid:96 (1996)).
The second BL Lac object to be discovered as TeV source (Quinn et al. Quin:96 (1996); Bradbury et al. Brad:97 (1997)), Mkn 501 (redshift = 0.034), underwent a major outburst in X-ray and in the TeV energy range during 1997 (see e.g. Protheroe et al. Prot:98 (1997)). Detailed accounts of the results obtained with the HEGRA IACTs are given in (Aharonian et al. 1999a , called Paper 1 in the following), Paper 2, and in (Aharonian et al. 1999c ). The source emission showed strong variability with differential fluxes at 1 TeV from a fraction to 10 times the Crab flux. The HEGRA IACT system was used to determine diurnal differential spectra for more than 60 individual days. Surprisingly no correlation between absolute flux and spectral shape was found. The differential time averaged photon spectrum was well described by a power law with an exponential cutoff N/E up to energies of 20 TeV. Due to the similarity in redshifts of Mkn 421 and Mkn 501 ( = 0.031 and 0.034 respectively) the intergalactic extinction of the TeV photons caused by the DEBRA should be very similar for both objects and a comparison of both spectra is of utmost interest.
The paper is organized as follows. In Sect. 2 the IACT system of HEGRA is introduced, and in Sect. 3 the data sample and the analysis techniques are described. The results concerning the time averaged and the diurnal properties, as well as the search for variability within individual nights are presented in Sect. 4. In Sect. 5 the results are summarized and discussed.
2 The HEGRA Cherenkov telescope system
The HEGRA collaboration operates six imaging atmospheric Cherenkov telescopes located on the Roque de los Muchachos on the Canary island of La Palma, at 2200 m above sea level. A prototype telescope (CT1) started operation in 1992 and has undergone significant hardware upgrades since then (Mirzoyan et al. Mirz:94 (1994); Rauterberg et al. Raut:95 (1995)). This telescope continues to operate as an independent instrument and the Mkn 421 data taken with this telescope will be presented elsewhere. The stereoscopic system of Cherenkov telescopes consists of five telescopes (CT2 - CT6), and has been taking data since 1996, initially with three and four telescopes, and since fall 1998 as a complete five-telescope system. Four of the telescopes (CT2, CT4, CT5, CT6) are arranged in the corners of a square with roughly 100 m side length, and one telescope (CT3) is located in the center of the square. During 1997 and 1998, when the data discussed in this paper were taken, CT2 was still used as stand alone detector.
The telescopes have an 8.5 m2 tessellated reflector, focusing the Cherenkov light onto a camera with 271 Photomultipliers (PMTs), covering a field of view of in diameter. A telescope is triggered when the signal in at least two adjacent PMTs exceeds an amplitude of 10 (before June 1997) or 8 (after June 1997) photoelectrons; in order to trigger the IACT system and to initiate the readout of data, at least two telescopes have to trigger simultaneously. Typical trigger rates are in the 10-16 Hz range. The PMT signals are digitized and recorded by 120 MHz Flash-ADCs. The telescope hardware is described by Hermann (her:95 (1997)); the trigger system and its performance are reviewed by Bulian et al. (bul:98 (1998)); the calibration of the detector sensitivity is described in (Fraß et al. Fras:97 (1997)), and the determination of the correct telescope pointing with 35 arc sec accuracy is described in (Pühlhofer et al. pul:97 (1997)).
3 Data sample and analysis tools
The analysis described in the following is based on 165 hours of data acquired between January 1st, 1997 and May 27th, 1998 with Mkn 421 altitudes larger than 45∘ above the horizon. Only data taken with all four IACTs during excellent weather conditions, i.e. clear sky and humidity below 90%, have been used. Furthermore, data runs with a mean Cosmic Ray rate deviating by more than 21% from the expected value or with a mean width parameter per telescope deviating by more than 6% from the expected value were excluded from the analysis.
The Monte Carlo simulations used for the data analysis are described in detail in (Hemberger Hemb:98 (1998); Konopelko et al. Kono:99 (1999)). Changes of the trigger conditions, the mirror alignment and reflectivities as well as in the PM sensitivities divide the data sample in eight phases of approximately uniform detector performance. For each of these eight phases, the detector simulations have been adjusted to describe as closely as possible the hardware performance; hereby, information about the mirror alignment from point runs, information about the mirror reflectivities and Photomultiplier sensitivities from the measured Cosmic Ray rates, and the measured single pixel trigger characteristics have been taken into account (see Paper 1, 2 and references therein). The Monte Carlo fine tuning and the data quality have intensively been tested using data from Mkn 501, Mkn 421, and from the Crab nebula, allowing to effectively test all response functions relevant for the determination of -ray fluxes and -ray energy spectra (see Paper 1 & 2, and Hofmann hof:97 (1997)). The current status of the Crab analysis with the HEGRA telescope system is described in (Konopelko et al. kon:98 (1998)).
The standard analysis methods described in detail in Paper 1 and 2 have been used. Thus, spectral studies have been performed with loose selection cuts, i.e. with a cut on the angular distance of the reconstructed direction from the Mkn 421 direction and a cut on the parameter “mean scaled width” with a cut value of 1.2. Loose cuts do not give an optimal signal to noise ratio but guarantee small systematic errors on the energy dependent cut efficiencies. The analysis uses an extended OFF-region for minimizing the statistical errors of the background estimate. A ring segment (of 180∘ opening angle), from 0.3∘ to 0.7∘ distance from the camera center, at the opposite side of the ON-region, has been chosen. The energy reconstruction required two IACTs within 200 m from the shower axis, each with more than 40 photoelectrons per image and a “distance” parameter of smaller than 1.7∘. Additionally, a minimal stereo angle larger than 20∘ was required.
The methods for reconstructing the -ray energy spectra, as well as the description of the main sources of systematic uncertainties have been discussed in detail in Paper 1 and 2. The systematic errors can be divided into two parts, into an error on the absolute energy scale, and into additional errors on the shape of the spectrum (see Paper 2). The error on the absolute energy scale amounts to 15% and is dominated by a 10% uncertainty of the detector sensitivity. Additional uncertainties arise mainly due to the incomplete knowledge of the atmospheric conditions during the observations. The error on the shape of the spectrum is considerable in the threshold energy region, i.e. at energies below 1 TeV. The error is dominated by uncertainties in the trigger behavior of the IACTs and by uncertainties of the reconstruction of -ray energy spectra based on Monte Carlo simulations at discrete zenith angles. Integral fluxes above a certain energy threshold are obtained by integrating the differential energy spectra above the threshold energy, rather than by simply scaling detection rates. By this means the integral fluxes can be computed without assuming a certain source energy spectrum.
For the data up to zenith angles of 30∘, comprising altogether 126 h of data, spectral results are presented for energies above 500 GeV; for the 39 h of data with zenith angles between 30∘ and 45∘, an energy threshold of 1 TeV has been chosen. If not stated otherwise, the results presented in the following are derived from the data with zenith angles below 30∘.
4 Experimental results
4.1 Time averaged properties

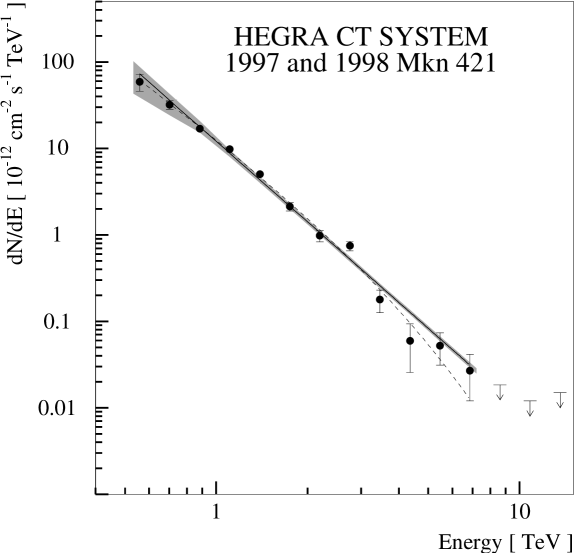
The total excess from Mkn 421 is shown in Fig. 1. Using an angular cut of the significance of the excess (() is 16 before image cuts and 26 after the image cut. The total number of recorded -rays is about 8000 at hardware threshold. The time averaged energy spectrum, determined from the data with zenith angles smaller than 30∘ is shown in Fig. 2. The error bars show the statistical errors, the hatched region shows the systematic error on the shape of the spectrum described above. Additionally, there is a 15% error on the absolute energy scale. From the lowest energies of 500 GeV to the highest energies detected at about 7 TeV, the spectrum can be described by a power law (Fig. 2, solid line)
| (1) |
The 36% systematic error on the flux at 1 TeV takes into account the error on the shape of the spectrum and the 15% error on the energy scale. The -value of the fit, computed with the statistical errors only, is 23.5 for 10 degrees of freedom, corresponding to a chance probability for larger -values of 1%. Taking into account the systematic errors on the shape of the spectrum, the result is surely compatible with a pure power law spectrum. Note however, that a power law with an exponential cutoff:
| (2) |
with E0 = 2.8 TeV, fits the data equally well (Fig. 2, dashed line). Here the -value, also computed with the statistical errors only, is 16.8 for 9 degrees of freedom with a chance probability for larger -values of 5%. The evaluation of the data from 30∘ to 45∘ zenith angles (39 h) gives similar results, although the statistics are very poor; the power law fit from 1 TeV to 5 TeV yields a differential spectral index of -3.16 .
The statistics do not permit to decide whether the energy spectrum changed from 1997 to 1998: for 1997, a differential spectral index of -3.28 0.20stat is computed, and for 1998 it is -3.00 0.05stat.

A possible correlation between absolute flux and spectral shape has been searched for by determining the time averaged energy spectrum for all days with a differential flux at 1 TeV, between 5 and 15 , and above 30 . The first data sample contains 43 h of data, the second one contains 13 h of data. The two spectra are shown in Fig. 3 for all bins with reasonable statistical errors. A power law fit to the high state data gives the differential spectral index of -2.98 0.09stat, and for the low state data we obtain -3.020.12stat, not indicating any difference between the two spectra.
4.2 Diurnal results


Figure 4 shows the 1997 and 1998 Mkn 421 light curve. Only statistical errors are shown. The systematic error on the integral flux, dominated by the 15% uncertainty in the energy scale, amounts to a 40% relative uncertainty. Mkn 421 was highly variable during 1997 and 1998; the fluxes varied from an emission of a fraction of one Crab level to more than one Crab level. Most of the flares seemed to last one or two days. In 1998, from April 17th to April 28th (MJD 50920 - MJD 50931) a high state lasting for approximately ten days was observed. This flare coincided with a world-wide multiwavelength campaign lasting approximately from April 10 to April 30 (Takahashi et al. Taka:99 (1999); Urry Urry:99 (1999)). A more detailed discussion of the HEGRA data from this campaign is given in the next subsection. During the whole 1997–1998 period no flares with fluxes in excess of two Crab levels were observed.
For days with long observation times or with strong source activity, diurnal differential spectra can be obtained. Two examples of spectra are shown in Fig. 5. The first spectrum was acquired during 1.6 hours and the second one during 3.4 hours. These diurnal spectra are statistics limited to energies below 4 TeV. In Table 1 the results of power law fits are summarized for all days with good statistics (3 sigma excess above 1 TeV). No highly significant evidence for spectral variability has been found; the diurnal differential spectral indices are statistically consistent with the mean index of -3.1. The two most significant deviations from the mean index were found for April 22nd/23rd, 1998 (MJD 50925/50926) and April 27th/28th, 1998 (MJD 50930/50931), where the spectral indices of -2.71 and -2.82 deviated by 2.1 and from the mean value, respectively.
| starta | b | c | spectral index | d |
|---|---|---|---|---|
| 50545.9181 | 2.67 | 13.48 +3.28 -3.06 | -3.87 +0.47 -0.51 | 5.95 +- 1.96 |
| 50548.9648 | 1.61 | 33.51 +4.23 -4.34 | -2.71 +0.21 -0.26 | 18.90 +- 3.28 |
| 50865.0528 | 1.61 | 26.42 +3.93 -3.87 | -2.81 +0.27 -0.32 | 16.18 +- 2.78 |
| 50866.0482 | 2.57 | 9.07 +2.43 -2.46 | -2.89 +0.48 -0.55 | 6.57 +- 1.67 |
| 50902.9772 | 2.06 | 4.91 +2.10 -2.03 | -2.05 +0.48 -0.69 | 6.52 +- 1.93 |
| 50903.9649 | 2.59 | 9.62 +2.58 -2.75 | -3.13 +0.41 -0.63 | 6.97 +- 1.76 |
| 50920.8784 | 0.97 | 32.85 +5.64 -5.36 | -2.66 +0.28 -0.33 | 21.58 +- 3.94 |
| 50921.8776 | 3.44 | 20.02 +2.53 -2.24 | -3.05 +0.21 -0.25 | 9.34 +- 1.63 |
| 50922.8790 | 3.01 | 8.55 +2.08 -2.20 | -2.63 +0.33 -0.46 | 5.85 +- 1.41 |
| 50923.8785 | 2.94 | 12.70 +2.48 -2.69 | -3.22 +0.43 -0.44 | 6.81 +- 1.55 |
| 50924.8804 | 3.21 | 9.43 +2.30 -2.28 | -2.88 +0.36 -0.51 | 7.28 +- 1.61 |
| 50925.8812 | 3.12 | 22.11 +2.30 -2.48 | -2.71 +0.15 -0.18 | 13.77 +- 1.82 |
| 50926.8814 | 3.05 | 16.75 +2.49 -2.74 | -3.53 +0.31 -0.38 | 7.66 +- 1.64 |
| 50927.8839 | 2.93 | 30.35 +3.16 -2.86 | -3.15 +0.20 -0.22 | 13.34 +- 2.01 |
| 50928.8824 | 2.92 | 16.75 +2.49 -2.74 | -3.19 +0.31 -0.35 | 9.69 +- 1.76 |
| 50929.8848 | 2.81 | 34.18 +3.56 -2.60 | -3.00 +0.15 -0.17 | 18.54 +- 2.24 |
| 50930.8845 | 2.72 | 37.00 +3.05 -3.49 | -2.82 +0.13 -0.15 | 23.62 +- 2.51 |
| 50947.9065 | 0.97 | 18.14 +4.41 -4.39 | -2.12 +0.44 -0.55 | 13.11 +- 3.28 |
| 50948.8937 | 1.44 | 13.48 +3.28 -3.46 | -2.57 +0.31 -0.41 | 11.43 +- 2.58 |
| 50956.8999 | 0.83 | 29.75 +6.52 -7.20 | -3.03 +0.53 -0.63 | 16.20 +- 4.17 |
| a MJD | ||||
| b duration of measurement in hours | ||||
| c in () | ||||
| d in () | ||||
4.3 The data of April 1998


As mentioned above, the data of April 1998 are of special interest since a world-wide multiwavelength campaign was performed with measurements in the radio, optical, and UV regimes, at X-Ray energies (RXTE, BEPPO Sax, ASCA), at GeV energies, and at TeV energies.
In Figure 6, the HEGRA integral fluxes above 500 GeV and above 1 TeV are shown (data up to 30∘ zenith angle in both plots). The flux varied by a factor of up to four. Note, that all days of the multiwavelength campaign are included in Table 1, since the emission was high and the observation windows were large.
In Fig. 7, the mean spectrum during the April campaign is shown.
A power law fit yields a differential
spectral index of -3.03 .

The mean differential flux at 1 TeV was (23.5 1.1stat 8.4syst) , which roughly equals the Crab flux at 1 TeV. The -value computed with the statistical errors is 16.1 for 9 degrees of freedom, corresponding to a chance probability for larger -values of 6.5%.
4.4 Search for variability within individual nights
Temporal variability within individual nights has been searched for using the integral fluxes above 500 GeV (data with zenith angles up to 30∘) and above 1 TeV (data with zenith angles up to 45∘). For the data of each night, the integral fluxes were determined with 15 min bins. For the first data selection the mean observation duration is 1.7 h per night, for the second one it is 25% higher, since data of larger zenith angles are included. Variability was searched for with a -analysis, fitting constant models to the integral flux rates and determining the chance probabilities for the resulting -values.
The results for the 1 TeV energy threshold data sample are given in Fig. 8. On the left side the distribution of the -log-values is shown. The chance probabilities distribute as expected in the absence of variability. On the side of small chance probabilities with -log, a marginally significant excess of three nights above an expectation of 0.76 can be recognized. Taking into account that 76 nights have been studied, the chance probability for finding such three nights is computed to be 4%. The integral fluxes of two nights are shown in Fig. 8 (right side). The lower panel shows one of the three nights with the most significant variability (May 21st/22nd, 1998, MJD 50954/50955). The examples exemplify that due to limited photon statistics, the search is only sensitive to strong flares. Also for the 500 GeV energy threshold data sample, no individual night with significant variability has been found.
A preliminary analysis of Whipple data taken during the world-wide multiwavelength campaign indicated flux variability at energies above 2 TeV on a time scale of several hours (Maraschi et al. Mara:99 (1999)). No simultaneous data was taken with the IACT system of HEGRA.
5 Discussion
In this paper we present detailed temporal and spectral information about Mkn 421 during 1997 and 1998. The mean 1997–1998 differential flux at 1 TeV was about one half of the flux of the Crab nebula. The light curve shows several distinct flares with mean durations of typically one or two days and fluxes at 1 TeV of approximately the Crab level. During the world-wide multiwavelength campaign in 1998, we observed a 10 day phase of increased Mkn 421 activity with a differential flux at 1 TeV of one Crab level.
The time averaged energy spectrum follows to good approximation a power law with a differential spectral index (500 GeV to 7 TeV) of -3.090.07stat 0.10syst. Our result is consistent with earlier measurements of the differential spectral index during periods of moderate flux, i.e. -3.61.0stat (at 1.2TeV) measured during the 1994/1995 observation period with the HEGRA CT1 telescope (Petry et al. Petr:96 (1996)) and -2.92 0.22stat 0.1syst measured during the 1995/1996 observation period with the Whipple telescope (Zweerink et al. Zwee:97 (1997)).
We did not find highly significant deviations from this mean spectrum, neither by dividing the data in a 1997 and a 1998 data sample, nor by dividing the data in a low and a high emission data set. Moreover, all diurnal spectra – some can be determined with an accuracy of 0.2 in the differential spectral index – are consistent with the mean spectrum.
The Whipple group reported on an extraordinary Mkn 421 flare observed on May 7th, 1996 with an integral TeV flux of more than 5 Crab units and a flux increase by a factor of 2 within approximetaly 1 h (Gaidos et al. Gaid:96 (1996)), which permitted to determine a differential spectral index during the flare with good statistical accuracy (Zweerink et al. Zwee:97 (1997); Krennrich et al. Kren:99 (1999)). An index of 0.07stat indicated a harder spectrum in the flaring state than in the quiescent state. Whereas our Mkn 421 spectra are consistent with a spectral index, which is independent of time and absolute flux, just as in the case of Mkn 501 (Paper 1), the Whipple spectrum during the extraordinary flare appears to be harder. Nevertheless, taking into account the statistical and systematic errors on the estimates of the photon power law index, the effect of spectral hardening during the very strong flare is only marginally significant.
In our data we did not find strong evidence for flux-variability within individual nights, although the sensitivity for this search was limited, due to short observation windows of approximately 2 h and the low levels of emission.
Due to the similar redshifts of Mkn 421 and Mkn 501, the comparison of their spectra promises insights into the intergalactic absorption by the DEBRA.
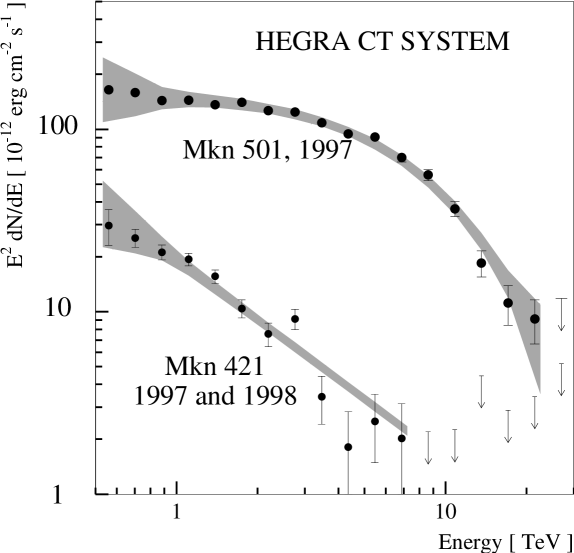
In Fig. 9, the 1997–1998 Mkn 421 spectrum is compared to the 1997 Mkn 501 spectrum. During 1997 Mkn 501 was on average at 1 TeV more than 7 times brighter than Mkn 421 during 1997–1998. The Mkn 421 spectrum is much softer than the Mkn 501 spectrum. Between energies of one and several TeV the differential spectral index is -3.1 for Mkn 421 and -2.2 for Mkn 501. Certainly, due to the similar redshifts of both objects, the difference has to be attributed to different intrinsic spectra and not to differences in the extinction by the DEBRA. In the Mkn 501 spectrum we recorded an exponential cutoff at 6.2 TeV, which could well be the result of the intergalactic absorption by the DEBRA (see Paper 2 for a detailed discussion of possible origins of the exponential cutoff). As can be recognized from the fits to the Mkn 421 data of Eqs. 1 and 2, we cannot exclude an exponential cutoff for cutoff energies above 2.8 TeV; this question will further be studied in future observations. In this presentation the Mkn 421 spectrum shows some curvature around 1 TeV. However, taking into account the systematic errors on the shape of the spectrum (see hatched regions in Fig. 9) the curvature is surely not significant.
We anticipate that detailed modeling of the temporal and spectral
characteristics of Mkn 421 during the multiwavelength campaign,
combining the TeV data with
informations from longer wavelengths, will permit to gain
important constraints on the astrophysical conditions inside the jet.
Acknowledgments. The support of the German ministry for Research and technology BMBF and of the Spanish Research Council CYCIT is gratefully acknowledged. We thank the Instituto de Astrophysica de Canarias for the use of the site and for supplying excellent working conditions at La Palma. We gratefully acknowledge the technical support staff of the Heidelberg, Kiel, Munich, and Yerevan Institutes. We thank T. Takahashi, E. Pian, M. Urry, and R. Remillard for the coordination of the multiwavelength campaign, so that a substantial part of the data presented in this paper was taken simultaneously with X-Ray data.
References
- (1) Aharonian F.A., Akhperjanian A.G., Barrio J.A., Bernlöhr K., Bojahr H., et al., 1999a, A&A 342, 69 (Paper 1)
- (2) Aharonian F.A., Akhperjanian A.G., Barrio J.A., Bernlöhr K., Bojahr H., et al., 1999b, submitted to A&A (Paper 2)
- (3) Aharonian F.A., Akhperjanian A.G., Barrio J.A., Bernlöhr K., Bojahr H., et al., 1999b, submitted to A&A, astro-ph/9901284
- (4) Bednarek W., Protheroe R.J., 1999, submitted to MNRAS
- (5) Blandford R.D, Levinson A., 1995, ApJ 441,79
- (6) Bloom S.D., Marscher A.P., 1993. In: AIP Conf. Proc. 280, Compton Gamma-Ray Observatory, ed. Friedlander M., Gehrels N., Macomb D.J. (New York AIP), 578
- (7) Bradbury S.M., Deckers T., Petry D., Konopelko, A., Aharonian F., et al., 1997, A&A 320, L5
- (8) Bulian N., Daum A., Hermann G., Hess M., Hofmann W., et al., 1998, Astropart. Phys. 8, 223
- (9) Coppi P.S., 1997. In: Cracow Workshop on Relativistic Jets in AGNs, eds. Ostrowski M., Sikora M., Madejski G., and Begelman M., Jagellonian University Press, p. 333
- (10) Coppi P.S. & Aharonian F.A., 1998, ApJ Let., submitted
- (11) Daum A., Hermann G., Heß M., Hofmann W., Lampeitl H., et al., 1997, Astropart. Phys. 8, 1
- (12) Dermer C.D & Schlickeiser R., 1994, Ap.J Suppl. 90, 945
- (13) Fossati G., Maraschi L., Celotti A., Comastri A., Ghisellini G., 1998, MNRAS 299, 433
- (14) Fraß A., Köhler C., Hermann G., Heß M., Hofmann W., 1997, Astropart. Phys. 8, 91
- (15) Ghisellini G., Maraschi L., Dondi L., 1996, A&AS 120, 503
- (16) Gould J. & Schreder, 1965, Phys. Rev. Lett. 16, 252
- (17) Hartman R.C.,Bertsch D.L., Bloom S.D., Chen A.W., Deines-Jones P., et al., 1999, accepted for publication in ApJS
- (18) Hemberger M., 1998, Ph.D. thesis, Heidelberg
- (19) Gaidos J.A., Akerlof C.W., Biller S.D., Boyle P. J., Breslin A.C., et al., 1996, Nat 383, 319
- (20) Hermann G., 1995. In: Procs. Towards a Major Atmospheric Cherenkov Detector IV, M. Cresti (ed), Padova, p. 396
- (21) Hofmann W., 1997. In: Procs. Towards a Major Atmospheric Cherenkov Detector V, De Jager O.C. (ed), Kruger Park, South Africa, p. 284
- (22) Konopelko A. (HEGRA collaboration), 1998. In Proc. 14th Europ. Cosmic Ray Symp., Madrid, in press
- (23) Konopelko A., Hemberger M., Aharonian F., Akhperjanian A.G., Barrio J.A., et al. 1999, accepted for publication in Astrop. Phys.
- (24) Krennrich F., Biller S.D., Bond I.H., Boyle P.J., Bradbury S.M., 1999, ApJ 511, 149
- (25) Mannheim K., 1993, A&A 269, 67
- (26) Maraschi L., Fossati G., Tavecchio F., Chiappetti L., Celotti A.,et al., 1999. In: Proc. the Veritas Workshop on the TeV Astrophysics of Extragalactic Objects, ed. Weekes T.C., Catanese M., Astroparticle Physics in press.
- (27) Mastichiadis A., Kirk J.G., 1997, A&A 320, 19
- (28) Mirzoyan R., Kankanian R., Krennrich F., et al., 1994, NIM A 315, 513
- (29) Petry D., Bradbury S.M., Konopelko A., Fernandez J., Aharonian F., et al., 1996, A&A 311, L13
- (30) Protheroe R.J., Bhat C.L., Fleury P., Lorenz E., Teshima M., Weekes T.C., 1998. In Proc. 25th ICRC, Durban, vol. 8, p.317
- (31) Pühlhofer G., Daum A., Hermann G., Hess M., Hofmann W., et al., 1997, Astropart. Phys. 8, 101
- (32) Punch M., Akerlof C.W., Cawley M.F., Chantell M., Fegan D.J., et al., 1992, Nat 358, 477
- (33) Quinn J., Akerlof C.W., Biller S., Buckley J., Carter-Lewis D.A., et al., 1996, ApJ 456, L83
- (34) Rauterberg G., Müller N., Deckers T. (HEGRA collaboration), 1995. In: Proc. 24th ICRC, Rome, 3, 460
- (35) Sikora M., Begelman M.C., Rees M.J., 1994, ApJ 421, 153
- (36) Sikora M., 1997, In: Proc. 4th Compton Symposium, AIP Conf. Proc., Dermer C., Strickman M., Kurfess J. (eds), 494
- (37) Stecker F.W., De Jager O.C. & Salamon M.H.,1992, ApJ. 390, L49
- (38) Takahashi T., Madejski G., Kubo H., 1999. In: Proc. the Veritas Workshop on the TeV Astrophysics of Extragalactic Objects, ed. Weekes T.C., Catanese M., Astroparticle Physics in press.
- (39) Ulrich M.H., Maraschi L., Urry C.M., 1997, ARA&A 35, 445
- (40) Urry C.M., 1999. In: Proc. the Veritas Workshop on the TeV Astrophysics of Extragalactic Objects, ed. Weekes T.C., Catanese M., Astrop. Physics in press.
- (41) Zweerink J.A., Akerlof C.W., Biller S.D., Boyle P., Buckley J.H., et al., 1997, ApJ 490, L141