Optical STJ Observations of the Crab Pulsar
Abstract
We report the first observations of an astronomical object using a superconducting tunnel junction (STJ) device, a pixel detector with intrinsic energy resolution in the optical wavelength range. The Crab pulsar was observed using a array of Tantalum STJs at the 4.2-m William Herschel Telescope on La Palma. Each array element provides photon counting capability recording up to photons pix-1 s-1 with an arrival time accuracy of about 5 s, and providing a wavelength resolution of about 100 nm. We derive a photometrically resolved light curve which, however, shows no significant colour index variations with pulsar phase.
Key Words.:
Crab pulsar, detectors1 Introduction
The possibility of intrinsic determination of individual photon energies in the optical range was first reported by Perryman et al. (1993), who proposed the application of STJ technology to optical photon counting. Incident photons break Cooper pairs responsible for the superconducting state. Since the energy gap between the ground state and excited state is only a few meV (rather than eV in the case of semiconductors), each individual photon creates a large number of free electrons, in proportion to the photon energy. The first experiments demonstrating single optical photon counting with energy resolution were reported by Peacock et al. (1996) using STJs, and further developments have been described by Peacock et al. (1997). Similar results using superconducting transition-edge sensors (TES) as microcalorimeters have recently been reported (Cabrera et al. (1998)), including first observations of the Crab pulsar by Romani et al. (1998).
Technology development within the Astrophysics Division at ESA is ultimately aiming at large arrays of low superconductors capable of Å intrinsic energy resolution at high count rates. A array of m2 Tantalum junctions has been developed as a first astronomical prototype (Rando et al. (1998)). The wavelength response is intrinsically very broad (from nm to nm) but is restricted in the present system to about 300–700 nm, as a result of the atmosphere ( nm) and the optical elements required for the suppression of infrared photons ( nm). The detector quantum efficiency is around 70% across this wavelength range, limited by the device/substrate geometry rather than by the intrinsic detector response. Count rate limits are about photons s-1, determined by the output stage electronics, although the device relaxation time is much faster, being below s for the present device. The current wavelength resolution, nm at 500 nm, is driven by system electronics and residual thermal background (IR) radiation, although the intrinsic response of the Ta junctions is some factor of 5 better than the present performance.
PSR B0531+21 in the Crab Nebula was first observed as an optical pulsar by Cocke et al. (1969), and provides an excellent target for verification of the system’s astronomical performance. Along with PSR B0833–45 in Vela (Wallace et al. (1977)), PSR B0540–69 in the LMC (Middleditch & Pennypacker (1985)) and more recently PSR B0656+14 (Shearer et al. (1997)) and possibly Geminga (Shearer et al. (1998)) it remains one of the few pulsars observed to emit pulsed optical radiation.
While the ms period pulsar has been extensively studied at all wavelengths including the optical (e.g. Percival et al. (1993), Eikenberry et al. (1996), Nasuti et al. (1996), Eikenberry & Fazio (1997), Gull et al. (1998), Martin et al. (1998)) it continues to be important in providing new insights into the nature of the pulsar emission mechanism: the pulse profile shape, the separation of the primary and secondary emission peaks by 0.4 in phase and recent results on the energy dependence of the pulse shape over the infrared to ultraviolet range (Eikenberry et al. (1996), Eikenberry & Fazio (1997)) provide a challenge to theoretical models in which -rays created through curvature radiation interact with the pulsar magnetosphere to produce the X-ray, ultraviolet, optical and infrared pulsations through a variety of energy-loss mechanisms. A photon counting detector with energy resolution in the optical offers an important possibility to examine further the energy dependence as a function of pulse phase.
2 Observations
Our prototype Tantalum STJ array covering an area of arcsec2 was operated at the Nasmyth focus of the William Herschel Telescope on La Palma in February 1999. Photon arrival time information was recorded with an accuracy of about s with respect to GPS timing signals; while the latter is specified to remain within 1 s of UTC, typical standard deviations are much less (Kusters (1996)). Observations were made on 4–6 Feb, although modest seeing ( arcsec), especially poor on the first two nights, and a significant number of unstable junctions, meant that total intensities could not be determined reliably. Our present analysis is restricted to the signal extracted from just 6 pixels (corresponding to an indeterminate but small () fraction of the overall PSF), and a consideration of the resulting pulse profile and its energy dependence.
Data from the STJ are archived in FITS format with the photon records defined by their arrival time, pixel coordinate, and energy channel in the range 0–255. Channels 50–100 cover nm, with , where is the channel number, , and . Energy calibration was performed using an internal calibration source before and after the target observations, and verified using narrow-band filter observations of a standard star.
Photon arrival times were translated to the solar system barycentre using the JPL DE200 ephemeris, taking into account gravitational propagation delay. Our reference timing ephemeris for the Crab pulsar used the 15 Feb 1999 (MJD = 51224) values of Hz and s-2 taken from the radio ephemeris of Lyne et al. (1999). Consistent periods were obtained, with a precision of typically s, from a period search of the timing data.
3 Results and Discussion
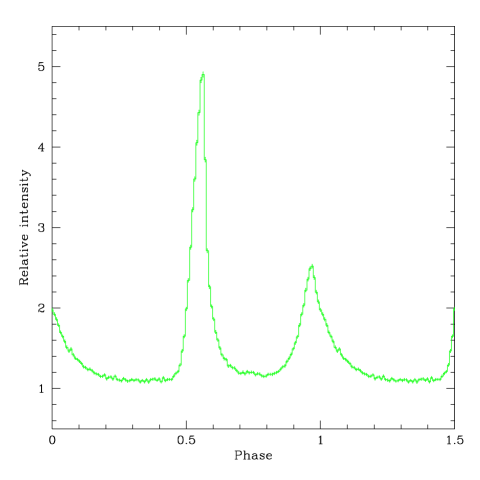
Fig. 1 shows the light curve from the 50 min of data obtained on 6 Feb, acquired with a time resolution of 5 s, and folded into 128 phase bins (s per bin), with an arbitrary origin of zero phase, and without background subtraction (impractical due to the combination of poor seeing, small field, and fraction of unstable junctions; the overall system response is undetermined for similar reasons, combined with uncalibrated losses at the derotator entrance aperture). Examination of the light curve, including the peaks, at finer temporal resolution down to about 30 s per phase bin, reveals no significant sub-structure persisting over the observation interval.
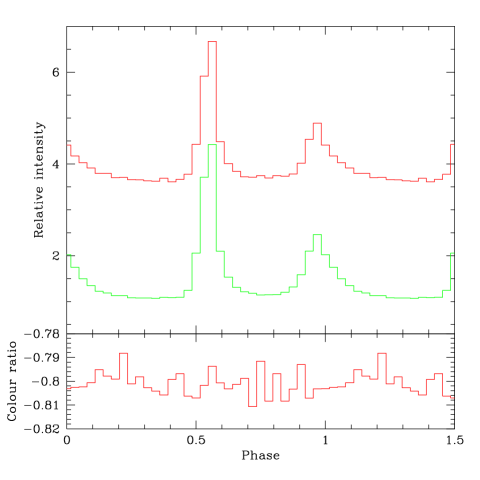
Fig. 2 shows the data divided into two separated energy channels, corresponding to E1 = 310–410 nm and E2 = 500–610 nm (energy channels 77–99 and 50–61 respectively). The profiles are normalised to the same relative intensities in the peaks, and are displaced vertically. For this choice of energy bins, the ratio of photons is roughly E2:E1 = 4:1. The resulting colour ratio, constructed as E2–E1/E2+E1 and folded at the pulsar period, is shown in the lower part of the figure.
Wavelength-dependent variations across the peaks has been noted by Eikenberry et al. (1996), based on observations spanning the UV to the infrared K band, and by Sandoval et al. (1998). Not suprisingly given the form of these reported variations, no significant variations with pulsar phase are evident in our data. From the nebular emission-line spectrum reported by Davidson (1979) the [O ii] doublet ( 3726, 3729) lies within our extracted blue passband, while the red passband selected comprises none of the strong emission lines in the red part of the spectrum ([N ii] 6584, H 6563, [N ii] 6584, [Si ii] 6717, 6731), and only marginally collects photons from the [O iii] doublet (4959, 5007). Our a posteriori choice of energy channels for this ratio provides sufficient wavelength separation to avoid ‘contamination’ of each bin given the low energy resolution of the device. Further discrimination of the nebular contributions is limited by our presently modest energy resolution, which is also insufficient to confirm the reality of the broad absorption feature near 5920 Å, so far noted only by Nasuti et al. (1996).
These observational results can be compared with predictions from models in which the observed flux in a given phase interval is a combination of emission from effectively disjointed physical regions, in which the sections contributing to the emission in a given phase interval depend on the viewing geometry (e.g. Cheng et al. (1986a), Cheng et al. (1986b)). This mixing of physical regions acts to average the total emission, and predicts that observed properties such as the energy ratio remain constant, or change modestly but rapidly close to the emission peak (Romani (1996)). Higher S/N STJ data will be required to probe the small, rapid spectral index variations across the pulse peaks reported by Sandoval et al. (1998).
As the first application in astronomy of a superconducting tunnel junction detector capable of providing intrinsic wavelength resolution in the optical, the results are a modest indication of the technology’s capabilities for the future. Significant improvements in performances, and in particular in the wavelength resolution, are expected from the use of lower critical temperature superconductors in the future.
Acknowledgements.
We acknowledge the contributions of other members of the Astrophysics Division of the European Space Agency at ESTEC involved in the optical STJ development effort, in particular J. Verveer and S. Andersson (who also provided technical and system engineering support at the telescope) and P. Verhoeve for evaluation of device performance. We acknowledge D. Goldie, R. Hart and D. Glowacka of Oxford Instruments Thin Film Group for the fabrication of the array. We are grateful for the assignment of engineering time at the William Herschel Telescope of the ING, and we acknowledge the excellent support given to the instrument’s commissioning, in particular by P. Moore and C.R. Benn. The analysis made use of the up-to-date Jodrell Bank Crab pulsar timing results, maintained on the www by A.G. Lyne, R.S. Pritchard and M.E. Roberts. We thank G. Vacanti and A. Hazell for software updates allowing our data to be processed within the FTOOLS/XRONOS environment. We thank the referee, R.W. Romani, for helpful comments.References
- Cabrera et al. (1998) Cabrera B., Clarke R. M., Colling P., Miller A. J., Nam S., Romani R. W. 1998, Appl. Phys. Let. 73(6), 735
- Cheng et al. (1986a) Cheng K. S., Ho C., Ruderman M. 1986a, ApJ 300, 500
- Cheng et al. (1986b) Cheng K. S., Ho C., Ruderman M. 1986b, ApJ 300, 522
- Cocke et al. (1969) Cocke W. J., Disney M. J., Taylor D. J. 1969, Nat 221, 525
- Davidson (1979) Davidson K. 1979, ApJ 228, 179
- Eikenberry & Fazio (1997) Eikenberry S. S., Fazio G. G. 1997, ApJ 476, 281
- Eikenberry et al. (1996) Eikenberry S. S., Fazio G. G., Ransom S. M. et al. 1996, ApJ 467, L85
- Gull et al. (1998) Gull G. R., Lindler D. J., Crenshaw D. M. et al. 1998, ApJ 495, L51
- Kusters (1996) Kusters J. A. 1996, Hewlett-Packard Journal December 1996, 60
- Lyne et al. (1999) Lyne A. G., Pritchard R. S., Roberts M. E. 1999, http://www.jb.man.ac.uk/ pulsar/crab.html
- Martin et al. (1998) Martin C., Halpern J. P., Schiminovich D. 1998, ApJ 494, L211
- Middleditch & Pennypacker (1985) Middleditch J., Pennypacker C. 1985, Nat 313, 659
- Nasuti et al. (1996) Nasuti F. P., Mignani R., Caraveo P. A., Bignami G. F. 1996, A&A 314, 849
- Peacock et al. (1996) Peacock A., Verhoeve P., Rando N. et al. 1996, Nat 381, 135
- Peacock et al. (1997) Peacock A., Verhoeve P., Rando N., Perryman M. A. C., Taylor B. G., Jakobsen P. 1997, A&AS 123, 581
- Percival et al. (1993) Percival J. W., Biggs J. D., Dolan J. F. et al. 1993, ApJ 407, 276
- Perryman et al. (1993) Perryman M. A. C., Foden C. L., Peacock A. 1993, Nuc. Inst. Meth. A 325, 319
- Rando et al. (1998) Rando N., Peacock A., Andersson S. et al. 1998, Proc. SPIE 3435, 74
- Romani (1996) Romani R. W. 1996, ApJ 470, 469
- Romani et al. (1998) Romani R. W. et al. 1998, BAAS 30, 1266
- Sandoval et al. (1998) Sandoval J. L. et al. 1998, BAAS 30, 1420
- Shearer et al. (1998) Shearer A., Golden A., Harfst S. et al. 1998, A&A 335, L21
- Shearer et al. (1997) Shearer A., Redfern R. M., Gorman G. et al. 1997, ApJ 487, L181
- Wallace et al. (1977) Wallace P. T. et al. 1977, Nat 266, 692