X-ray Properties of the Weak Seyfert 1 Nucleus in NGC 4639
Abstract
Low-luminosity active galactic nuclei (AGNs), of which NGC 4639 is a good example, constitute an important but poorly understood constituent of the nearby galaxy population. We obtained observations of NGC 4639 with ASCA in order to investigate its mildly active Seyfert 1 nucleus at hard X-ray energies. Koratkar et al. (1995) have previously shown that the nucleus is a pointlike source in the ROSAT soft X-ray band. We detected in the 2–10 keV band a compact central source with a luminosity of 8.3 1040 ergs s-1 (for an adopted distance of 25.1 Mpc). Comparison of the ASCA data with archival data taken with the Einstein and ROSAT satellites shows that the nucleus varies on timescales of months to years. The variability could be intrinsic, or it could be caused by variable absorption. More rapid variability, on a timescale of 104 s, may be present in the ASCA data. The spectrum from 0.5 to 10 keV is well described by a model consisting of a lightly absorbed ( cm-2) power law with a photon index of = 1.680.12. We find no evidence for significant emission from a thermal plasma; if present, it can account for no more than 25% of the flux in the 0.5–2.0 keV band. The limited photon statistics of our data do not allow us to place significant limits on the presence of iron K emission.
Despite its low luminosity, the X-ray properties of the nucleus of NGC 4639 appear quite normal compared to those of more luminous AGNs. The strength of its broad H line follows the correlation between broad H luminosity and hard X-ray luminosity previous known for luminous objects. Images taken with the Hubble Space Telescope detected the nucleus in the ultraviolet at a strength relative to the X-ray band which appears to be quite typical of that found in other AGNs. NGC 5033, another low-luminosity Seyfert 1 galaxy whose optical characteristics closely resemble those of NGC 4639, has also been recently studied with ASCA, and we highlight some of the similarities between these two objects.
1 Background
NGC 4639 is one of the weakest known Seyfert galaxies. Its active nucleus was discovered by Filippenko & Sargent (1986) during the course of an extensive optical spectroscopic survey of nearby galaxies (Filippenko & Sargent 1985; Ho, Filippenko, & Sargent 1995). NGC 4639 is a moderately-inclined, bulge-dominated barred spiral; Sandage & Tammann (1981) assign it a Hubble type of SBb, and de Vaucouleurs et al. (1991) favor a classification of SABbc. The Cepheid-based distance of the galaxy has been determined by Sandage et al. (1996) to be 25.1 Mpc. The optical spectrum of the nucleus exhibits prominent hydrogen Balmer emission lines with velocities of 4000 km s-1 at full-width half-maximum (FWHM). According to the criteria of Osterbrock (1981), the relative strengths of the broad Balmer lines formally qualify the nucleus as a Seyfert of type 1.0 (Ho et al. 1997b). By traditional standards, however, the nucleus of NGC 4639 is intrinsically quite weak. Ho et al. (1997b) measure a luminosity of 1 1040 ergs s-1 for the broad H emission line. The pointlike nucleus, while visible in Hubble Space Telescope (HST) images taken at optical wavelengths (Calvani et al. , in preparation), is nonetheless rather faint: 19.5 mag, or –12.5 mag — at least a factor of fainter than the most luminous Seyfert nuclei ( –23 mag; Weedman 1976).
Very little information exists for active galactic nuclei (AGNs) in the luminosity regime of NGC 4639. Detailed studies of such objects are not only of intrinsic interest, but, by exploring new parameter space, may illuminate our understanding of the AGN phenomenon in general. The data deficiency is particularly acute at X-ray energies, where poor angular resolution and low sensitivity have been major hinderances in detecting and isolating a faint nucleus from the surrounding light of the host galaxy. Substantial progress has been made in the past few years with the advent of ROSAT and ASCA (see, e.g., Koratkar et al. 1995; Ishizaki et al. 1996; Serlemitsos, Ptak, & Yaqoob 1996; Iyomoto et al. 1998; Nicholson et al. 1998; Ptak et al. 1999; Terashima 1999), but the samples studied so far remain very small and are largely biased against low-luminosity Seyferts.
Here we present new X-ray observations of NGC 4639 obtained with ASCA. We will combine these observations with existing data taken with ROSAT and with HST in order to derive a more complete picture of the X-ray properties of the source.
2 X-Ray Observations
The ASCA data were acquired on 1997 December 17 and 23 UT; a description of the satellite can be found in Tanaka, Inoue, & Holt (1994). ASCA consists of four identical X-ray telescopes whose focal plane is equipped with two Solid-state Imaging Spectrometers (SIS0 and SIS1) and two Gas Imaging Spectrometers (GIS2 and GIS3). The SIS covers the energy range 0.6–10.0 keV with a resolution (FWHM) of at 6 keV and 20 at 1.5 keV; each camera has a field-of-view of approximately 22′22′, although in these observations only one CCD was active resulting in a field-of-view of 11′11′. The GIS has lower spectral resolution than the SIS ( at 6 keV and 7 at 1.5 keV), but it has higher efficiency in the hard X-rays over the bandpass 0.7–10.0 keV; the usable field-of-view of the GIS has a circular diameter 40′. The point-spread function (PSF) of the images has a half-power diameter of 3′, with 20% of the photons concentrated in a sharp core of diameter 1′. In practice, the SIS delivers images of higher angular resolution than the GIS, whose PSF core is somewhat adversely affected by errors from position determination.
We operated the SIS in the 1-CCD faint mode, and the GIS was used in the nominal pulse-height mode. We screened the data using standard criteria, which include exclusion of data taken when the elevation angle was less than 25∘ for SIS and less than 5∘ for GIS, when the geomagnetic cut-off rigidity was less than 6 GeV , and during passage through the South Atlantic Anomaly. So-called hot and flickering pixels were also removed from the SIS data. The final integration times for the SIS and GIS data sets are 66.8 ks and 71.1 ks, respectively. The light curves and spectra, discussed in the next section, were extracted using a circular aperture of radius 4′ for the SIS and 6′ for the GIS. We measured the background from a source-free region within the same field. After background subtraction, the count rates for SIS0, SIS1, GIS2, and GIS3, averaged over the two observations, are 0.034, 0.033, 0.019, and 0.021 counts s-1, respectively. We combined the SIS0 and SIS1 spectra after appropriate gain corrections, and similarly for the GIS2 and GIS3 spectra. To permit analysis, the spectra were binned such that each bin contains at least 20 counts.
3 Analysis
3.1 Spatial Fitting
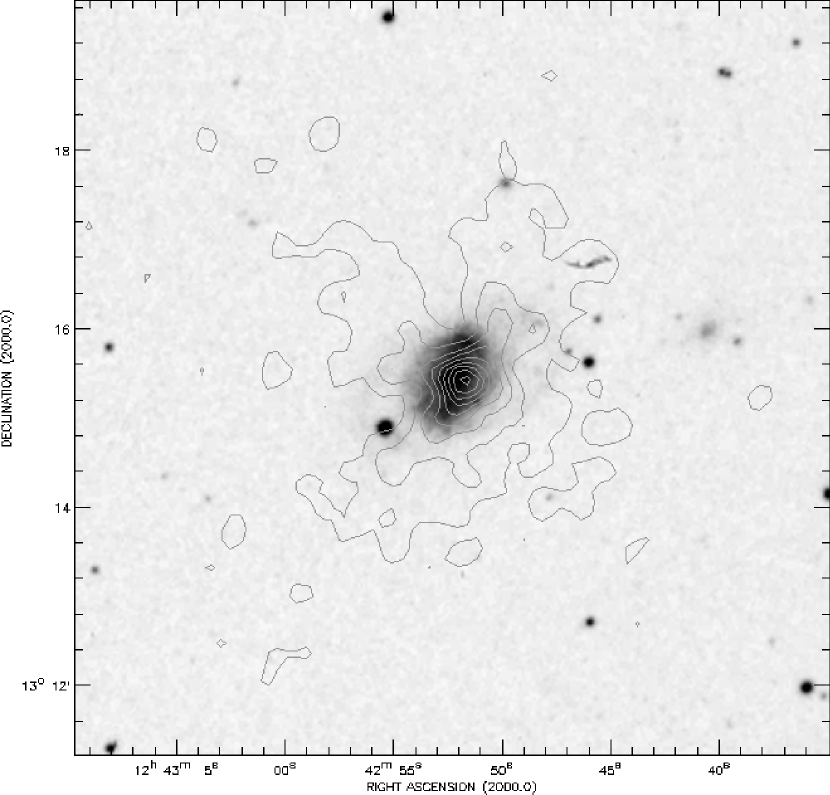
Figure 1 displays the SIS0+SIS1 contour image of NGC 4639 taken on 1997 December 17, superposed on an optical image of the galaxy taken from the Digital Sky Survey. A compact source positionally coincides with the optical nucleus. In order to properly analyze the spatial extent of X-ray data, particularly in the case of ASCA, the contribution of the PSF must be taken into account. In order to do this, we produced a model PSF and then convolved it with a model consisting of a single Gaussian, , or a double Gaussian, . The best-fitting spectral model for the ASCA data (§ 3.2) was used to simulate the energy dependence of the PSF. We only analyzed the SIS0 data from the first observation; combining data from both SIS detectors for spatial analysis is problematic because the source lies at different off-axis angles in the two detectors. We find that a single Gaussian provides an acceptable fit: the source is consistent with being unresolved, with an upper limit size of 30′′.
We have also reanalyzed the ROSAT High-Resolution Imager (HRI) image of NGC 4639 previously published by Koratkar et al. (1995). We adopt as a model of the HRI PSF the analytic formula given in http://heasarc.gsfc.nasa.gov/docs/rosat/faqs/hri_psf_faq1.html. The HRI data were split into two observations separated by 5 months. The latter observation is consistent with a single-Gaussian fit with 2′′. In addition to the dominant compact source, the earlier of the two observations shows measurable excess emission at 25′′, at a level of 2% of the total count rate. This extra component may be due to a variable source, such as a background quasar, although inspection of the two images does not reveal any obvious point source apart from the galaxy nucleus. Alternatively, the low-level emission may be an artifact of PSF variations, which have been known to occur at this level (E. Colbert, private communications). Given that NGC 4639 does show evidence of long-term variability (§ 3.3), it is reasonable to assume that essentially all of the X-ray flux from NGC 4639 is unresolved, with a half-light radius on the order of 2′′ ( pc) or less.
3.2 Spectral Fitting
After reducing the ASCA data, we extracted separate spectra for each of the SIS and GIS detectors, resulting in a set of eight source and eight background spectra for the two observations. We find that the SIS0 and SIS1 spectra are consistent with each other, as are the GIS2 and GIS3 spectra, and, accordingly, the data from each detector were combined. (SIS and GIS spectra cannot be combined because the detectors have different bandpasses and responses.) This resulted in two SIS and two GIS spectra. In the following, we fit the four spectra simultaneously, leaving the overall normalization to be a free parameter (to allow for systematic uncertainty in the flux calibration of each set of detectors and for variability between the two observations). A model consisting of a power law modified by photoelectric absorption provides an acceptable fit to all four spectra (the reduced , , is 0.98 for 491 degrees of freedom), resulting in a column density of cm-2 and a photon index of = 1.68 (1.56–1.80), where the values in parentheses give the 90% confidence interval assuming two interesting parameters. For comparison, the foreground absorbing column due to the Galaxy is cm-2 (Murphy et al. 1996), and, for an assumed Case B′ ratio H/H = 3.1 (see Gaskell & Ferland 1984), the decrement of the narrow Balmer lines measured by Ho et al. (1997a) indicates an internal reddening of 0.03 mag, which corresponds to cm-2 for the conversion /(5.8 1021 cm-2) mag (Bohlin, Savage, & Drake 1978). The spectra, their fits, and the residuals of the fits are shown in Figure 2. The observed 2–10 keV flux is ergs s-1 cm-2 (corresponding to a luminosity of 8.3 1040 ergs s-1 for an adopted distance of 25.1 Mpc) for all but the second SIS observation, which gave a flux 25% higher. ASCA fluxes typically have uncertainties of 10%–20%, so the flux discrepancy of the second observation is somewhat large but probably not inconsistent with the calibration uncertainty of the detectors.

| Model | (0.5–2 keV) | (2–10 keV) | /dof | |||
|---|---|---|---|---|---|---|
| (1020 cm-2) | (ergs s-1 cm-2) | (ergs s-1 cm-2) | (%) | |||
| ASCA | ||||||
| Power Law | 7.3 (2.2–12.9) | 1.68 (1.56–1.80) | 4.7 10-13 | 1.1 10-12 | 0.98/491 | |
| Power Law + Thermal | 6.1 (18.4) | 1.67 (1.52–1.84) | 4.7 10-13 | 1.1 10-12 | 25 | 0.98/489 |
| ASCA and ROSAT | ||||||
| Power Law | 2.0 (1.2–3.3) | 1.58 (1.51–1.66) | 2.5 10-13 | 1.1 10-12 | 0.99/504 | |
| Power Law + Thermal | 1.9 (17.9) | 1.58 (1.48–1.68) | 2.5 10-13 | 1.1 10-12 | 20 | 0.99/502 |
Note. — The errors quoted are at the 90% level for two interesting parameters.
| Detector | Dates | (0.5–2 keV) |
|---|---|---|
| (ergs s-1 cm-2) | ||
| Einstein IPC | 1980 Jun. 27 | 4.2 10-13 |
| ROSAT HRI | 1992 Jun. 27 | 8.0 10-13 |
| ROSAT HRI | 1992 Dec. 12 | 4.0 10-13 |
| ROSAT PSPC | 1993 Jun. 30 | 2.5 10-13 |
| ASCA | 1997 Dec. 17 | 4.6 10-13 |
| ASCA | 1997 Dec. 23 | 5.0 10-13 |
Previous ASCA observations have shown that low-luminosity AGNs typically emit a soft, thermal component in their X-ray spectra (e.g., Serlemitsos et al. 1996; Ptak et al. 1999), and it would be of interest to see if NGC 4639 follows this pattern. We attempted to fit the spectra with a model consisting of a thermal, Raymond-Smith (1977) plasma plus a power-law component. Since the statistics are limited in this case, we fixed the temperature and the abundance of the plasma to the mean values found in Ptak et al. (1999), namely = 0.7 keV and = 0.043 . This fit yielded an upper limit to the thermal flux of ergs s-1 cm-2, or 25% of the total flux in the 0.5–2.0 keV band.
There is no evidence for significant Fe K emission at 6.4 or 6.7 keV, the expected line energies for neutral and He-like iron, although the statistics are limited. Assuming the feature to be Gaussian in shape, we find upper limits to the equivalent width of 800 eV for a narrow line ( eV) and 1000 eV for a broad line ( eV).
In order to obtain a more sensitive measure of the absorbing column, we attempted to fit the ASCA data simultaneously with the ROSAT Position-Sensitive Proportional Counter (PSPC) spectrum taken by Koratkar et al. (1995). The PSPC spectrum was extracted using a circular aperture of diameter 125. The combined fit yields a photon index of = 1.58 (1.51–1.66), similar to that obtained from the ASCA data alone, but the 0.5–2.0 keV flux is lower (by 50%), as is the column density, cm-2, although the latter is statistically consistent with the ASCA fit. A two-component (thermal plasma plus power law) fit once again limits the possible contribution from a thermal component to 20%, and the parameters of the power-law component remain essentially unchanged. Table 1 summarizes the results of the spectral fits. Note that the slope we derive for the X-ray continuum is significantly flatter than the value of = 2.270.40 determined by Koratkar et al. (1995) from fitting the PSPC data alone. In our joint fit we also do not find spectral residuals at 1 keV, as suggested by Koratkar et al. These disagreements are not surprising given the limited PSPC bandpass and the low signal-to-noise ratio of the PSPC data. Several authors have found discrepancies between ASCA and ROSAT PSPC results in the bandpass where they overlap (0.5–2.0 keV; see Iwasawa, Fabian, & Nandra 1999 and references therein), which suggests that there exists a calibration problem, most likely attributed to the PSPC, on the order of 20%–40%. Moreover, as discussed further below (§ 3.3), the nucleus of NGC 4639 clearly varies in the soft X-ray band. The results of our simultaneous fit should, therefore, be treated with some caution, although including the PSPC data has a very small impact on the observed hard, power-law component.
3.3 Variability


We searched for short-term flux variability within each of the two separate ASCA observations. The top panel of Figure 3 shows the light curves obtained from combining the GIS2 and GIS3 data using a bin size of 5760 s, the length of one satellite orbit, and a similar plot for the SIS0 and SIS1 data is given in the bottom panel of the figure. To access the level of variability we performed a test to evaluate the null hypothesis that the flux is constant. In the December 17 observation, variations are apparent at the level of 50% for the SIS data; a constant model fit produces = 2.8 for 15 degrees of freedom, and therefore can be rejected at a significance level of 99.9%. The background count rate stayed constant. On the other hand, the SIS data for the second observation, taken six days later, showed no signs of variability. A constant model fit yields = 0.8 for 21 degrees of freedom. Marginal evidence of mild variability, significant at level of 95%, may be present in both GIS observations.
We searched for variability between the two observations and found none. To assess the nature of possible X-ray variability on longer timescales, we have retrieved archival data taken with the Einstein IPC in 1980, as well as data acquired on three epochs between 1992–1993 with the ROSAT HRI and PSPC. For each of the Einstein and ROSAT instruments, we simulated the flux expected in the 0.5–2.0 keV band from the observed count rates and an assumed power-law model with = 1.58 and = 2.0 1020 cm-2, the best-fit parameters obtained from the joint ASCA plus ROSAT PSPC fit (Table 1). A summary of the flux history is presented in Table 2 and in Figure 4. The source clearly undergoes large-amplitude flux changes over timescales of several months to a year. In an interval of six months the two HRI pointings showed a factor of 2 variability, and the largest peak-to-peak flux change is a factor of 3.2 in one year. This type of long-term X-ray variability is commonly seen in other low-luminosity AGNs (Serlemitsos et al. 1996, and references therein). The variability could be intrinsic to the source, or it could be caused by variable absorption.
4 Discussion
4.1 The X-ray Characteristics
We have established that most of the X-ray emission in NGC 4639, both at hard and soft X-ray energies, is nuclear. Although the rather coarse angular resolution of ASCA and ROSAT does not provide a stringent limit on the physical source size, the morphology does suggest that most of the emission originates from a compact region spatially coincident with the optical center of the galaxy. Flux variability, evident in the soft and hard bands, further supports this conclusion. Most of the X-ray emission from NGC 4639, therefore, is likely to be directly associated with its weak AGN observed at optical wavelengths.
The broad resemblance of NGC 4639 to luminous Seyfert 1 nuclei extends to the spectral domain, despite the fact that its 2–10 keV luminosity is only 8 1040 ergs s-1, at least a factor of 10–103 smaller than in most Seyfert galaxies conventionally studied. The spectrum of NGC 4639 from 0.5 to 10 keV, a moderately absorbed power law with a photon index of 1.6–1.7, is quite similar to the 2–10 keV spectra of more powerful AGNs (Mushotzky 1982; Turner & Pounds 1989; Nandra et al. 1997b). Like other broad-lined Seyfert nuclei the amount of obscuration seen toward the nucleus of NGC 4639 is small. The absorbing column derived from the best-fitting model is consistent with pure foreground absorption from the Galaxy and at most requires a slight excess column from the host galaxy itself. The most salient feature of the X-ray spectrum of NGC 4639 — a “canonical” continuum slope — is generally seen in ASCA observations of other low-luminosity AGNs (see references cited in § 1). The limited photon statistics of our data, unfortunately, prevent us from making a meaningful assessment of spectral features that might be present. We cannot address, for instance, whether signatures of X-ray reprocessing by cold material, such as the fluorescent Fe K line or the Compton reflection bump, are present in the spectrum. The upper limit for the Fe K line that we derive is large enough to accommodate the range of observed line strengths.
The long-term X-ray flux history of NGC 4639 exhibits pronounced variability on timescales of months to years. With less confidence, we have argued that it also plausibly experiences mild flux changes on intervals as short as hours in the ASCA band. The short-term lightcurves of low-luminosity AGNs so far studied with ASCA are noteworthy for their unremarkableness (Ptak et al. 1998). Among more luminous AGNs, the amplitude of variability in the hard X-ray band typically increases with decreasing X-ray luminosity (e.g., Barr & Mushotzky 1986; Lawrence & Papadakis 1993; Nandra et al. 1997a). The analysis of Nandra et al. (1997a) shows, for example, that a source such as NGC 4051, with (2–10 keV) ergs s-1 (Mihara et al. 1994, assuming = 17 Mpc), has a variability amplitude (“variance”) 25 times larger than, say, NGC 5548, whose (2–10 keV) ergs s-1 (Mushotzky et al. 1995, assuming = 67 Mpc). The objects in the sample of Ptak et al. (1998) are at least an order of magnitude less luminous than NGC 4051, and yet they vary much less than NGC 4051 does. Their variability behavior clearly deviates from the trend established by more luminous sources. In the case of NGC 4639, however, we have verified through simulations that variability at the level of NGC 4051 cannot be excluded by the present data.
4.2 The Nature of Central Source
What is the production mechanism of the X-ray emission in NGC 4639? Does it arise predominantly from processes similar to those in more luminous AGNs, or does it instead come from stellar sources such as X-ray binaries or starburst activity? The strength of the broad component of the hydrogen Balmer lines in luminous Seyfert 1 nuclei scales with the observed X-ray luminosity in the 2–10 keV band (Elvis et al. 1978; Ward et al. 1988), a trend which can be interpreted as evidence that the optical emission lines are produced primarily through photoionization by the central continuum source. A similar correlation is seen in the soft X-ray band (Kriss, Canizares, & Ricker 1980), and Koratkar et al. (1995) have shown that low-luminosity sources, including NGC 4639, also obey the correlation. Terashima (1999) has recently found that broad-lined low-luminosity Seyferts and LINERs extend the –(2–10 keV) relation of Ward et al. (1988) toward the faint end. This result suggests the hard X-ray emission in both luminosity classes share a common origin. We find that NGC 4639, too, falls on the correlation. The value of (2–10 keV)/ ranges between 2.7 to 6.1 depending on the assumed extinction affecting the optical emission (see below), well within the scatter of the correlation reported by Terashima (1999).
Perhaps a more stringent test can be made by examining the shape of the ionizing continuum. Although we do not have spectroscopic measurements in the ultraviolet (UV), nor do we have any constraints on the strength of the continuum in the extreme-UV band, we can calculate a rudimentary two-point spectral index between 2500 Å and 2 keV, . This quantity has an average value of 1.4 in quasars and 1.2 in luminous Seyfert 1s (Mushotzky & Wandel 1989). The central region of NGC 4639 has been observed with the Wide-Field Planetary Camera 2 (WFPC2) on HST through the F218W filter ( 2150 Å, FWHM 356 Å); these observations will be reported by Calvani et al. (in preparation). The nucleus was clearly detected as a point source with a flux density at 2500 Å of = 2.0 10-28 ergs s-1 cm-2 Hz-1. The true strength of the UV emission, however, is quite uncertain because of the possible effects of dust extinction. As discussed in §3.2, the Galaxy contributes = 0.04 mag to the reddening, and an additional 0.03 mag, as determined from the decrement of the narrow Balmer lines, may be internal to NGC 4639. For the Galactic extinction law of Cardelli, Clayton, & Mathis (1989), dereddening by = 0.07 mag increases the 2500 Å flux by a factor of 1.6, and we find = 0.950.01, where the error bars reflect the range allowed for the X-ray slope. If, on the other hand, we suppose that the value of [ cm-2] obtained from the ASCA data provides a better indicator of the absorbing column affecting the UV emission, then = 0.13 (0.04–0.22) mag, and = 1.01 (0.92–1.12). Finally, we note that it is possible that the UV continuum experiences even more severe extinction than is indicated either by the narrow-line region Balmer decrement or by the X-ray absorbing column. The relative intensities of the broad Balmer lines, measured from the spectra published in Ho et al. (1995), suggest that the broad-line region is significantly reddened. The observed ratios of H:H:H = 4.7:1.0:0.38. Whereas radiative transfer effects and collisional excitation in the broad-line region render the H/H ratio an unreliable reddening indicator (see, e.g., Netzer 1975; Kwan & Krolik 1981), the intrinsic H/H ratio is less susceptible to variations in physical conditions. For an intrinsic Case B′ H/H = 0.47, the observed value indicates 0.4 mag. If this amount of reddening is appropriate for the continuum, and, furthermore, if the Galactic extinction curve is applicable, the UV emission would have to be increased by a factor of 14, and 1.3. Given the many uncertainties involved, it is obviously difficult to be definitive about the strength of the UV emission relative to the X-rays, but it appears to be roughly consistent with what is observed in more luminous Seyferts.
As an additional consistency check, the observed luminosity of the Balmer lines can be compared with that predicted from recombination theory given the ionizing luminosity, which we can compute by interpolating the spectral energy distribution between the UV and X-ray bands. For this comparison, we will use H instead of H to avoid potential complications from collisional enhancement of H in the broad-line region. The total (narrow plus broad) luminosity of H measured from the spectra in Ho et al. (1995), following the procedures outlined in Ho et al. (1997a, b), is 2.9 1039 ergs s-1, of which 94% comes from the broad component. Depending on the adopted reddening [ = 0.07–0.4 mag; see above], the corrected H luminosity ranges from (0.4–1.1) 1040 ergs s-1. Case B recombination requires 8.5 Lyman continuum photons to generate an H photon (Osterbrock 1989), and so the corresponding ionizing photon rate, assuming a covering factor of unity, is (H) = (0.8–2.3) 1052 s-1. By contrast, the ionizing photon rate calculated by assuming an spectrum with = from the Lyman limit to 2 keV and = 0.68 from 2 to 10 keV, is = (1.5–7.4) 1051 s-1, where the range once again reflects the range of probable extinction corrections. Taken at face value, this simplistic calculation suggests that the observed high-energy continuum falls short, by about a factor of 3 to 5, in supplying sufficient ionizing photons to sustain the observed line emission. A possible solution to this apparent discrepancy is to invoke additional extinction for the UV component. Alternatively, the shape of the ionizing continuum through the unobserved extreme-UV region may be quite different from the simple power law that we assumed.
4.3 Comparison with NGC 5033
It is instructive to compare the X-ray properties of NGC 4639 with those of NGC 5033, another nearby, low-luminosity Seyfert 1 galaxy whose optical spectrum is virtually indistinguishable from that of NGC 4639 (Ho et al. 1995, 1997b). The ASCA spectrum of NGC 5033, recently analyzed by Terashima, Kunieda, & Misaki (1999), is well fitted with a lightly absorbed power law with = 1.7, cm-2, and (2–10 keV) = 2.3 1041 ergs s-1 (for an adopted distance of 18.7 Mpc), to which is added a narrow Fe K line with rest energy 6.4 keV. With the exception of the iron line, which may have been detected in the spectrum of NGC 5033 but not in NGC 4639 because the former has significantly more counts, the X-ray spectral properties of the two objects are very similar. As in NGC 4639, moderate variability on a timescale of 104 s was also found in NGC 5033.
Ho et al. (1997b) quote a broad H luminosity of 8.6 1039 ergs s-1. After adjusting this to account for reddening, estimated to be 0.4 mag from the decrement of the narrow Balmer lines, we find (2–10 keV)/ = 8.8, a value once again in accord with the –(2–10 keV) relation of Terashima (1999). We can perform the same exercise we did for NGC 4639 concerning the UV emission, since NGC 5033 was also observed with HST/WFPC2, and it was detected as a compact UV source (Calvani et al., in preparation). The observed flux density at 2500 Å is = 6.3 10-27 ergs s-1 cm-2 Hz-1, which, when combined with the X-ray measurement, yields = 1.2; including a reddening correction of 0.4 mag increases to 1.5. In either case, the UV–X-ray slope lies securely within the range seen in luminous AGNs. The uncorrected luminosity of the broad H line, again determined from the data of Ho et al. (1995), is 1.8 1039 ergs s-1. Even without extinction corrections, the Lyman continuum luminosity predicted from H is only 10%-40% of the ionization budget estimated from interpolating the UV–X-ray continuum ( = 1.0 1052 and 4.1 1052 s-1 for = 1.2 and 1.5, respectively), and including a reddening correction of 0.4 mag still brings the two estimates into comfortable agreement.
5 Summary
Low-luminosity AGNs far outnumber “classical” Seyfert nuclei and quasars, but they remain a poorly understood class of objects. Investigating sources such as NGC 4639, a relatively nearby low-luminosity Seyfert 1 galaxy, may provide valuable clues for understanding the AGN phenomenon in general and for exploring the connections between the “active” and “normal” galaxy populations. The X-ray properties of NGC 4639 were previously discussed by Koratkar et al. (1995) based on ROSAT observations. The present study uses new ASCA data to extend the analysis into hard X-ray energies as well as UV measurements obtained with HST, and we reconsider the overall X-ray properties of this source in light of these new observations.
The nucleus of NGC 4639 was detected as a compact hard X-ray source. The ASCA spectrum can be modeled as a slightly absorbed ( cm-2) power law with a photon index of 1.7 and a luminosity of (2–10 keV) = 8.3 1040 ergs s-1. Inspection of archival Einstein and ROSAT data reveals that the nucleus varies in the soft X-ray band on timescales of months to years, and there is marginal evidence of more rapid (104 s) variability within the ASCA data sets. If the variability is intrinsic to the source and not due to variable absorption, it would rule out the possibility that the power-law component arises from scattering, as was found for NGC 3147 (Ptak et al. 1996). No significant contribution from a thermal plasma with a temperature of 0.7 keV, a trait common in other low-luminosity AGNs, was detected at soft X-ray energies.
NGC 4639, despite being 1–3 orders of magnitude less luminous in the X-rays than most Seyfert galaxies previously studied, exhibits X-ray characteristics that are quite similar to those of more powerful sources. Both the strength of its broad H emission line, measured from ground-based spectra, and its UV emission, measured from HST images, scale with the X-ray luminosity in roughly the same manner as do luminous AGNs. There is a discrepancy of a factor of a few between the ionizing luminosity estimated from the UV–X-ray continuum and that inferred from the luminosity of the Balmer emission lines, but in view of the uncertainties inherent in the assumptions of our calculations, this disagreement is probably not serious. Recent studies have noted key aspects in which low-luminosity AGNs differ from high-luminosity AGNs. Ptak et al. (1998) find, for example, that the rapid variability behavior of low-luminosity objects clearly departs from the trend set by luminous sources. The variability amplitude of NGC 4639, on the hand, appears not to be anomalous. It is also noteworthy that the UV–X-ray spectral energy distribution of NGC 4639, at least as crudely described by the parameter, does not appear to be noticeably different from that of more luminous sources. This is in stark contrast to the set of low-luminosity objects studied by Ho (1999), most of which have X-ray luminosities comparable to that of NGC 4639, whose spectral energy distributions tend to be much more prominent in the X-rays compared to the UV band. NGC 4639 — along with NGC 5033, a source in many ways similar to NGC 4639 that we also briefly discuss — serve as useful reminders that some low-luminosity AGNs appear to be simple extensions of high-luminosity objects.
References
Barr, P., & Mushotzky, R. F. 1986, Nature, 320, 421
Bohlin, R. C., Savage, B. D., & Drake, J. K. 1978, ApJ, 224, 132
Cardelli, J. A., Clayton, G. C., & Mathis, J. S. 1989, ApJ, 345, 245
de Vaucouleurs, G., de Vaucouleurs, A., Corwin, H. G., Jr., Buta, R. J., Paturel, G., & Fouqué, R. 1991, Third Reference Catalogue of Bright Galaxies (New York: Springer)
Elvis, M., Maccacaro, T., Wilson, A. S., Ward, M. J., Penston, M. V., Fosbury, R. A. E., & Perola, G. C. 1978, MNRAS, 183, 129
Filippenko, A. V., & Sargent, W. L. W. 1985, ApJS, 57, 503
Filippenko, A. V., & Sargent, W. L. W. 1986, in Structure and Evolution of Active Galactic Nuclei, ed. G. Giuricin et al. (Dordrecht: Reidel), 21
Gaskell, C. M., & Ferland, G. J. 1984, PASP, 96, 393
Ho, L. C. 1999, ApJ, in press (May 10 issue)
Ho, L. C., Filippenko, A. V., & Sargent, W. L. W. 1995, ApJS, 98, 477
Ho, L. C., Filippenko, A. V., & Sargent, W. L. W. 1997a, ApJS, 112, 315
Ho, L. C., Filippenko, A. V., Sargent, W. L. W., & Peng, C. Y. 1997b, ApJS, 112, 391
Ishisaki, Y., et al. 1996, PASJ, 48, 237
Iwasawa, K., Fabian, A. C., & Nandra, K. 1999, MNRAS, in press (astro-ph/9904071)
Iyomoto, N., Makishima, K., Matsushita, K., Fukazawa, Y., Tashiro, M., & Ohashi, T. 1998, ApJ, 503, 168
Koratkar, A. P., Deustua, S., Heckman, T. M., Filippenko, A. V., Ho, L. C., & Rao, M. 1995, ApJ, 440, 132
Kriss, G. A., Canizares, C. R., & Ricker, G. R. 1980, ApJ, 242, 492
Kwan, J., & Krolik, J. H. 1981, ApJ, 250, 478
Lawrence, A., & Papadakis, I. 1993, ApJ, 414, L85
Mihara, T., Matsuoka, M., Mushotzkym R. F., Kunieda, H., Otani, C., Miyamoto, S., & Yamauchi, M. 1994, PASJ, 46, L137
Murphy, E. M., Lockman, F. J., Laor, A., & Elvis, M. 1996, ApJS, 105, 369
Mushotzky, R. F. 1982, ApJ, 256, 92
Mushotzky, R. F., Fabian, A. C., Iwasawa, K., Kunieda, H., Matsuoka, M., Nandra, K., & Tanaka, Y. 1995, MNRAS, 272, L9
Mushotzky, R. F., & Wandel, A. 1989, ApJ, 339, 674
Nandra, K., George, I. M., Mushotzky, R. F., Turner, T. J., & Yaqoob, T. 1997a, ApJ, 476, 70
Nandra, K., George, I. M., Mushotzky, R. F., Turner, T. J., & Yaqoob, T. 1997b, ApJ, 477, 602
Netzer, H. 1975, MNRAS, 171, 395
Nicholson, K. L., Reichert, G. A., Mason, K. O., Puchnarewicz, E. M., Ho, L. C., Shields, J. C., & Filippenko, A. V. 1998, MNRAS, 300, 893
Osterbrock, D. E. 1981, ApJ, 249, 462
Osterbrock, D. E. 1989, Astrophysics of Gaseous Nebulae and Active Galactic Nuclei (Mill Valley: University Science Books)
Ptak, A., Serlemitsos, P. J., Yaqoob, T., & Mushotzky, R. 1999, ApJS, 120, 179
Ptak, A., Yaqoob, T., Mushotzky, R., Serlemitsos, P., & Griffiths, R. 1998, ApJ, 501, L37
Ptak, A., Yaqoob, T., Serlemitsos, P. J., Kunieda, H., & Terashima, Y. 1996, ApJ, 459, 542
Raymond, J. C., & Smith, B. W. 1977, ApJS, 35, 419
Sandage, A., Saha, A., Tammann, G. A., Labhardt, L., Panagia, N., & Macchetto, F. D. 1996, ApJ, 460, L15
Sandage, A. R., & Tammann, G. A. 1981, A Revised Shapley-Ames Catalog of Bright Galaxies (Washington, DC: Carnegie Inst. of Washington)
Serlemitsos, P., Ptak, A., & Yaqoob, T. 1996, in ASP Conf. Proc. 103, The Physics of LINERs in View of Recent Observations, ed. M. Eracleous et al. (San Francisco: ASP), 70
Tanaka, Y., Inoue, H., & Holt, S. S. 1994, PASJ, 46, L37
Terashima, Y. 1999, Adv. Space Res., in press
Terashima, Y., Kunieda, H., & Misaki, K. 1999, PASJ, in press (Vol. 52)
Turner, T. J., & Pounds, K. A. 1989, MNRAS, 240, 833
Ward, M. J., Done, C., Fabian, A. C., Tennant, A. F., & Shafer, R. A. 1988, ApJ, 324, 767
Weedman, D. W. 1976, ApJ, 208, 30