The WC6 Wolf-Rayet star MLA 1159 in M 31 and its ionization nebula BA 1-642
Abstract
We report on optical imaging and spectroscopic observations of the Wolf-Rayet candidate star MLA 1159 and the surrounding ionization nebula BA 1-642 in the Andromeda Galaxy. Though both objects have been known for many years, our observations (1) confirm the Wolf-Rayet nature of MLA 1159, (2) allow one to determine the nebula as an ionization nebula, and (3) demonstrate the association of MLA 1159 with the nebula. The supersoft X-ray source RX J0045.5+4206 whose error box encompasses the full nebula, seems to be a chance superposition and not related to MLA 1159 and/or BA 1-642.
Key Words.:
stars: Wolf-Rayet – stars: individual: RX J0045.5+4206, MLA 1159 – reflection nebulae – ISM: individual objects: BA 1-6421 Introduction
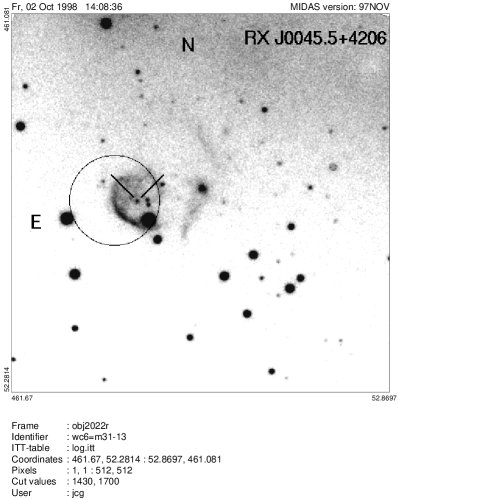
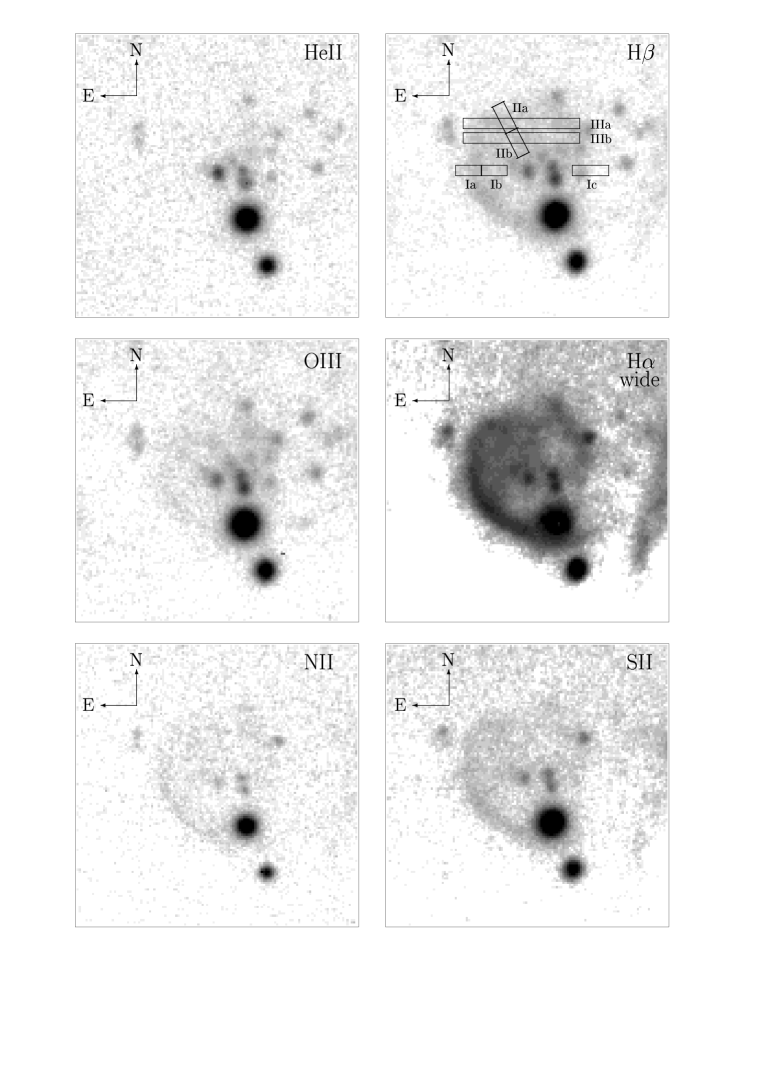
Supersoft X-ray binaries, highly luminous ( ergs s-1) and low-temperature (20–40 eV) X-ray sources, were established as a new class of objects by ROSAT (Trümper et al. 1991, Greiner et al. 1991, van den Heuvel et al. 1992). The archetype supersoft binary, CAL 83, exhibits a 25 pc ionization nebula (Pakull et al. 1989, Remillard et al. 1995). Aimed at identifying supersoft X-ray sources in the Andromeda Galaxy via an ionization nebula we have searched for extended optical emission within the X-ray error boxes of the 15 supersoft sources within M 31 (Greiner et al. 1996). One optical nebula was found (Fig. 1), and we obtained detailed optical data – spectroscopy as well as narrow-band imaging – to determine its relation to the positionally correlated supersoft X-ray source RX J0045.5+4206.
Anticipating the identification of the central star as a Wolf-Rayet star, we will briefly introduce this stellar type and its relation to nebulae before proceeding with the observations. Wolf-Rayet (WR) stars were first identified by their broad emission lines (Wolf & Rayet 1867). These broad emission lines are thought to be indicative of a thick expanding stellar atmosphere. The line widths imply terminal velocities of 1000–3000 km/s, suggesting that the outflowing stellar material is gravitationally unbound. WR stars have typical mass loss rates of a few times 10-5 M⊙/yr and are the most powerful sources of stellar winds among massive early-type stars (Barlow 1982, Abbott & Conti 1987, Maeder & Conti 1994).
A considerable fraction of WR stars, though not all, are surrounded by ring nebula (e.g. Miller & Chu 1993, Marston 1997) which are thought to be leftovers of the evolutionary phase when the massive WR-progenitors stripped off their outer envelopes. Theoretically one would expect two shells around a WR star according to the evolutionary stages, i.e. a large fossil bubble of ISM swept up during the main-sequence stage, and a small bubble of circumstellar material blown away from the WR wind. Follow-up studies of the WR nebulae have shown, however, that not all ring nebulae are wind-blown bubbles consisting of ISM (Weaver et al.1977). In some cases the nebulae contain mostly stellar matter with which the WR wind is interacting, while in other cases the nebulae are ionized by the UV flux of the central WR star.
The population of Wolf-Rayet stars in the Milky Way and the Local Group has been the subject of ample studies (e.g. Massey 1998, Massey & Johnson 1998). It is important not only for the study of each particular star, but also because of their role in stellar evolution as well as their contribution to and interaction with the interstellar matter. It provides also evolutionary information about the galaxies they belong to. There have been systematic searches of WR stars in our Galaxy, the Magellanic Clouds, M 31 and M 33 as well as several other nearby galaxies (e.g. Massey 1999, Massey & Johnson 1998).
M 31 has been surveyed several times with different goals. In an early attempt to establish the existence of gaseous nebulae, Baade & Arp (1964) compiled a list of 688 emission nebula. One of these nebulae, called BA 1-642, is the nebula which we found during our cross-correlation with supersoft X-ray sources. The same object is also listed as PAV78 915 in the catalog of Pellet et al. (1978). A systematic search for WR stars in M 31 was conducted largely by Moffat & Shara (1983, 1987). The central object of this nebula has been classified as a WR star candidate (object MLA 1159; Meyssonier et al. 1993) based on an objective-prism survey of M 31 with a dispersion of 2000 Å/mm in the 4350–5300 Å range.
Here we report the confirmation of this WR star classification and present results of a photometric and spectroscopic study of the WR star as well as the ring-like nebulae surrounding it.
2 Observations and Results
Imaging observations of the region of the X-ray error box of RX J0045.4+4206 (see Fig. 1) were performed during three nights in October 19–21, 1996 with the 1.5 m telescope of the Observatorio Astronómico Nacional (OAN) de San Pedro Mártir (SPM), México, equipped with a 10241024 pixel CCD TEK. The total field of view was 4343. The seeing was typically 15, thus we observed with the CCD chip binned to 22 and with a corresponding pixel scale of 051/pixel. Images were obtained in various filter bands (see Table 1, listing central wavelength, FWHM and peak transmission) to allow a diagnostic of the excitation level. The data reduction used standard MIDAS procedures for bias and cosmic ray subtraction and flat-fielding.
| Name | central wave- | mean | transmission at |
|---|---|---|---|
| length (Å) | width (Å) | central w. (%) | |
| He ii | 4689 | 61 | 59 |
| cont1 | 4772 | 44 | 50 |
| H(narrow) | 4861 | 7 | NA |
| H(wide) | 4871 | 49 | 70 |
| [O iii] | 5016 | 51 | 69 |
| cont2 | 5050 | 50 | NA |
| He i | 5881 | 32 | 62 |
| H(narrow) | 6564 | 11 | 66 |
| H(wide) | 6564 | 72 | 85 |
| cont3 | 6650 | 47 | 64 |
| [N ii] | 6587 | 11 | 62 |
| [S ii] | 6729 | 52 | 60 |
Spectroscopy was performed on two occasions in August 1996 and August 1997, respectively, using the 2.1 m telescope of OAN SPM. The Boller & Chivens spectrograph with a 600 l/mm (1996) and 400 l/mm (1997) grating was employed to get spectra with overall FWHM resolution of 4.5 Å and 6–7 Å. The seeing was typically 15, and consequently a 2′′ slit has been used. The data reduction again used standard MIDAS procedures of the long-slit spectrum reduction package.
Finally, we also observed the nebula with the UNAM Fabry-Perot interferometer PUMA. The Fabry-Perot observations of the nebula BA 1-642 were carried out during the night of November 2, 1997 at the f/7.5 Cassegrain focus of the 2.1 m telescope of the OAN SPM using the UNAM Scanning Fabry–Perot Interferometer PUMA (Rosado et al. 1995).
A 10241024 thinned Tektronix CCD detector, with an image scale of 0.59 arcsec pixel-1, was used with a 22 on-chip binning in both dimensions. Thus, the resulting image format was 512512 pixels, with a spatial resolution of 1.18 arcsec pixel -1.
An interference filter centered at Å and having a bandpass of 20 Å was used in order to isolate the H line. The scanning Fabry-Perot interferometer is an ET-50 of Queensgate Instruments with a servo-stabilization system. The main characteristics of this interferometer are: interference order of 330, free spectral range of 18.92 Å (equivalent to a velocity range of 908 km s-1) and sampling spectral resolution of 0.41 Å (equivalent to 18.9 km s-1) at the wavelength of the H line, achieved by scanning the interferometer gap at 48 positions. Thus, the resulting data cubes have dimensions of 51251248.
Under these conditions, we have obtained one nebular data cube with an exposure time of 48 min. We also obtained two calibration data cubes spaced at the beginning and at the end of the observations in order to check for possible flexures of the equipment. For the calibration cubes we have used the Ne line at 6598.95 Å.
The data reduction and analysis were performed using the specific reduction package CIGALE (Le Coarer et al. 1993). This software was used to remove the cosmic rays, to carry out the wavelength calibration of the data cubes, to obtain continuum subtracted -cubes and to carry out the emission line profile analysis.
2.1 The central star MLA 1159
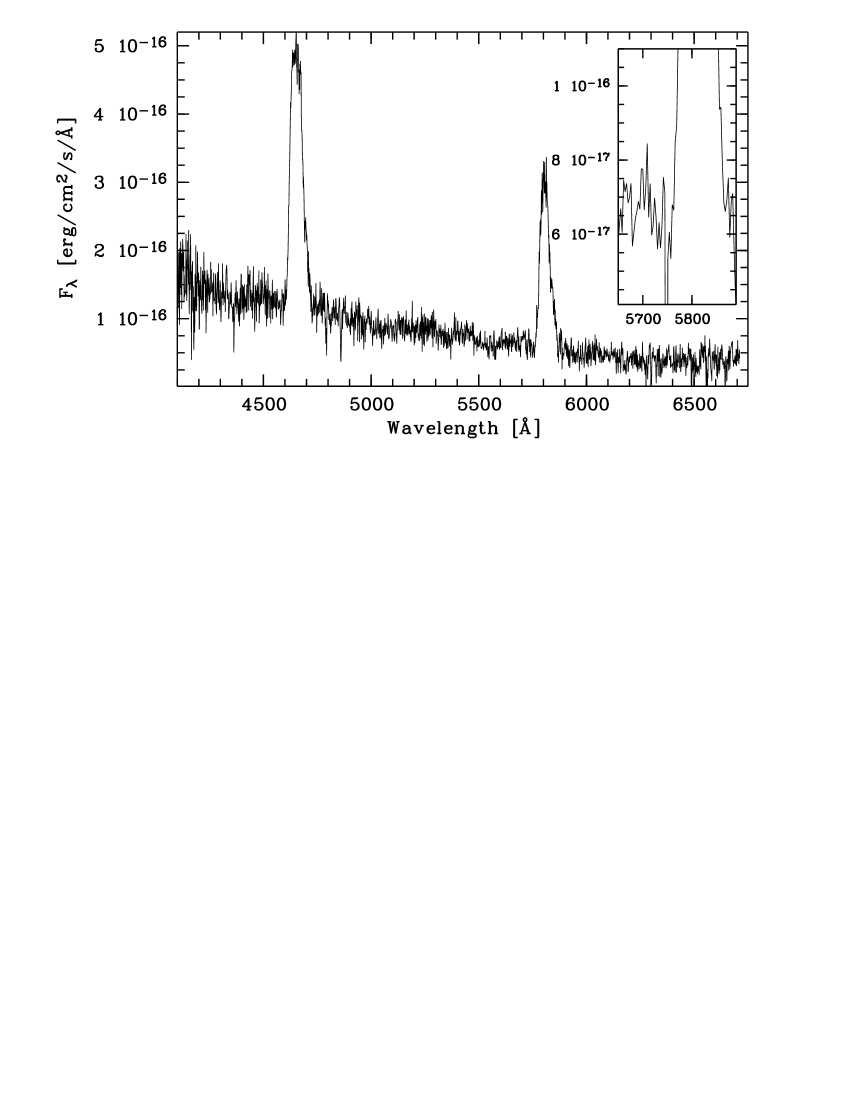
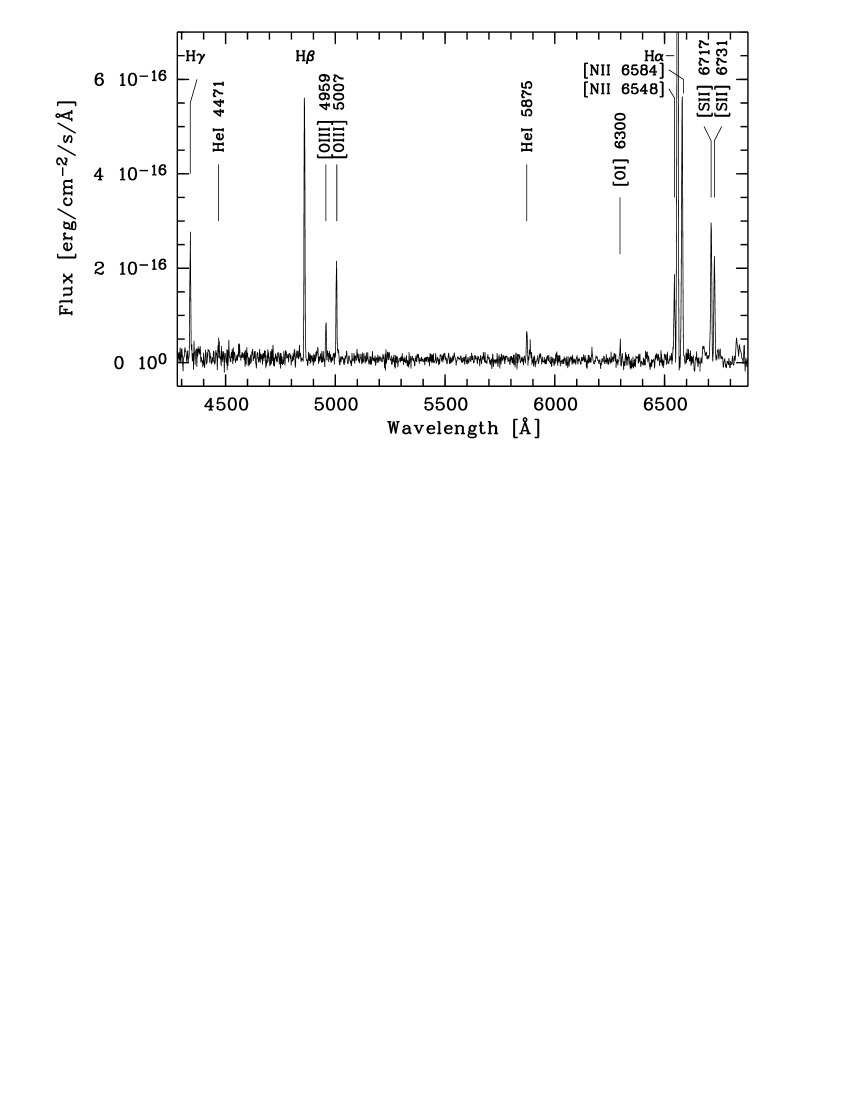
The spectrum of the central star, MLA 1159 (Fig. 2), shows strong and broad emission lines at 4650 Å and 5805 Å (which we interpret as C III and C IV), and clearly suggest a carbon Wolf-Rayet star thus confirming the Wolf-Rayet candidacy proposed by Meyssonier et al. (1993). The ratios of C III 5696 / C IV 5805 1 and C III 5696 / O V 5592 1 identify MLA 1159 without much doubt as WC6 subtype (according to Smith 1968, van der Hucht 1981). The recently proposed refinement of the WC classification scheme (Smith et al.1990, further developed by Crowther et al. 1998) does not alter this result. With a FWHM of the C IV 5805 Å line of Å and , we again arrive at a WC6 subtype (see Table 3 in Crowther et al. 1998).
With a measured = 19.2 mag, using a distance of 650 kpc and assuming only galactic foreground absorption and no intrinsic M 31 extinction, i.e. A=0.6 mag, we derive = –5.70.3 mag, at the bright end of the range of absolute magnitudes of WC5-6 stars of = –3.90.5 mag (Lundström & Stenholm 1984).
We derive a position based on the digitized sky survey of RA. (2000) = 00h45m310, Decl. (2000) = 42°06′57′′ (error of 1′′) which is consistent with the position of MLA 1159 (Meyssonier et al. 1993).
2.2 The nebula BA 1-642 PAV78 915
2.2.1 F–P interferometry
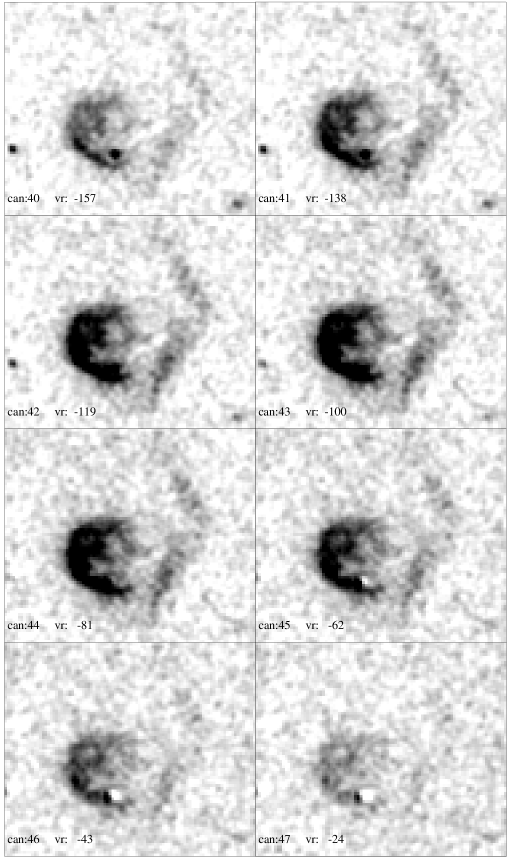
Fig. 3 shows the PUMA -maps corresponding to the velocity channels where the nebula BA 1-642 is detected. We see that it covers a velocity range from Vhelio = –157 km s-1 to –24 km s-1 having maximum intensity at V –100 km s-1. It is interesting to note that other M31 nebulae are also detected in the 10 arcmin field of the PUMA at the same velocities but with a narrower range in velocity. This suggests that BA 1-642 has internal motions larger than the internal motions of classical HII regions.
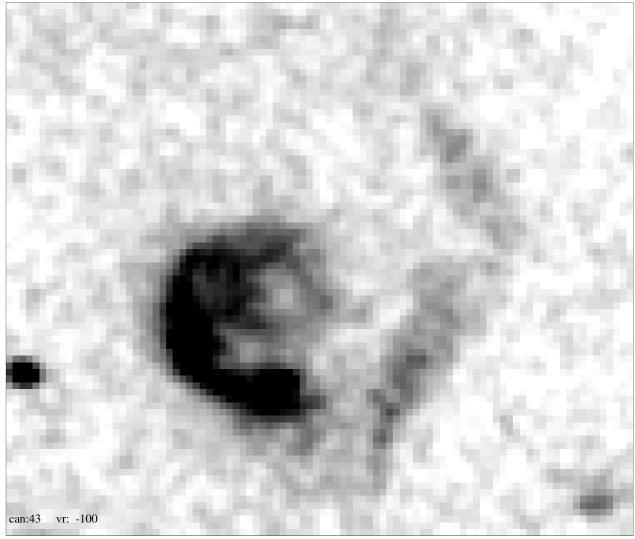
Fig. 4 is an enlargement of one of the velocity channels (at Vhelio = –100 km s-1). The WR star MLA 1159 is located within a nearly circular nebula (see also Figs. 1, 5). The south-east rim of the nebula is very pronounced, particularly in the H line.
However, from this figure we also note, that there is some extended structure on the West and the total complex probably consists of two different sets of nebulosities: a nearly hemispherical internal bubble with an angular size of 3426 arcsec corresponding to a linear size of 10782 pc at the adopted distance of 650 kpc to M31 (this is BA 1-642 PAV78 915) and a V-shaped nebulosity to the West of the internal bubble (note that this part has its own nomenclature, i.e. BA 1-641 PAV78 913). A close inspection of Fig. 4 suggests that this second nebulosity seems to be a thick shell of 74 arcsec in diameter (equivalent to 233 pc) centered at the Northern edge of the internal bubble. The external shell is brighter near the MLA 1159 which is probably photoionizing this nebulosity. The fact that both nebulosities have their maximum intensities in the same velocity channel implies that they would be at the same galactocentric distance and consequently a physical link between them is favored against a chance superposition along the line of sight. The thick shell could be a trace of the photoionization or the interaction with the interstellar medium of the winds of the progenitor of the WR star or other massive stars. Deeper observations are required in order to confirm this hypothesis. In the following we will restrict our kinematical study to the internal bubble.
We have obtained radial velocity profiles integrated in several zones of the bubble, the brightest region of the shell and other HII regions of the field. We confirm that the shell has the same velocity as the borders of the bubble: V –100 km s-1 . Even if our velocity profiles have low S/N ratio (about 4) we are able to detect two heliocentric velocity components for the central region of the bubble: at –83 and –131 km s-1 with an uncertainty of about 4 km s-1. On the other hand, the velocity profiles at the edges of the bubble are simple and can be fitted by a single Gaussian function. This could be interpreted as an expansion motion with a velocity of 25 km s-1. Consequently, we can estimate the kinematic age of the nebula using tkin = 0.6 R/V where tkin is in units of 106 yr, R in pc and V in km s-1 (taken from Weaver et al. 1977 models for the evolution of wind blown bubbles, see also Rosado 1986). Taking R = 54 pc and V = 25 km s-1, we obtain a kinematic age of 2.1 106 yr. This value of the kinematic age is larger than the duration of the WR phase. Thus, this bubble could not be formed by the wind of MLA 1159 (i.e. W-type, Chu 1981, Rosado 1986). Instead, this bubble should be formed by the WR star progenitor and is only illuminated by the WR star (i.e. Rs-type, Chu 1981, Rosado 1986). This is typical for the nebulae associated with WC-type stars.
2.2.2 Narrow-Band Photometry and Spectrophotometry
The shape and the size of the nebula is very similar at different wavelengths (see Fig. 5 with images of the nebula in the six bands He II, H, [O III], H, [N II] and [S II]). The nebula shows strong Balmer emission lines, [O II] and [S II] but weak [O III] (see Fig. 6). We note that the emission lines are all blue-shifted by 3–4 Å, consistent with the above reported velocities.
It is not completely clear whether the ring-like nebula is physically center filled or not, because it shows less emission in the inner parts. Nevertheless, we have measured the size for both the inner and the outer ring based on the pronounced, bright south-east rim visible in the H image to ′′ and ′′, respectively. At the distance of M 31 this corresponds to radii of 34 and 50 pc, respectively.
Using the ratio of [O III] 5007 Å/H as criterion, the excitation class is estimated to be 0.5 according to the system of Feast (1968) and Webster (1975). This and the lack of nebular He II emission lines indicate that BA 1-642 is a low-excitation nebula.
The integrated H line flux in regions Ib and IIb is 310-15 and 210-15 erg cm-2 s-1. The analysis of the H filter image shows that region Ib corresponds to the mean H flux integrated over the full nebula. We therefore scaled the integrated H line flux from region Ib by the fractional area of the extraction region to derive a total H line luminosity of the nebula of 41036 erg/s. This H line luminosity is a few percent of the luminosity of the Wolf-Rayet star, and thus can be produced by the irradiation of the central Wolf-Rayet star.
| Line | Region a | Region b | Region Ic | Region III |
|---|---|---|---|---|
| [O III] 4959 | 0.120.03 | 0.190.06 | 0.180.05 | 0.180.02 |
| [O III] 5007 | 0.380.03 | 0.390.04 | 0.540.06 | 0.460.03 |
| He I 5875 | 0.130.02 | 0.140.02 | 0.120.03 | 0.170.02 |
| [O I] 6300 | 0.01 | 0.03 | 0.03 | 0.060.03 |
| [N II] 6548 | 0.330.02 | 0.320.02 | 0.180.05 | 0.330.15 |
| [N II] 6584 | 1.040.02 | 1.020.03 | 0.780.06 | 0.870.20 |
| [S II] 6716 | – | – | – | 0.450.06 |
| [S II] 6731 | – | – | – | 0.320.05 |
2.2.3 Photoionization modelling
In the following, we derive some constraints from the emission line ratios measured at various locations of the nebula (see Table 2 and Fig. 5). We note that all measured Balmer decrements are consistent with the recombination value or only very small reddening, certainly lower than the global total galactic column density in this direction of cm-2 (Dickey & Lockman 1990) which corresponds to mag. We therefore have not applied a reddening correction.
First, we estimated some of the parameters using diagnostic emission line ratios:
Density via sulphur ratio: The observed ratio of the two sulphur lines can be used to estimate the density of the emission-line gas. The measured intensity ratio [S II]6716/6731 = 1.4 is close to the low-density limit and implies a density of cm-3 (Osterbrock 1989), a value typical for HII regions. In the photoionization calculations described below, the gas density was fixed to this value or varied within a small range of this value (within a factor 2).
Temperature via oxygen ratio: For the inferred gas density, the oxygen intensity ratio [O III]5007/4363 is a useful estimator of the gas temperature. Given that we only have an upper limit for [O III]4363, we derive a corresponding upper limit for the gas temperature of K (Osterbrock 1989). We note that this is not very strict, but again consistent with what is known for HII regions.
Second, we have performed photoionization calculations with the code Cloudy (Ferland 1993). We assumed the gas clouds to be dust-free (except if stated otherwise) and illuminated by the continuum of the central Wolf-Rayet star. The continuum shape was approximated by a blackbody, its temperature left free to vary (since there is no one-to-one match in temperature of a blackbody and a Wolf-Rayet atmosphere). Solar gas abundances (Grevesse & Anders 1989) were adopted if not stated otherwise. The gas was assumed to be ionization bounded. The aim of these photoionization calculations is to reproduce the observed line-ratios, get clues on the ionizing continuum shape (within the limits of the blackbody assumption), decide whether we see a filled volume or shell, derive various properties of the nebula (like ionization parameter, temperature, thickness), constrain abundances, and check for the presence of dust.
We have calculated a large grid of photoionization models varying the ionizing continuum (i.e., ) and the radius (equivalent to the ionization parameter). Test calculations were also performed for different density, metallicity and the presence of dust. The ionization parameter is defined as
| (1) |
where is the number rate of photons above 13.6 eV, is the distance between the Wolf-Rayet star and the emission-line gas, is the hydrogen density and is the speed of light.
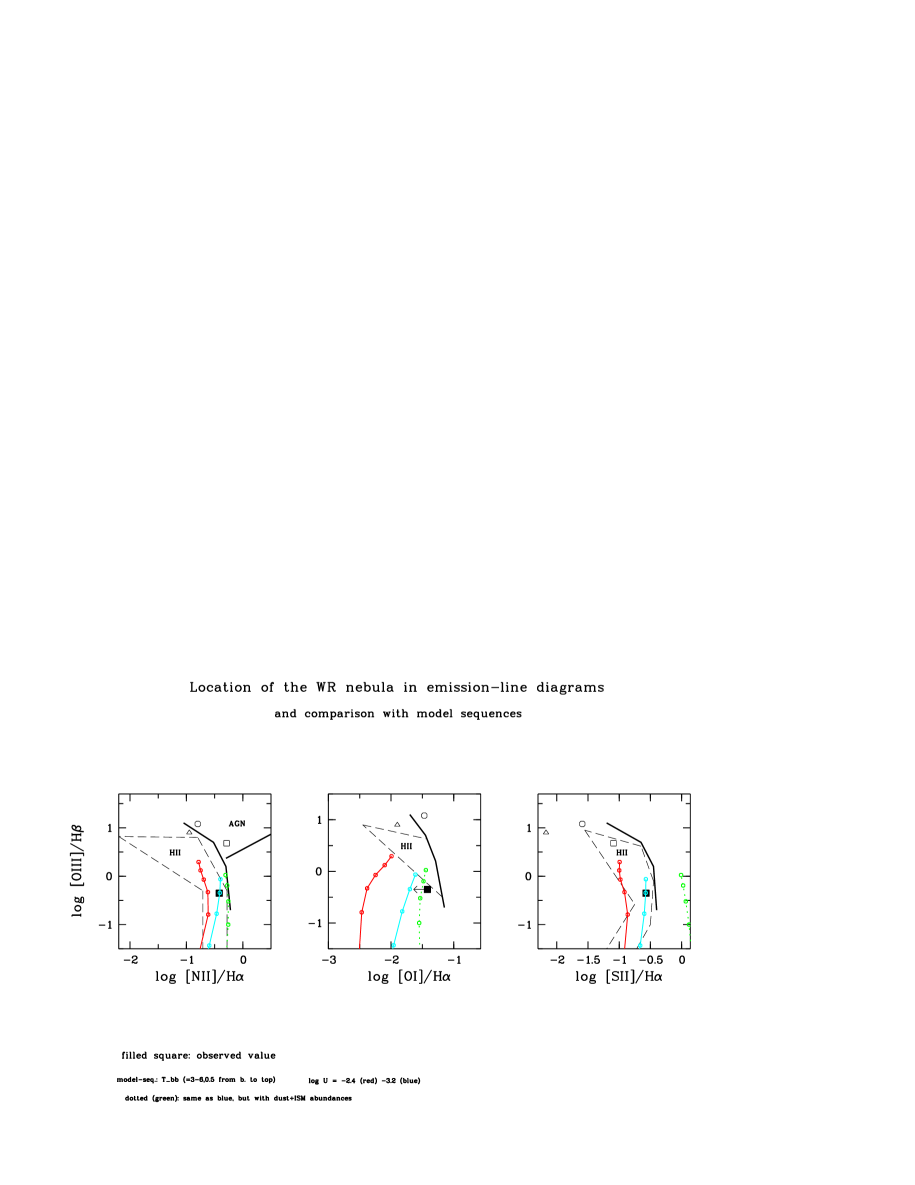
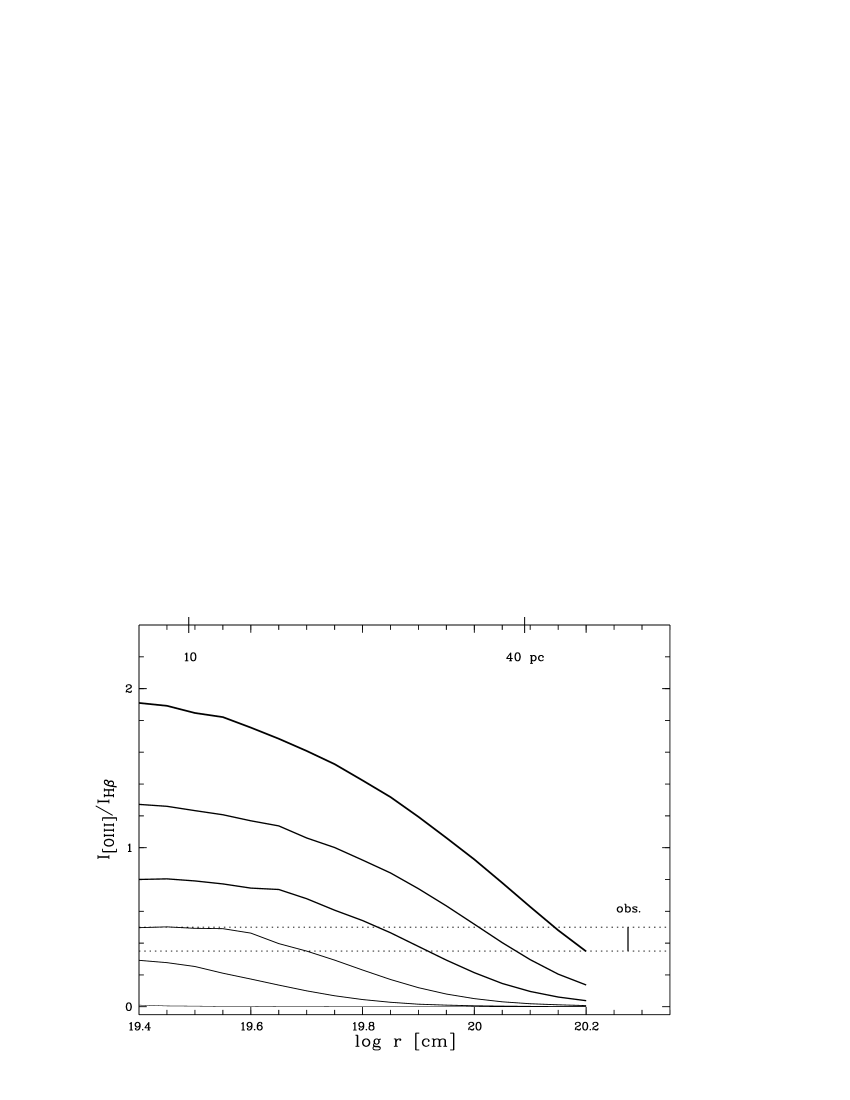
A main observational feature is the relative weakness of [OIII]/H (though well within what is observed in ‘normal HII regions’; cf. Fig. 7). Whereas close distances and high temperatures ( K) significantly overpredict the strength of [O III] (cf. Fig. 8), it is of the order of the observed value for larger distances of the illuminated gas (i.e., lower ionization parameters). Further, we note that the quite substantial change in strengths of some emission lines, particularly [O III], over a distance 1 pc to 40pc serves as argument that we are only seeing a shell of gas, as is also suggested by the visual impression.
We further find that low-ionization lines are underpredicted for small distances (less than a few 1019 cm), i.e., large ionization parameters, consistent with general expectations (e.g. Stasinska 1982, Komossa & Schulz 1997).
| line ratio | region Ib | model (i) | model (ii)(1) |
|---|---|---|---|
| H/H | 2.60 | 2.66 | 2.65 |
| [OIII 4363]/H | 0.02 | ||
| HeI 4471/H | 0.04 | 0.05 | 0.05 |
| [FeIII 4658]/H | 0.03 | 0.03 | 0.02 |
| HeII 4686/H | 0.017 | 0.002 | 0.002 |
| [OIII 5007]/H | 0.35–0.50 | 0.45 | 0.30 |
| [NI 5200]/H | 0.02 | 0.01 | 0.01 |
| HeI 5875/H | 0.15 | 0.15 | 0.15 |
| [OI 6300]/H | 0.08 | 0.05 | 0.05 |
| [NII 6584]/H | 1.05 | 1.04 | 1.00 |
| [SII 6716]/H | 0.45 | 0.41 | 0.43 |
| -3.2 | -3.3 | ||
| Te | 5.8103 | 5.8103 | |
(1) , ; .
In order to simultaneously match the observed strengths of low- and high-ionization lines we require a temperature of K (see Table 3) and an ionization parameter of corresponding to a distance of cm (cf. model (i) of Table 3) for an ionizing (beyond the Lyman limit) luminosity of erg/s and K; or a slightly larger distance if is lowered (cf. model (ii) of Table 3). We also carefully checked that no other, non-observed emission lines are overpredicted by the model.
This model (we used model (i) in the following; see Table 3) then predicts (for a shell of 4 covering) an H-luminosity of LHβ = 31037 erg/s which overpredicts the observed value, i.e. implies a filling factor of less than unity, of the order of 0.1.
Given that both, [N II] and [S II] are correctly predicted by this model, we do not find evidence for a deviation of the Nitrogen abundance from the solar value.
Re-calculating the best-fit model, now including Galactic-ISM-like dust (the species graphite and silicate) but non-depleted (i.e., still solar) abundances, has only weak influence on the resulting emission line spectrum (dust slightly contributes to the heating, but not much, in the present case). However, if additionally the abundances are set to the ISM value (a mean of Cowie & Songaila 1986, as included in Cloudy) the effect is quite strong. Due to the depletion of important coolants, several line-ratios increase in intensity (cf. Fig. 7). The [S II] line becomes particularly strong, which can be partly traced back to the overabundance of sulphur, which happens to be twice the solar value in the employed set of ISM metal abundances. Under the assumptions made, i.e. dust properties and ISM metal abundances, the observed emission lines are better matched for a dust-free environment (or selectively depleted S abundance).
A mean nebular temperature of K is derived for the best-fit (dust-free) model.
The total mass of the nebula amounts to M⊙ assuming a covering factor of 0.1 (see above).
3 Discussion and Conclusion
With the parameters derived above for the luminosity of the WC6 star and the size, density and emission line strength of the nebula it seems reasonable to assume that both are physically connected. The geometrical appearance with the nebula being centered around the WR star supports this conclusion. The nebula itself seems to form a shell and based on the kinematic age and mass is thought to be interstellar matter swept up by the wind of the WR star MLA 1159.
An important question to be addressed is on the mechanism which produces the nebular emission. The lack of filamentary [O III] structures together with a diffuse [O III] emission in seemingly shell geometry and the identical extent of the nebula at different emission lines suggests that the nebula is not shock excited, but rather photoionized. Also, the emission line width and the low density which is similar to that in typical HII regions suggest photoionization as the main origin. Finally, the satisfactory fits obtained with the code Cloudy to explain the relative line strengths implies that photoionization is a reasonable assumption.
Our successful model is characterized by an ionization parameter and it is interesting to note that previous investigations of Wolf-Rayet nebulae (and giant HII regions) found values for the ionization parameter close to as well, with a rather narrow range in (e.g., Esteban et al. 1993, Bresolin et al. 1999) which led to the suggestion that the stellar winds cause a close scaling of ionizing flux and shell gas density (Shields 1986).
We finally note that photoionization modelling employing blackbody continua for the ionizing flux instead of real WR star atmospheres are expected to derive lower temperatures. This is due to the fact that the (He- and) C-rich stellar atmosphere absorbs most of the extreme UV ionizing photons ( 228 Å), thus emitting many fewer UV photons than a blackbody of the same temperature (Koesterke & Hamann 1997).
Because of the original goal of identifying a supersoft X-ray source we mention here that the X-ray source RX J0045.5+4206 is very likely not related to either the WC6 star or the nebula. If RX J0045.5+4206 were within the nebula, it would be the dominant ionization source and produce very strong [O III] emission, i.e. [O III]/H10–20 which is not observed. With a bolometric (blackbody approximation) luminosity of RX J0045.5+4206 of the order of 1037 erg s-1 the X-ray emission is also very unlikely produced by the WC6 star which typically have X-ray luminosities around a few times 1032 erg s-1. Deeper imaging is necessary to identify the counterpart of RX J0045.5+4206 which we now suspect North-East of the nebula BA 1-642.
Acknowledgements.
We thank G.J. Ferland for providing the code Cloudy and the referee, A.F.J. Moffat, for a careful reading of the manuscript. J.G. and St.K. are supported by the German Bundesministerium für Bildung, Wissenschaft, Forschung und Technologie (BMBF/DLR) under contract Nos. FKZ 50 QQ 9602 3 and 50 OR 9306 5. GT acknowledges CONACYT grant 25454-A. The ROSAT project is supported by BMBF/DLR and the Max-Planck-Society. This research has made use of the Simbad database, operated at CDS, Strasbourg. The Digitized Sky Survey was produced at the Space Telescope Science Institute under US Government grant NAG W-2166.References
- (1) Abbott D.C., Conti P.S., 1987, ARA&A 25, 113
- (2) Baade W., Arp H., 1964, ApJ 139, 1027
- (3) Barlow M.J., 1982, in Wolf-Rayet Stars: Observations, Physics, Evolution, ed. C.W.H. de Loore & A.J. Willis (Dordrecht: Reidel), IAU Symp. 99, p. 149
- (4) Bresolin F., Kennicut R.C. Jr, Garnett D.R., 1999, ApJ 510, 104
- Chu (1981) Chu Y.H., 1981, ApJ 249, 195
- (6) Cowie L., Songaila A., 1986, ARA&A, 24, 499
- (7) Crowther P.A., De Marco O., Barlow M.J., 1998, MNRAS 296, 367
- (8) Dickey J.M., Lockman F.J., 1990, ARAA 28, 215
- (9) Esteban C., Smith I.J., Vilchez J.M., Clegg R.E.S., 1993, A&A 272, 299
- (10) Feast M.W., 1968, MNRAS 140, 345
- (11) Ferland G.J., 1993, University of Kentucky, Physics Department, Internal Report
- (12) Greiner J., Hasinger G., Kahabka P. 1991, A&A 246, L17
- (13) Greiner J., Supper R., Magnier E.A., 1996, in Supersoft X-ray Sources, ed. J. Greiner, Lecture Notes in Phys. 472, Springer, p. 75
- (14) Grevesse N., Anders E., 1989, in Cosmic Abundances of Matter, AIP 183, ed. C.J. Waddington, New York: American Institute of Physics, 1
- (15) Koesterke L., Hamann W.-R., 1997, in Planetary Nebulae, eds. H.J. Habing, & H.J.G.L.M. Lamers, Reidel, Kluwer, IAU Symp. 180, p. 114
- (16) Komossa S., Schulz H., 1997, A&A 323, 31
- Le Coarer et al. (1993) Le Coarer E., Rosado M., Georgelin Y., Viale A., Goldes G., 1993, A&A 280, 365
- (18) Lundström I., Stenholm B., 1984, A&AS. 58, 163
- (19) Maeder A., Conti P.S., 1994, ARAA 32, 227
- (20) Marston A.P., 1997, ApJ 465, 188
- (21) Massey P., 1998, ApJ 501, 153
- (22) Massey P., 1999, in New Views of the Magellanic Clouds, IAU Symp. 190, Victoria, Canada, 12–17 July 1998 (in press)
- (23) Massey P., Johnson O., 1998, ApJ 505, 793
- (24) Meyssonier N., Lequeux J., Azzopardi M., 1993, A&A Suppl. 102, 251
- (25) Miller G.J., Chu Y.-H., 1993, ApJS 85, 137
- (26) Moffat A.F.J., Shara M.M., 1983, ApJ 273, 544
- (27) Moffat A.F.J., Shara M.M., 1987, ApJ 320, 266
- (28) Osterbrock D.E., 1989, Astrophysics of Gaseous Nebulae and Active Galactic Nuclei, Univ. Sci. Books: Mill Valley
- (29) Pakull M.W., Motch C., 1989, in Extranuclear Activity in Galaxies, ed. E.J.A. Meurs, R.A.E. Fosbury, (Garching, ESO), p. 285
- (30) Pellet A., Astier N., Viale A., et al. 1978, A&AS 31, 439
- (31) Pena M., Ruiz M.T., Torres-Peimbert S., 1997, A&A 324, 674
- (32) Remillard R.A., Rappaport S., Macri L.M., 1995, ApJ 439, 646
- Rosado (1986) Rosado M., 1986, A&A 160, 211
- Rosado et al. (1995) Rosado M., Langarica R., Bernal A., et al. 1995, RMxAC 3, 268
- (35) Shields G.A., 1986, in Workshop on Model Nebula, D. Pequignot (ed.), Pub. de l’Observatoire de Paris, 225
- (36) Smith L.F., 1968, MNRAS 138, 109
- (37) Smith L.F., Shara M.M., Moffat A.F.J., 1990, ApJ 358, 229
- (38) Stasinska G., 1982, A&AS 48, 299
- (39) Trümper J., Hasinger G., Aschenbach B. et al., 1991, Nat 349, 579
- (40) van den Heuvel E.P.J., Bhattacharya D., Nomoto K., Rappaport S.A., 1992, A&A 262, 97
- (41) van der Hucht K.A., Conti P.S., Lundström I., Stenholm B., 1981, SSR 28, 227
- (42) Weaver R., McCray R.A., Castor J., Shapiro P., Moore R., 1977, ApJ 218, 377
- (43) Webster B.L., 1975, MNRAS 173, 437
- (44) Wolf C.J., Rayet G., 1867, Comptes Rendus 65, 292