Beyond the standard model for the cosmic X–ray background
Abstract
The synthesis model for the cosmic X–ray background (XRB) –based on the integrated emission of Active Galactic Nuclei (AGNs)– is complemented with new observational results. We adopt the most recent estimates of the AGN X–ray luminosity function and evolution. We adopt the column density distribution of type 2 AGNs observed in the local Universe, instead of describing it as a set of free parameters. We maintain the standard assumptions that type 2 AGNs have the same luminosity function –apart from a constant factor– and the same evolution of type 1s, and that the spectral shapes of both types are independent of redshift. We explore various parametrizations of the data, and in all cases we find that the XRB can be fitted, but the number density ratio of type 2s to type 1s must be higher than the local value, and/or the hard X–ray counts in the 2–10 keV band and the preliminary BeppoSAX counts in the 5–10 keV band are underestimated at a level of a few . These results consistently suggest that type 2 AGNs could undergo a faster evolution than type 1s, or other sources with hard X–ray spectra might contribute to the XRB at intermediate or high redshifts.
Key Words.:
X–rays: galaxies – Galaxies: Seyfert – cosmology: diffuse radiation1 Introduction
The cosmic X–ray background (XRB) above keV is the result of the integrated emission of discrete sources, since the contribution of any intergalactic hot medium must be negligible (Wright et al. 1994). In the soft X–ray band from 0.5 to 2 keV the largest fraction of the XRB has already been resolved into sources (Hasinger et al. 1998), most of which turned out to be broad line active nuclei (Schmidt et al. 1998), i.e. Quasi Stellar Objects (QSOs) and Seyfert galaxies of type 1. The spectra of these sources are however too steep to reproduce also the hard XRB at several tens of keV, where the bulk of the energy resides, and a population of objects with flatter spectra is therefore required.
The most popular synthesis models of the XRB are based on the so–called unification schemes for Active Galactic Nuclei (AGNs), where the orientation of a molecular torus surrounding the nucleus determines the classification of the source. At a zeroth–order approximation level, sources observed along lines of sight free from the torus obscuration should have unabsorbed X–ray spectra and optical broad lines (type 1 AGNs), while sources seen through the torus should have absorbed X–ray spectra and appear as narrow line objects in the optical (type 2 AGNs, e.g. Seyfert 2 galaxies).
In this framework type 2 AGNs provide a natural class of sources with X–ray spectra flattened by absorption. The intrinsic X–ray luminosity function (XLF) of type 2 objects is unknown and has been usually assumed to be the same as the one derived for type 1s (e.g. Boyle et al. 1993), apart from a normalization factor. The cosmological evolution has also been taken identical for type 1s and type 2s. Under these assumptions it has been shown that the broad band 3–100 keV spectrum of the XRB can be reproduced by an appropriate mix of unabsorbed and absorbed AGNs (Matt & Fabian 1994; Madau, Ghisellini & Fabian 1994; Comastri et al. 1995, hereafter Co95). The number ratio of type 2 to type 1 objects, as well as the distribution of the absorbing column densities , are key parameters of the models; these have been assumed to be independent of redshift and of intrinsic source luminosity, and have been treated as free parameters in the fitting procedure. Since the overall parameter space of the models is quite large and a good fit to the XRB can be obtained with different set of values, it is important to compare the model predictions with the largest number of observational constraints. Indeed, Co95 showed that the source counts in the 0.5–2 keV and 2–10 keV energy bands, as well as the redshift distributions, could successfully be reproduced by their model.
Very recently an additional set of observational constraints has become available. Deep surveys from ROSAT have extended our knowledge to the low luminosity part of the AGN XLF (Miyaji, Hasinger & Schmidt 1999a, hereafter Mi99a). Contrary to previous results (Boyle et al. 1993; Page et al. 1996; Jones et al. 1997) a pure luminosity evolution (PLE) of AGNs with redshift is no longer consistent with the data, and a luminosity dependent density evolution (LDDE) is required. From the X–ray data of an optically selected sample of Seyfert galaxies Risaliti, Maiolino & Salvati (1999) have determined the distribution for local Seyfert 2 galaxies, pointing out that a significant fraction of sources have columns exceeding cm-2 and are therefore completely thick to Compton scattering. The ratio between type 2s and type 1s has been determined in the local Universe for low luminosity AGNs, i.e. Seyfert galaxies (Maiolino & Rieke 1995), while the existence of a relevant number of high luminosity absorbed sources, the so–called QSO 2s, which is a basic assumption of previous models, is still uncertain (Akiyama et al. 1998). An observational constraint to the QSO 2 number density can be obtained from the infrared source counts. Indeed, QSO 2s are expected to have strong infrared counterparts, since the dust present in the torus should re–emit in the IR band the nuclear radiation absorbed by the gas. The ultraluminous infrared galaxies (ULIRGs) discovered by IRAS are the only local objects with QSO–like bolometric luminosities (Soifer et al. 1986; Kim & Sanders 1998). Thus, even if all ULIRGs were powered by a hidden AGN, the local QSO 2s could not be more numerous than ULIRGs. Finally, source counts in the 5–10 keV band have been derived for the first time by the BeppoSAX satellite with the HELLAS survey (Giommi et al. 1998; Comastri et al. 1999).
In the present paper we test the standard synthesis model to verify if it remains compatible with the new data. These data leave still some latitude to important parameters of the model, and various choices are possible to fit the XRB equally well. However, in all cases we find moderate but consistent evidence that at least some of the standard assumptions have to be relaxed: extra hard spectrum AGNs are needed at intermediate or high redshifts, in addition to those expected in the usual scenario. The additional sources could be analogous to local Seyfert 2s, if they evolve faster than type 1s, or they could be other astrophysical sources not yet enlisted among the contributors to the XRB. We discuss the observations which could distinguish between the alternatives.
Throughout this paper the deceleration parameter and the Hubble constant are given the values and km s-1 Mpc-1.
2 AGN X–ray properties
2.1 The spectra
After the observations of X–ray satellites like GINGA, ASCA and BeppoSAX, different components have been recognized in the X–ray spectra of AGNs. Starting with Sey 1 galaxies, the basic component is a power law with energy spectral index (Nandra et al. 1997a) and an exponential cut off at high energies. A mean value for the –folding energy can probably be set at keV, although the observed dispersion is very high (Matt 1998). Some of the primary radiation is reprocessed by an accretion disc and/or the torus around the nucleus, producing a flattening of the spectral slope above keV, and a strong iron line at 6.4 keV (Nandra & Pounds 1994). Below 1–1.5 keV a radiation excess with respect to the power law emission is detected in a large fraction of Sey 1s (sometimes resulting from a misfit of the “warm absorber” component).
The spectrum of QSO 1s is similar to that of Sey 1s, but there is no evidence for the iron line and the reflection hump to be as common (Lawson & Turner 1997). Assuming that the accretion disc produces most of the line and hump, Nandra et al. (1997b) ascribe these differences to a higher ionization state of the disc in higher accretion rate sources, so that in QSO 1s the spectral features due to photoelectric processes are quenched. Recently, Vignali et al. (1999) have derived a mean spectral slope of from a sample of 5 QSO 1s at redshifts above 2. Although the statistics is poor, this result seems to suggest that the spectra of high redshift QSOs are flatter than those of local ones.
In Sey 2 galaxies the power law is cut off by photoelectric absorption at energies increasing with the column density of the intercepted torus. For highly absorbed objects the X–ray luminosity may be dominated by that fraction of the nuclear radiation which is reflected off the torus surface towards the observer. When cm-2 the obscuring medium is completely thick to Compton scattering and the spectrum is a pure reflection continuum as described by Lightman & White (1988), with a 2–10 keV luminosity about two orders of magnitude lower than that of Sey 1s (Maiolino et al. 1998). On the contrary, when cm-2 the medium is Compton–thin and the spectrum is dominated by the component transmitted through the torus. In the range cm-2 both a transmitted and a reflected component contribute to the observed luminosity, the Circinus galaxy (Matt et al. 1999) being a typical example. Also Sey 2 galaxies often have soft emission in excess of the absorbed power law (Turner et al. 1997). These soft excesses are however two orders of magnitude weaker than those of Sey 1s of the same intrinsic luminosity and their nature is still unclear (probably scattered or starburst radiation).
2.2 The XLF and cosmological evolution
The most recent results about the AGN XLF and cosmological evolution have been obtained by Mi99a by combining data from several ROSAT surveys. Down to a limiting flux of erg s-1 cm-2, reached by the deep survey in the Lockman Hole, they collected a sample of about 670 sources, which is the largest X–ray selected sample of AGNs presently available. The local XLF is described with a smoothed double power law of the following form:
where is the observed 0.5–2 keV X–ray luminosity, ranging from to erg s-1. The best fit values for the cosmology adopted here are: Mpc-3, erg s-1, and .
The XLF has been found to evolve from redshift 0 up to , with an evolution rate which drops at low luminosities according to the factor:
| (3) |
here , and (fixed). The X–ray AGNs have been observed at redshifts up to and there is no evidence for a decline in their space density beyond , unlike what is found in optical (Schmidt, Schneider & Gunn 1995) and radio surveys (Shaver et al. 1997).
We note that the XLF parametrization of Mi99a is a preliminary result and is not a unique representation of the ROSAT data. The extrapolation of the high redshift XLF into the low luminosity range, where few data are available, is not well constrained. Indeed, the number of low luminosity, high redshift AGNs could be higher than the Mi99a representation (Hasinger et al. 1999). Another cause of uncertainty is the possible presence of type 2 AGNs in the Mi99a sample: unlike previous works, where only (optical) type 1 AGNs were included, Mi99a do not discriminate between type 1s and type 2s; some of the latter could then appear in the ROSAT bandpass because of their soft excesses and, for sources at high redshifts, because of the –correction. Objects with type 2 optical spectra are relatively rare in the ROSAT sample (Hasinger et al. 1999). As for the X–ray spectral type, within any given model the raw counts can be corrected for the contribution of the absorbed sources, and these can be subtracted from the XLF: in the following we consider also this approach, and investigate the robustness of our conclusions with respect to the correction. In general, the correspondence between optical and X–ray spectral classification is broadly verified in the local Universe, albeit with some blurring (see Section 2.3); at high redshifts the question is still unsettled.
Previous works about the XLF of AGNs used a PLE model both in the soft X rays, by combining observations from ROSAT and Einstein (Boyle et al. 1993, 1994; Jones et al. 1997), and in the hard X rays from ASCA data (Boyle et al. 1998a). In the Mi99a data the fit with a PLE model is rejected with a high significance. A pure density evolution model is marginally rejected, and LDDE models are preferred, even if several variants are still being discussed.
2.3 The number and column densities of local type 2 AGNs
In the local Universe 5–10% of the galaxies show Seyfert activity (Maiolino & Rieke 1995; Ho, Filippenko & Sargent 1997). From a sample of nearby Seyfert galaxies limited in the B magnitude of the host galaxy, Maiolino & Rieke (1995) derived an estimate for the local ratio of type 2 to type 1 Seyferts. From our point of view Seyfert types 1.8, 1.9 and 2, which have flat X–ray spectra due to absorption by cold gas, can be grouped as type 2 objects, while types 1, 1.2 and 1.5, which have steep X–ray spectra without significant cold absorption ( cm-2), can be grouped as type 1s. Here it is noted that the relation between Seyfert type and X–ray absorption is not univocal. By observing with ROSAT the complete sample of Piccinotti et al. (1982), Schartel et al. (1997) showed that at least a fraction of type 1 AGNs suffer from X–ray absorption by more than cm-2. However this fraction (grouping Seyfert 1, 1.2 and 1.5) is only 20%, and on average their does not exceed cm-2. The inclusion of some moderate–absorption type 1s should not change significantly our results.
By considering Seyfert types 1.8, 1.9 and 2 as type 2s, and Seyfert types 1, 1.2 and 1.5 as type 1s, Maiolino & Rieke found =4.00.9, in agreement with the results of Osterbrock & Martel (1993) and, more recently, Ho et al. (1997).
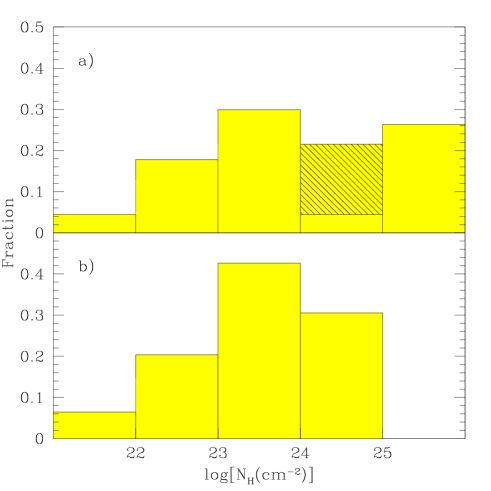
From the Maiolino & Rieke sample Risaliti et al. (1999) have derived a distribution of X–ray column densities for Sey 2s. The selection of the sample by means of optical narrow emission lines, rather than in the X–rays, should avoid biases against X–ray absorbed sources. It turned out that most of the sources are affected by strong absorption, of the objects having cm-2. Furthermore, a significant fraction of sources () are absorbed by cm-2. Their results are shown in Fig. 1 and compared with the distribution assumed by Co95.
In the limited luminosity range of Seyfert galaxies Risaliti et al. (1999) did not find evidence of a correlation between absorption and luminosity. In the wider luminosity domain which includes the QSOs the evidence is contradictory. Recent results from the IRAS 1–Jy survey (Kim & Sanders 1998) show that the space density of ULIRGs at is similar to that of optically selected QSOs of comparable bolometric luminosity. By considering that the number of obscured QSOs cannot exceed that of ULIRGs, and assuming that every ULIRG is powered only by nuclear activity, we can set a conservative upper limit of 2 to the ratio at high luminosities. The actual value of might be significantly lower. Indeed, there is evidence that the fraction of AGN–powered ULIRGs decreases from 50% for IR luminosities erg s-1 to 15% below this value (Lutz et al. 1998), the remaining ones being dominated by starburst activity.
3 The model
3.1 The XRB spectrum
Our models are completely analogous to those of the canonical lineage, the only differences arising from updated input parameters. A key set of such parameters is the one referring to the XLF and its cosmological evolution, and for model A1 we adopt the results of Mi99a. Strictly speaking, the XLF of Mi99a refers to the observed 0.5–2 keV luminosities and could be considered as the 0.5–2 keV XLF in the rest frame only by assuming simple power law spectra with energy index (i.e. zero –correction). Indeed, in the rest frame energy range seen by ROSAT at different redshifts, the spectra of type 1 AGNs assumed in our models do not differ significantly from a power law with . Since we refer the Mi99a XLF to unabsorbed AGNs, without correcting for the contribution of absorbed AGNs to the ROSAT counts, model A1 might be biased in favor of a soft XRB. We discuss the strength of this bias in connection with models A2 and B in the following.
The absorption distribution in type 2 AGNs is no longer derived from best fitting, instead it is taken equal to the local one, as measured by Risaliti et al. (1999). The objects for which only a lower limit is available, cm-2, have been assigned to the bin cm-2.
Because of the evidence that the ratio decreases with the intrinsic luminosity of the AGNs, at least locally, we introduce a change with respect to the canonical scenario: the XLF is divided in two luminosity regions as follows:
with the 0.5–2 keV –folding luminosity set equal to =1044.3 erg s-1, following Miyaji, Hasinger & Schmidt (1999b; hereafter Mi99b). The first and second term represent the XLF of Sey 1s and QSO 1s, respectively, and, apart from the exponential factors, are equal to the Mi99a functions as given in Section 2.2. The XLF of Sey 2s and QSO 2s are and times the XLF of the corresponding type 1 objects. In this parametrization we can explore various hypotheses, including for instance the effects of eliminating altogether the QSO 2s.
Following Co95, and the experimental evidence referred to in Section 2.1, we assume that the basic spectrum for type 1 AGNs is a power law with energy index and exponential cut off with –folding energy keV. Below 1.5 keV the soft excess is modeled with a power law of index 1.3. A reflection component from the accretion disc has been included for Sey 1s with relative normalization (Co95). Beside the disc, we have also included for Sey 1s a torus reflection component which is normalized in accordance with the prescriptions of Ghisellini, Haardt & Matt (1994). In type 1 AGNs the relative contribution of the torus at 30 keV is 29% and 55% for and cm-2, respectively. If we assume that the column density of the torus is approximately the same for all obscured lines of sight, from the measured distribution we find that the torus contributes on the average 28% at 30 keV. The same disc and torus reflection components of Sey 1s have been included also in the QSO spectra: this is against the evidence at low redshifts, but mimics the harder power law seen at high redshifts (Vignali et al. 1999), where most of the XRB is produced. If anything, this assumption tends to reduce the need for additional hard spectrum sources, thus strengthening our results.
Sey 2 spectra have been computed for different amounts of intrinsic absorption (log=21.5, 22.5, 23.5, 24.5, 25.5) to cover all the observed column densities. In the Compton thin regime the adopted spectrum is that of Sey 1s with a photoelectric cut off and a lower amount of disc reflection (, Co95). In this regime the component reflected by the torus does not contribute significantly to the observed radiation (5% at 30 keV for log=23.5, inclusive of orientation effects). For the sources with log=25.5 we have adopted a pure reflection continuum. The normalization of the spectrum is determined so as to reproduce the contribution of thick tori to the flux of Sey 1s (55% at 30 keV) after correcting for orientation effects (Ghisellini, Haardt & Matt, 1994). This approach predicts that the 2–10 keV continuum luminosity of completely Compton thick sources is about 2% of the typical luminosity of Sey 1s, in agreement with the results of Maiolino et al. (1998). A composite reflected/transmitted spectrum has been considered for Circinus–like sources with log=24.5, where the reflected and transmitted components have been normalized in analogy with the previous cases. 111For log =24.5 the effects of Compton scattering begin to be important. We have checked the error introduced by our approximation with respect to the MonteCarlo simulations of Matt, Pompilio & La Franca (1999). The counts remain unaffected, while the model XRB at 30 keV should be reduced by 10–15%, and even more type 2s should be included in order to maintain the agreement with the data.
We have modeled the soft excess of Sey 2s with a power law of index 1.3 and a normalization at 1 keV which is 3% of the primary de–absorbed power law. In analogy with type 1s, the spectra of QSO 2s –if at all present– are assumed to be identical to those of Sey 2s. Finally, we have added to the input spectra an iron emission line at 6.4 keV. Following Gilli et al. (1999) we have considered lines with different equivalent widths according to the spectral absorption, and have not included the iron line in the spectra of QSOs.
In our model A1 we assume , i.e. we do not include QSO 2s. The Mi99a XLF are integrated in the range erg s-1 up to . The contribution of clusters of galaxies has been included by considering thermal bremsstrahlung spectra with a distribution of temperatures. We have adopted the 2–10 keV luminosity vs temperature relation of David et al. (1993), and the 2–10 keV X–ray luminosity function of Ebeling et al. (1997). The cluster XLF is assumed not to evolve, and is integrated in the range erg s-1 up to .
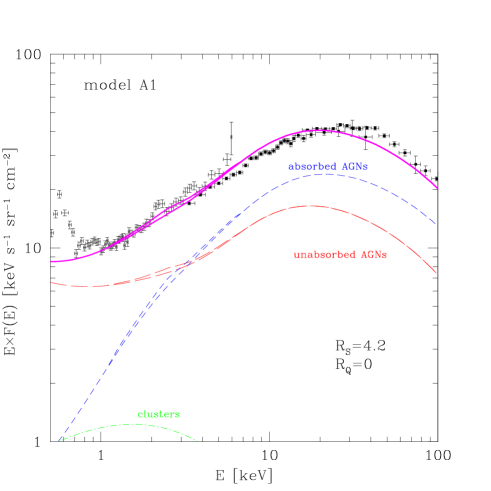
The overall XRB spectrum resulting from the model is shown in Fig. 2 as a solid line, which is the sum of the contibutions of the other labeled curves. In order to fit the observed XRB spectrum we need a ratio , in good agreement with the local value. Above keV, where the XRB is completely extragalactic, the model provides a good fit to the data from ASCA (Gendreau et al. 1995) and the compilation of Gruber (1992) based on HEAO–1 A2 measurements. The contribution of the AGN iron line to the model XRB is found to be less than 7% at in agreement with the results of Gilli et al. (1999) obtained in a different framework (PLE). Clusters of galaxies are found to contribute to the model XRB by at 1 keV, in agreement with the results of Oukbir, Bartlett & Blanchard (1997).
3.2 The X–ray source counts
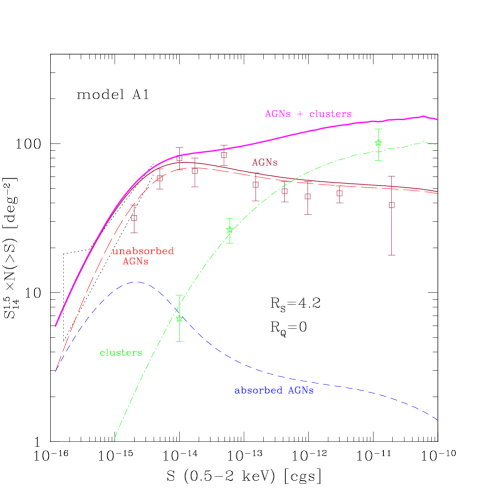
We now compare the predictions of model A1 with the observed source counts in different X–ray bands. The results in the soft 0.5–2 keV band are shown in Fig. 3. The expected AGN counts, which are dominated by unabsorbed sources, agree with the data of Mi99a; the expected cluster counts agree with the data of Jones et al. (1998), Rosati et al. (1995), and De Grandi et al. (1999). Since the XLF and its evolution are derived from the ROSAT counts, this is no more than a self–consistency check; the slight overprediction at low fluxes (30% at erg cm-2 s-1) is due to the –displaced type 2 objects, as anticipated previously.
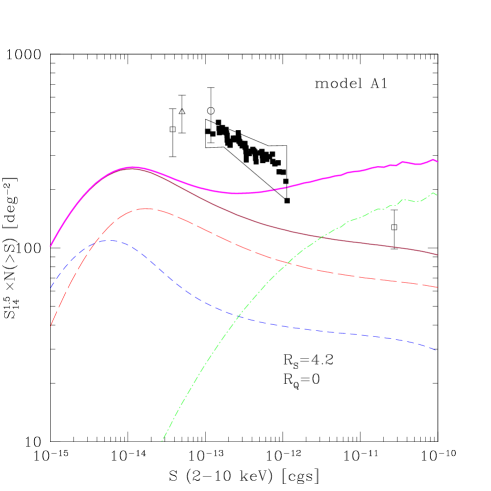
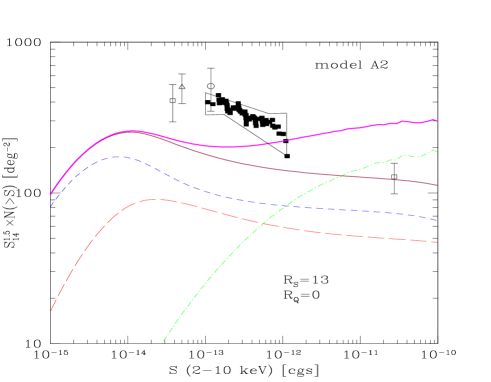
In the hard 2–10 keV band the predictions of the model have to be compared with the results of HEAO–1 A2 (Piccinotti et al. 1982), ASCA (Cagnoni, Della Ceca & Maccacaro 1998; Ogasaka et al. 1998; Ueda et al. 1998) and BeppoSAX (Giommi et al. 1998). At the flux limit of erg s-1 cm-2 Piccinotti et al. (1982) found that AGNs and clusters of galaxies have the same surface density of deg-2. However, the AGN density found by these authors is likely to be overestimated by due to the local supercluster (Co95). As shown in Fig. 4, after the Piccinotti et al. point is corrected by 20%, the model is in agreement with the data within . On the contrary the disagreement cannot be solved at fainter fluxes. At erg s-1 cm-2 the AGN surface density expected in our model is about a factor of 2 lower than the measurement of Cagnoni et al. (1998). This corresponds to a discrepancy. When comparing the model with the data of the ASCA Large Sky Survey (Ueda et al. 1998) the discrepancy is even larger.
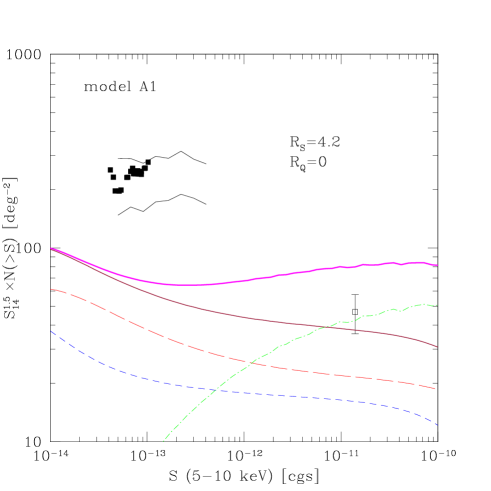
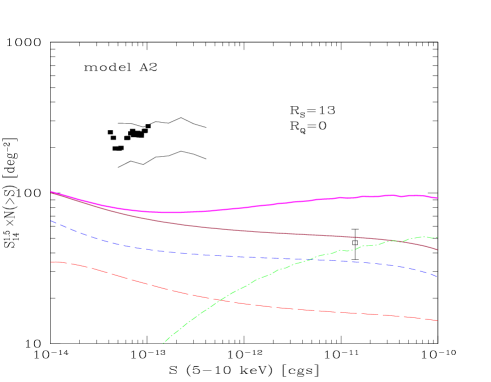
The situation is worse still in the 5–10 keV band. The only available counts in this band are from the HELLAS survey performed by BeppoSAX (Giommi et al. 1998; Comastri et al. 1999). At the flux of erg s-1 cm-2 the observed surface density is deg-2, which is a factor of 4 () above the predictions (Fig. 5).
3.3 Correction for absorbed sources
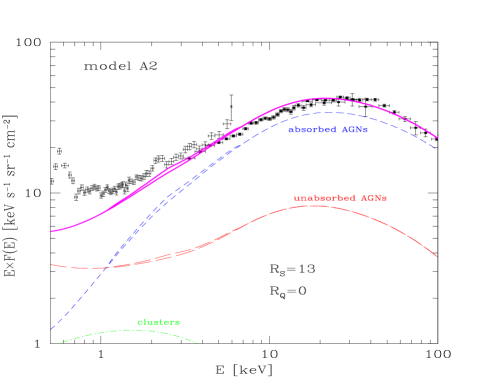
One of the main assumptions of model A1 is that the XLF and evolution derived by Mi99a refer to unabsorbed AGNs. However, as discussed in Sect. 2.2, this is likely not the case. In order to evaluate the effects of our assumption, we have computed a different variant, A2, which adopts the XLF and LDDE of Mi99b. These authors allow self–consistently within their model for the –correction, and for the absorbed sources which, especially at faint fluxes and high redshifts, appear in the ROSAT counts; thus the parameters they provide refer to unabsorbed sources only. Of course, our model is different from theirs, and the self–consistency is lost; however, this is likely to be a higher order effect, and for a first order estimate we can include their parameters in our computation. The results are shown in Fig. 6. Note that around 1 keV the unabsorbed sources produce 30% of the XRB, exactly as in Mi99b. Note also that in order to fit the XRB spectrum a ratio is now required, which is much higher than the local value and implies additional hard spectrum sources. Since the contribution of type 2s has increased with respect to A1, in order to make up for the reduced contribution of type 1s, the mean spectrum of the population producing the XRB is harder, and the discrepancies between the model predictions and the hard counts are somewhat reduced (though not completely eliminated).
4 Discussion
The main difference between models A1 and A2 is the fractional contribution of type 1 AGNs to the XRB; this contribution is dominated by objects close to the XLF break at redshifts close to , and is not well constrained by the data. In the former model 60% of the 1–keV XRB is due to type 1s, so the local value of the type ratio is sufficient to account for the entire XRB; the average spectrum, though, is too soft, and the softness shows up in a marginal discrepancy with the XRB spectrum at keV (Fig. 2), and unacceptable discrepancies with the hard counts (Figs. 4 and 5). In the latter model the type 1s account for only 30% of the 1–keV XRB, and making up the entire XRB requires an much larger than the local value; now the average spectrum is harder, the shape discrepancy disappears and the count discrepancies are reduced (Fig. 6). By extrapolating from these two models we can make qualitative predictions on still different parametrizations of the Mi99a sample: for instance, models adopting density evolution with a dependence on luminosity weaker than Mi99a would predict a type 1 soft X–ray contribution higher than 60%, and would miss the hard counts by factors larger than Figs. 4 and 5. Density evolution with a dependence on luminosity stronger than Mi99b (if at all acceptable) would require , which is already three times the local value.
The main result of our analysis is precisely this one: no matter which variant is adopted for the XLF and the evolution, the models which incorporate the most recent observations within the standard prescriptions always produce some discrepancy. The discrepancy may appear as an underprediction of the observed hard counts, or a type 2 to type 1 ratio higher than the observed local value, but in all cases it points to additional hard spectrum sources at intermediate or high redshifts.
For the sake of completeness, we present in the Appendix a PLE model with (model B): this region of the parameter space is not favored by the most recent data, but was adopted in practically all previous works on the XRB. Note that model B has the same type 1 soft X–ray contribution as model A2 (30%), but the type 2 contribution here is due to higher luminosity sources, which show up in higher flux bins: indeed, the XRB spectrum is well fitted, the counts in the ASCA band are matched, and the discrepancy with the HELLAS counts is reduced to . The cost to be paid is a number density , which –again– is definitely higher than the local upper limit . Irrespective of the plausibility of PLE and QSO 2s, we stress that even model B results in a discrepancy, and the discrepancy is concordant with the results of the other, less controversial variants.
A population of absorbed or hard spectrum AGNs evolving more rapidly than the type 1s could accomodate all the problems discussed above. In this context one should be reminded that the hard counts already resolve 30% of the XRB at fluxes erg cm-2 s-1, so they must converge rapidly just below these values. The optical identifications of the counts in the 2–10 keV and 5–10 keV bands are still largely incomplete. Up to now 34 X–ray sources detected in the ASCA LSS survey (Ueda et al. 1998) have been identified (Akiyama et al. 1998), and 28 objects turned out to be AGNs. They are 22 broad line AGNs (type 1–1.5) with , and 6 type 2 AGNs with . The number of identified sources of the BeppoSAX HELLAS survey is lower, but the distribution of the AGNs seems similar to the ASCA one: 7 broad line QSOs with and 5 Seyferts 1.8–1.9 with (Fiore et al. 1999).
If one accepts these low redshift type 2 identifications, one has to find a physical reason for a convergence so recent in comparison with all other AGNs (BL–Lacs excepted) and star forming galaxies. Alternatively, one could rely on the poor statistics to maintain that the hard counts are mostly due to optically empty fields, containing very absorbed, very powerful sources at redshifts .
There are prospective candidates in both scenarios. In the low– hypothesis one could assume that “normal” Seyfert 2 galaxies evolve more rapidly than type 1s, so that increases with redshift up to the required value. Not only the number ratio, but also the distribution could change with cosmic time (Franceschini et al. 1993). Local Sey 2s are associated with a star formation activity higher than Sey 1 and normal galaxies ( Maiolino et al. 1995; Rodríguez-Espinoza et al. 1986), so this assumption would have interesting implications on the star formation history. One could also invoke Advection Dominated Accretion Flows (ADAFs, Di Matteo et al. 1998) whose luminosity is proportional to , where is the mass accretion rate, and which become normal QSOs at large : thus, they should evolve more rapidly than normal AGNs at intermediate redshifts, and should undergo a change of class at high redshifts. In the high– hypothesis one should resort to ULIRGs, which indeed are absorbed and powerful, and appear to evolve as fast as required [, Kim & Sanders 1998]. As mentioned before there is evidence that the IR emission of ULIRGs is powered both by starburst and AGN processes; Kim, Veilleux & Sanders (1998) and Lutz et al. (1998) find that the fraction of AGN–powered infrared luminous galaxies increases with the bolometric luminosity, and reaches 30–50% in the ULIRG range. While normal starbursts are inefficient emitters in the hard X–rays, obscured AGNs in ULIRGs could easily explain the hard counts.
Finally, it should be noted that the optical identifications of the hard X–ray counts, scanty as they are, suggest that at the given X–ray flux the type 1s are more numerous than the type 2s. Concordant evidence is provided by recent BeppoSAX observations of the Marano field and the Lockman hole (Hasinger et al. 1999): most of the BeppoSAX sources have ROSAT counterparts, which in most cases are optically identified with type 1 AGNs. This type composition is in agreement with the predictions of, for instance, model A1 (Figs. 4 and 5). But if the hard counts in excess of the model are attributed entirely to obscured AGNs, then the predicted type ratio is reversed, with the type 2s more numerous than the type 1s. The numbers involved are too small to draw any conclusion, however they seem to suggest that some of the hard counts are due to flat X–ray spectrum sources with type 1 optical spectra; a few similar sources might have been found already in the ASCA LSS (Akiyama et al. 1998).
Clearly, a decisive progress in this area will require more numerous and more secure identifications of hard X–ray counts; given the various hypotheses, counterparts should be looked for not only at optical wavelengths, but also in the infrared and submillimeter domains, where AGN–dominated ULIRGs should be conspicuous.
5 Summary and conclusions
In this paper we have shown that the standard prescriptions for synthesizing the XRB from the integrated emission of AGNs are not consistent with a number of recent observational constraints, and some of them must be relaxed.
We have worked out models (A1 and A2) which take into account detailed input spectra of AGNs, the distribution observed in local Seyfert 2s, and the XLF and evolution newly determined from the largest ROSAT sample. The latter data do not define a unique parametrization, and the two models explore different variants. As prescribed by the standard model, the XLF and evolution of type 2 AGNs are taken from type 1s, and the spectra of both types are taken independent of redshift; the only fitting parameter is the number ratio of type 2s to type 1s. We find that model A1 reproduces the XRB and the soft counts with a ratio compatible with the local value, but underestimates the hard counts. Model A2 is less discrepant as far as the counts are concerned, but requires a ratio definitely larger than observed locally. We have also computed a model adopting a canonical pure luminosity evolution (model B). In agreement with the results of Co95, model B can reproduce the XRB, the soft X–ray counts and the ASCA hard counts in the 2–10 keV band. It is also consistent within 2 (or discrepant at 2) with the preliminary BeppoSAX counts in the 5–10 keV band. Nevertheless, it requires a number of type 2 QSOs much higher than the local upper limit, and perhaps already ruled out by the deep X–ray surveys.
The discrepancies found in all models are to some extent model dependent, but all of them point in the same direction, and suggest that hard spectrum sources at intermediate or high redshifts are needed in addition to the predictions of the standard scenario. The X–ray spectrum of these additional sources could be flattened by absorption, or could be intrinsically hard. In the former hypothesis reasonable candidate counterparts could be rapidly evolving, “normal” Seyfert 2s. One should also note that a fraction of ULIRGs seem to be powered by AGNs, and their cosmological evolution seems faster than that of unabsorbed QSOs. The alternate hypothesis could instead require the presence of ADAFs. Optical identifications of the hard X–ray sources are still largely incomplete and do not allow yet to decide between the various possibilities.
Acknowledgements.
We are grateful to A. Comastri and G. Zamorani for a careful reading of the manuscript, and to T. Miyaji G. Hasinger and M. Schmidt for permission to use their LDDE model in advance of publication. Our presentation was greatly improved by the comments of the referee, Prof. G. Hasinger. This work was partly supported by the Italian Space Agency (ASI) under grant ARS–98–116/22 and by the Italian Ministry for University and Research (MURST) under grant Cofin98–02–32.Appendix A Comparison with a PLE model
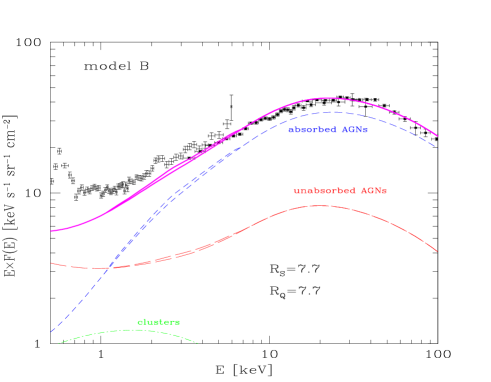
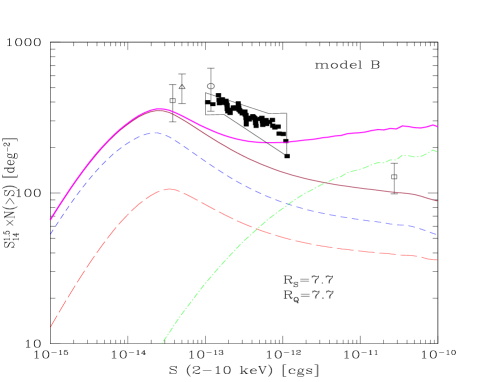
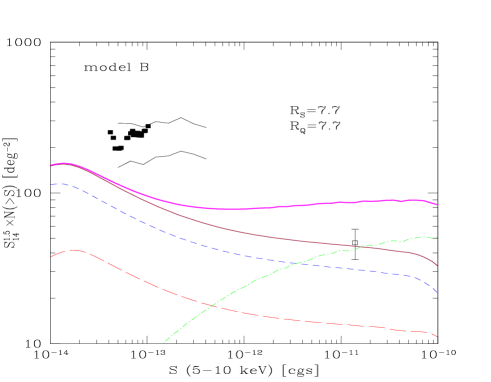
We have computed a canonical synthesis model of the XRB by adopting the XLF and PLE of Jones et al. (1997); since only AGNs with broad optical lines are included, there is no need to correct for the contribution of type 2 AGNs. This sample is smaller than Mi99a, and presumably low luminosity sources at high redshifts are underrepresented. Our model B assumes the XLF and PLE indicated above, includes QSO 2s as numerous as the Sey 2s, and adopts the absorption distribution of Risaliti et al. (1999) at all redshifts and all luminosities. In the cosmology adopted here, model B makes only of the soft XRB with type 1 AGNs, and one needs to fit the overall background (Fig. A1). Due to the large contribution of type 2 AGNs, the model XRB spectrum is very hard. Furthermore, due to the high “effective” luminosity implied by QSO 2s, the ASCA counts are reproduced. The discrepancy with the data in the 5–10 keV band, on the contrary, is not eliminated, although it is reduced to a level. Because of the preliminary nature of the HELLAS data one might debate about its significance. At any rate, one should stress that this marginal result can be obtained only by assuming a strong (a factor 4) differential evolution of QSO 2s with respect to QSO 1s, so that at the former would outnumber the latter by a factor 8.
References
- (1) Akiyama M., Ohta K., Yamada T., et al., 1998, in the Proceedings of ”Science with XMM” [astro–ph/9811012]
- (2) Boyle B.J., Griffiths R.E., Shanks T., Stewart G.C., Georgantopoulos I., 1993, MNRAS 260, 49
- (3) Boyle B.J., Shanks T., Georgantopoulos I., Stewart G.C., Griffiths R.E., 1994, MNRAS 271, 639
- (4) Boyle B.J., Georgantopoulos I., Blair A.J., Stewart G.C., Griffiths R.E., Shanks T., Gunn K.F., Almaini O., 1998a, MNRAS 296, 1
- (5) Cagnoni I., Della Ceca R., Maccacaro T., 1998, ApJ 493, 54
- (6) Comastri A., Setti G., Zamorani G., Hasinger G., 1995, A&A 296, 1 (Co95)
- (7) Comastri A., et al., 1999, Adv. Space Res., in press [astro–ph/9902060]
- (8) David L.P., Slyz A., Jones C., Forman W., Vrtilek S.D., Arnaud K.A., 1993, ApJ 412, 479
- (9) De Grandi P., Böhringer H., Guzzo L. et al., 1999, ApJ, in press [astro–ph/9902067]
- (10) Di Matteo, T., Esin A., Fabian A.C., Narayan R., 1998, MNRAS submitted [astro–ph/9812134]
- (11) Ebeling H., Edge A.C., Fabian A.C., Allen S.W., Crawford C.S., Böhringer H., 1997, ApJ 479, L101
- (12) Fiore F., La Franca F., Giommi P., Elvis M., Matt G., Comastri A., Molendi S., Gioia I., 1999, MNRAS, in press [astro-ph/9903447]
- (13) Franceschini A., Martin–Mirones J.M., Danese L., De Zotti G., 1993, MNRAS 264, 35
- (14) Gendreau K.C., Mushotzky R.F., Fabian A.C. et al., 1995, PASJ 47, L5
- (15) Ghisellini G., Haardt F., Matt G., 1994, MNRAS 267, 743
- (16) Gilli R., Comastri A., Brunetti G., Setti G., 1999, New Astron. 4, 45
- (17) Giommi P., Fiore F., Ricci D., Molendi S., Maccarone M.C., Comastri A., 1998, Nuclear Physics B Proceedings Supplements 69/1–3, 591
- (18) Gruber D.E., 1992, in the Proceedings of “The X–ray background”, eds. X. Barcons & A.C. Fabian A.C. (Cambridge: Cambridge Univ. Press), p. 44
- (19) Hasinger G., 1998, Astron. Nachr. 319, 37
- (20) Hasinger G., Burg R., Giacconi R., Schmidt M., Trümper J., Zamorani G., 1998, A&A 329, 482
- (21) Hasinger G., Lehmann I., Giacconi R., Schmidt M., Trümper J., Zamorani G., 1999, in Highlights in X–ray Astronomy in Honor of Joachim Trümper’s 65th Birthday, MPE Report, (Garching:MPE), in press [astro–ph/9901103]
- (22) Ho L.C., Filippenko A.V., Sargent W.L.W., 1997, ApJ 487, 568
- (23) Jones L.R., McHardy I.M., Merrifield M.R. et al., 1997, MNRAS 285, 547
- (24) Jones L.R., Scharf C., Ebeling H., Perlman E., Wegner G., Malkan M., Horner D., 1998, ApJ 495, 100
- (25) Kim D.–C., Sanders D.B., 1998, ApJS 119, 41
- (26) Kim D.–C., Veilleux S., Sanders D.B., 1998, ApJ 508, 627
- (27) Lawson A.J., Turner M.J.L., 1997, MNRAS 288, 920
- (28) Lightman A.P., White T.R., 1988, ApJ 335, 57
- (29) Lutz D., Spoon H.W.W., Rigopoulou D., Moorwood A.F.M., Genzel R., 1998, ApJ 505, L103
- (30) Madau P., Ghisellini G., Fabian A.C., 1994, MNRAS 270, L17
- (31) Maiolino R., Rieke G.H., 1995, ApJ 454, 95
- (32) Maiolino R., Ruiz M., Rieke G.H., Keller L., 1995, ApJ 446, 561
- (33) Maiolino R., Salvati M., Bassani L., Dadina M., Della Ceca R., Matt G., Risaliti G., Zamorani G., 1998, A&A 338, 781
- (34) Matt G., Fabian A.C., 1994, MNRAS 267, 187
- (35) Matt G., Guainazzi M., Maiolino R., et al., 1999, A&A 341, L39
- (36) Matt G., 1998, in ”High Energy Processes in Accreting Black Holes, eds. J. Poutanen & R. Svensson, in press [astro–ph/9811053]
- (37) Matt G., Pompilio F., La Franca F., 1999, New Astron., submitted
- (38) Miyaji T., Hasinger G., Schmidt M., 1999a, in Highlights in X–ray Astronomy in Honor of Joachim Trümper’s 65th Birthday, MPE Report, (Garching:MPE), in press [astro–ph/9809398] (Mi99a)
- (39) Miyaji T., Hasinger G., Schmidt M., 1999b, Adv. Space Res., in press (Mi99b)
- (40) Nandra K., Pounds K.A., 1994, MNRAS 268, 405
- (41) Nandra K., George I.M., Mushotzky R.F., Turner T.J., Yaqoob T., 1997a, ApJ 477, 602
- (42) Nandra K., George I.M., Mushotzky R.F., Turner T.J., Yaqoob T., 1997b, ApJ 488, L91
- (43) Ogasaka Y., Kii T., Ueda Y., et al., 1998, Astron. Nacht. 319, 47
- (44) Osterbrock D.E., Martel A., 1993, ApJ 414, 552
- (45) Oukbir J., Bartlett J.G., Blanchard A., 1997, A&A 320, 365
- (46) Page M.J., Carrera F.J., Hasinger G. et al., 1996, MNRAS 281, 579
- (47) Piccinotti G., Mushotzky R.F., Boldt E.A., et al., 1982, ApJ 253, 485
- (48) Rodríguez-Espinoza J.M., Rudy R.J., Jones B., 1986, ApJ 309, 76
- (49) Risaliti G., Maiolino R., Salvati M., 1999, ApJ, in press [astro-ph/9902377]
- (50) Rosati P., Della Ceca R., Burg R., Norman C., Giacconi R., 1995, ApJ 445, L11
- (51) Schartel N., Schmidt M., Fink H.H., Hasinger G., Trümper J., 1997, A&A 320, 696
- (52) Schmidt M., Schneider D.P., Gunn J.E., 1995, AJ 110, 68
- (53) Schmidt M., Hasinger G., Gunn J., Schneider D., Burg R., Giacconi R., Lehmann I., MacKenty J., Trümper J., Zamorani G., 1998, A&A 329, 495
- (54) Shaver P.A., Hook I.M., Jackson C.A., et al., 1997, to appear in: ”Highly Redshifted Radio Lines”, eds. C. Carilli, S. Radford, K. Menten, G. Langston, (PASP: San Francisco) [astro–ph/9801211]
- (55) Soifer B.T., Sanders D.B., Neugebauer G., Danielson G.E., Lonsdale C.J., Madore B.F., Persson S.E., 1986, ApJ 303, L41
- (56) Turner T.J., George I.M., Nandra K., Mushotzky R.F., 1997a, ApJS 113, 23
- (57) Ueda Y., Takahashi T., Inoue H., et al., 1998, Nature 391, 866
- (58) Vignali C., Comastri A., Cappi M., Palumbo G.G.C., Matsuoka M., Kubo H., 1999, ApJ, in press [astro–ph/9812176]
- (59) Wright E.L., Mather J.C., Fixsen D.J., et al., 1994, ApJ 420, 450