13CO(1–0) and 12CO(2–1) in the center of the barred galaxy NGC 1530
Abstract
We present 13CO(1–0) and 12CO(2–1) aperture synthesis maps of the barred spiral galaxy NGC 1530. The angular resolutions are respectively and . Both transitions show features similar to the 12CO(1–0) map, with a nuclear feature (a ring or unresolved spiral arms) surrounded by two curved arcs. The average line ratios are 12CO(1–0)/13CO(1–0) and 12CO(2–1)/12CO(1–0). The 12CO/13CO ratio is lower in the circumnuclear ring () than in the arcs (). We fit the observed line ratios by escape probability models, and deduce that the gas density is probably higher in the nuclear feature ( cm-3) than in the arcs ( cm-3), confirming earlier HCN results. The kinetic temperatures are in the range K, but are weakly constrained by the model. The average filling factor of the 12CO(1–0) emitting gas is low, . The cm-radio continuum emission also peaks in the nuclear feature, indicating a higher rate of star formation than in the arcs. We derive values for the CO luminosity to molecular gas mass conversion factor between 0.3 and (K pc2)-1, significantly lower than the standard Galactic value.
Key Words.:
galaxies: structure – galaxies: individual (NGC 1530) – galaxies: ISM – galaxies: kinematics and dynamics – radio lines: galaxies1 Introduction
Except for the 12CO(1–0) line, few detailed maps of the molecular gas distribution in galaxies have been published so far. 13CO(1–0) has been rarely observed in galaxies, and 12CO(2–1) even more rarely. The weakness of the 13CO(1–0) line in galaxies and the technical problems of observing at the 230 GHz frequency of 12CO(2–1) account for this rarity of observations. However, for a better knowledge of the interstellar medium in galaxies, more tracers than 12CO(1–0) must be observed. A crucial issue that can be studied through these observations is the validity of the conversion factor (K pc2)-1 that is valid for self-gravitating molecular clouds (see Sage & Isbell 1991).
13CO(1–0) has been observed with interferometers in only a few galaxies. In IC 342, a galaxy similar to the Milky Way, Wright et al. (1993) showed a variation of the intensity ratio CO(1–0)/13CO(1–0). Those authors interpret 13CO peaks as molecular clouds while 12CO would trace a more diffuse medium. The variations of can be interpreted in different ways (Sage & Isbell 1991, Sakamoto et al. 1997), including variation of gas density, kinetic temperature, and relative abundance of isotopes. Downes et al. (1992) explained these ratio variations by filling factors of clouds varying across the central part of IC 342.
Up to now 12CO(2–1) has been observed mainly in the GMCs of our Galaxy, where the ratio CO(2–1)/12CO(1–0) has a typical value of 1.0 (Plambeck & Williams 1979), indicating gas at low kinetic temperature ( K). Radford et al. (1991) observed a low ratio in infrared-luminous galaxies, indicating the presence of subthermally excited CO. Braine et al. (1993) surveyed of 81 galaxies in the CO transitions, and found a average ratio , indicating cold, optically thick gas. Similarly in the central region of IC 342, Eckart et al. (1990) found a ratio everywhere, with a slightly higher value in the center, possibly indicating an increase in the gas kinetic temperature toward the center. A ratio was found close to a CO arm, indicating warm gas heated by star formation. The starburst galaxy M82 shows a different behaviour, with an unusually high ratio (Knapp et al. 1980, Loiseau et al. 1990), indicating hot gas (K) heated by star formation.
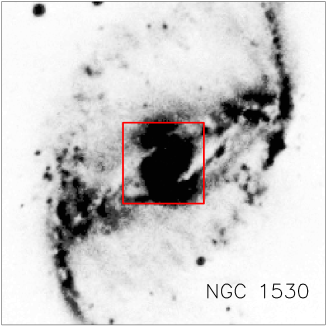
We have observed in the 13CO(1–0) and 12CO(1–0) lines the central region (kpc) of the barred spiral galaxy NGC 1530. This galaxy contains large amount of molecular gas in its central kiloparsec, due to the accreting action of its bar (cf models by Athanassoula 1992, Friedli & Benz 1993, Piner, Stone, & Teuben 1995). The bar has driven a high fraction () of the total gas of the galaxy into the center (Downes et al. 1996, DRSR hereafter). CO(1–0) has been extensively studied in this galaxy (Regan et al. 1995, DRSR, Reynaud & Downes 1997 (RD 97), Reynaud & Downes 1998). RD 97 also mapped HCN(1–0), showing that the dense gas as traced by HCN is mainly concentrated in a nuclear ring or unresolved spiral at galactic radius kpc. This concentration of dense gas is connected with the presence of an inner Lindblad resonance at radius kpc.
The ionized gas was mapped in H by Regan et al. (1996). Greve et al. (1999) compared the distribution and kinematics of ionized and molecular gas in the bar of NGC 1530.
2 Observations, Data reduction
The observations were made with the IRAM interferometer on Plateau de Bure, France, with four 15m antennas (Guilloteau et al. 1992) between November 1995 and April 1996. Each antenna of the interferometer was equipped with a dual channel receiver tuned to frequencies 109.3 GHz and 228.7 GHz, corresponding to 13CO(1–0) and 12CO(2–1). The tracking center of the interferometer was , (J2000), close to the nucleus of the galaxy. The recession velocity of the galaxy is . See DRSR for a table with the astrophysical parameters of the galaxy.
The interferometer was used in 3 configurations, giving baselines between 20m and 180m. After Fourier transform of the visibilities and restoration by the CLEAN algorithm, we obtained channel maps of both transitions with a velocity width. The observational parameters are summarised in Table 1, including the clean beam parameters and the final noise in channel maps.
| Parameter | 13CO(1–0) | 12CO(2–1) |
|---|---|---|
| Frequency (GHz) | 109.3 | 228.7 |
| Calibrator flux (Jy) a | 1.1 | 0.5 |
| Beam (FWHM) | ||
| Beam (p.a.) | ||
| (K/Jy) | 10.4 | 9.0 |
| r.m.s. noise (mJy beam-1) b | 1.5 | 5.0 |
| a Source=0224+671 | ||
| b Noise in channels | ||
3 Observational Results
3.1 Molecular maps
Figure 1 shows the integrated 13CO(1–0) and 12CO(2–1) of the inner of NGC 1530. In the same figure are also displayed for comparison the integrated 12CO(1–0) and HCN(1–0) maps from RD 97. The integration ranges are respectively (12CO(1–0)), (12CO(2–1)), (13CO(1–0)), and (HCN(1–0)). Each map is corrected for the primary beam attenuation. The primary beams (FWHM) are respectively (12CO(1–0)), (12CO(2–1)), (13CO(1–0)), and (HCN(1–0)). These maps are centered on the dynamical center of the galaxy, which has coordinates , (J2000) (from RD 97), i.e. from the tracking center of the interferometer.
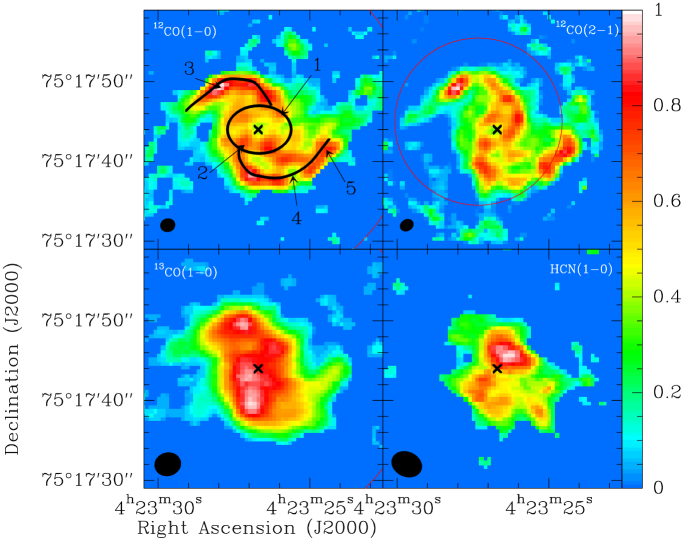
The 12CO(2–1) map is truncated beyond a diameter of . Structures visible at the truncation limit are probably real molecular clouds deformed by the high noise level, since the noise is amplified by the primary beam correction. The two transitions of 12CO give similar maps, with two arcs, and inside them, a central structure which is a ring or unresolved nuclear spiral arms. These two maps have similar resolutions, and for 12CO(1–0) and 12CO(2–1) respectively. The 13CO(1–0) map is grossly similar to the 12CO maps, with a beam twice as large (). However the arcs seem dimmer in 13CO than in 12CO. There is a real difference between the brightness of the arcs and the brightness of the nuclear feature, a difference which had already been detected in HCN (see Fig. 1 and Fig. 3 of RD 97). The difference is confirmed on the ratio map obtained by smoothing 12CO(1–0) to the resolution of 13CO(1–0) (Fig. 5).
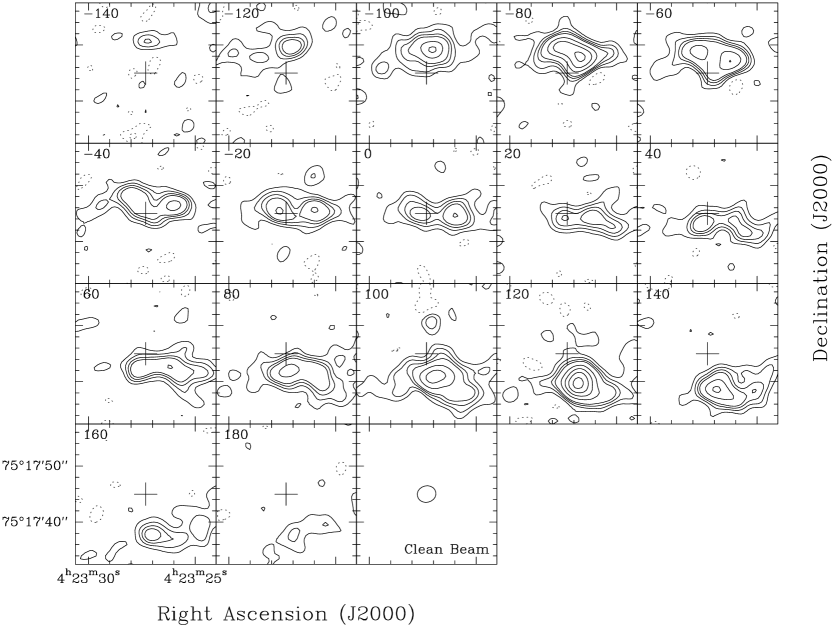
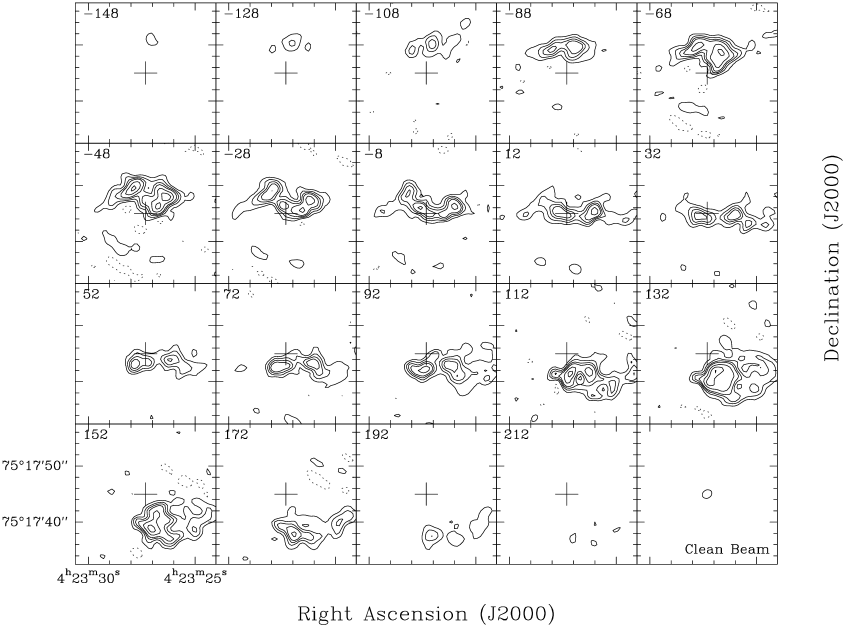
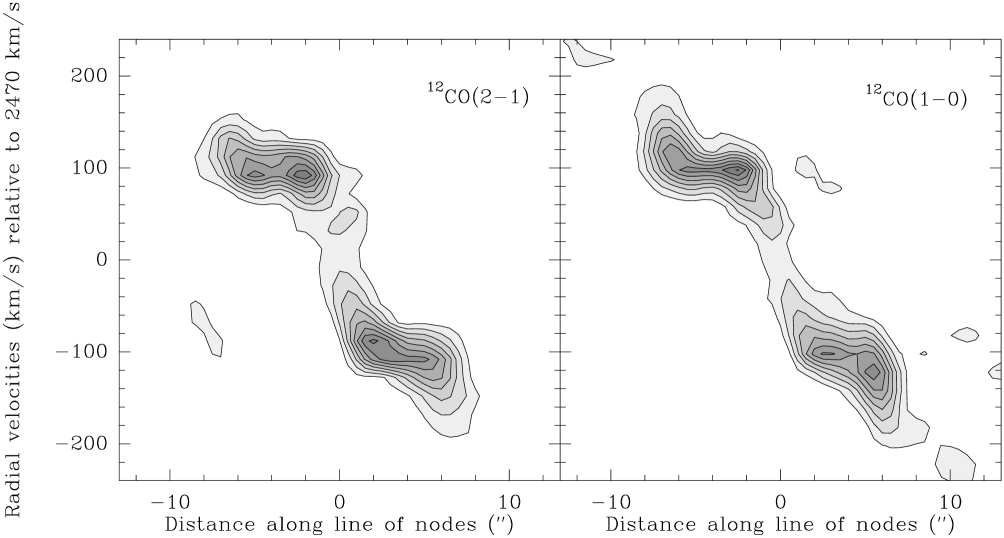
Figure 2 shows the channel maps of the 13CO(1–0) emission. Figure 3 shows the channel maps of the 12CO(2–1) emission. These maps are not corrected for the primary beam attenuation. The kinematic pattern shown by these maps is the same as that found by RD 97 in the 12CO(1–0) transition. That is, the kinematics of the gas in the arcs shows large () infall motions (due to the orbits along the bar) and in the central feature shows mainly circular rotation or weakly elliptical orbits (the orbits normal to the bar). Figure 4 shows position-velocity diagrams in the CO(2–1) (left panel) and the CO(1–0) (right panel) transitions. These diagrams are cuts in the data cube, along the line of nodes passing through the dynamical center. The circular component is therefore the only component of the velocity field detected on these diagrams. The maximal radius of the emission is 1.4 kpc. The diagrams are very similar in the two transitions of CO, with a steep rising part in the central region and a flattening of the rotation curve at the crossing of the nuclear feature (incomplete ring or spiral within a diameter of the nucleus). Outside this region, the rotation curve is steep (see Fig. 4 at radii of ).
3.2 Line ratios
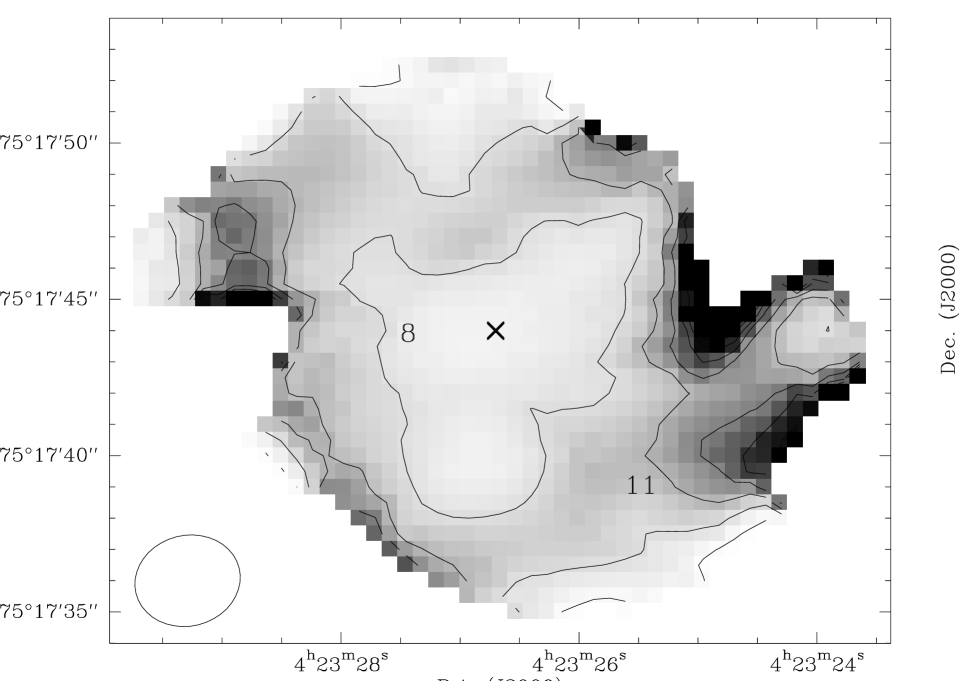
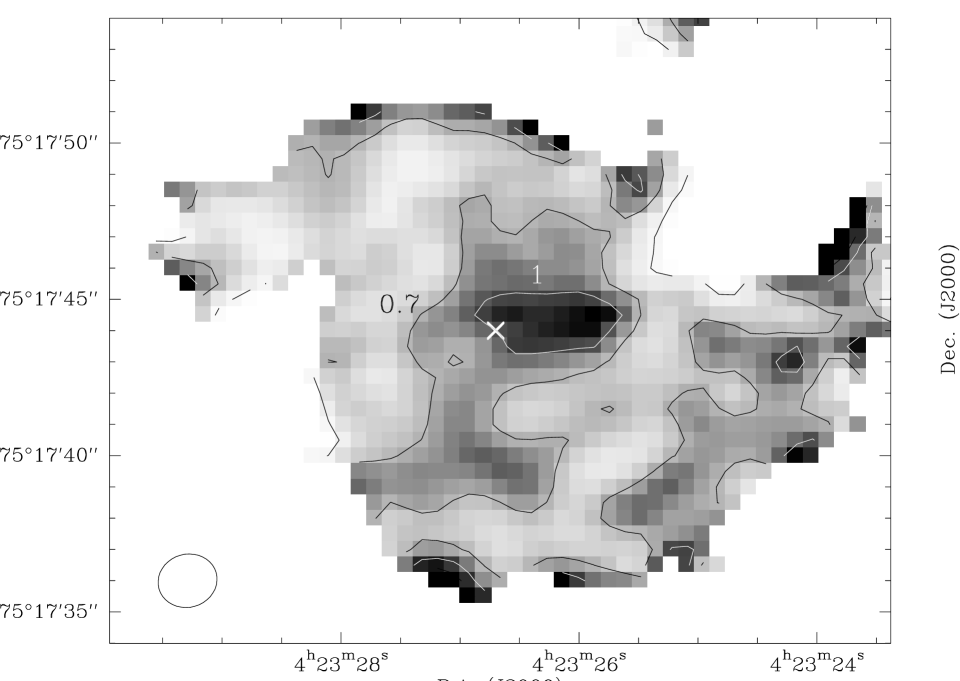
For a quantitative analysis of the previous maps, we made maps of the ratios of the various integrated intensities, corrected for their respective primary beams. This correction makes the noise non-uniform through the ratio maps, especially in the 12CO(2–1) transition. Figures 5 and 6 show the ratios 12CO(1–0)/13CO(1–0) and 12CO(2–1)/12CO(1–0) respectively. Each ratio map was made by smoothing the map with the higher resolution to that of the lower-resolution map.
Ratio map CO(1–0)/13CO(1–0) : The resolution is . 13CO(1–0) is detected in the same places as 12CO(1–0), so the ratio can be studied in the entire CO nuclear disk. The average value is . The ratio is about 6 to 8 in the central zone (inside the two CO arcs), with the lowest value () near the center of NGC 1530. The value is 11 to 15 in the arcs, with a maximum value of 15. The spatial distribution of dense gas ( cm-3) is best shown in the HCN map (see Fig. 1). The ratio CO/HCN is 7 to 10 in the central ring of NGC 1530 (between the two arcs), while in the arcs this ratio is larger, in the range 14 to 30. The 12CO(1–0)/13CO(1–0) ratio thus seems to have the same characteristics as the CO/HCN ratio.
Ratio map CO(2–1)/12CO(1–0) : The resolution is . The ratio can be studied in the entire disk with a high signal-to-noise ratio. The average ratio is . The ratio is over a large region wide, with the dynamical center of the galaxy on the eastern edge of this region (see Fig. 6). The maximum value is , at a position west of the dynamical center. Between the two arcs, the ratio is generally . In the northern arc, the ratio is 0.4 to 0.7 while in the southern arc it is 0.5 to 1.1.
3.3 Radio continuum maps
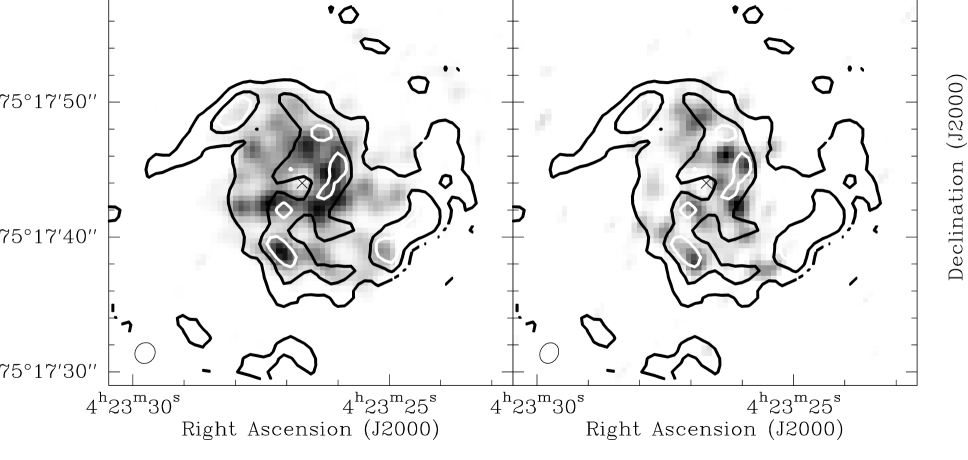
NGC 1530 was observed with the Very Large Array111The VLA is a facility of the National Radio Astronomy Observatory. (VLA) in a snapshot mode. Saikia et al. (1994) show the 20 cm emission map made with uniform weighting. Figure 7 shows the same data, at 20 and 6 cm, in maps obtained with natural weighting, which allows maximum sensitivity. Superposed on the cm maps are a few contours of the 12CO(2–1) distribution. The beam sizes are (p.a. ) at 20 cm and (p.a. ) at 6 cm, both similar to the beam at CO(2–1). The emission peaks are at 20 cm and at 6 cm, so the detected features are not prominent in the maps. The 20 cm distribution has two types of emission : a weak () emission over most of the molecular disk, and a number of compact components, unresolved by the interferometer. These components are mainly distributed along a ring, around a central cavity. The radius of this ring is about , i.e. 500 pc. This ring coincides with the one obtained in the 12CO(2–1) and 12CO(1–0) lines. A strong component is detected south of the dynamical center. It coincides well with a CO compact component. The 6 cm map shows with a lower signal-to-noise ratio the same distribution as the 20 cm map, i.e. a strong ring distribution.
For the central of NGC 1530, integrated fluxes are 30 mJy at 20 cm and 8.6 mJy at 6 cm (integration threshold : ). The galaxy emits a total of 80 mJy at 20 cm and 37 mJy at 6 cm (Wunderlich et al. 1987, Condon et al. 1996). Thus and are emitted in the central (i.e. 5 kpc along the major axis) of NGC 1530. The 500 pc ring shares about of the central centimeter continuum emission, which is more than the 12CO(1–0) share of this ring, about 1/3 (RD 97). From the fluxes at 20 cm and 6 cm, we computed a spectral index of , which indicates that the synchrotron emission is predominant in these maps. There is a high star formation rate in the central part of NGC 1530, giving rise to radio continuum emission via synchrotron emission from supernova remnants. These supernova remnants give rise to most of the compact sources in the cm maps.
4 Discussion
4.1 Physical conditions of the gas
The previous maps reveal two main features for the molecular gas (also RD 97) : a) Two intense arcs in both 12CO lines and with little HCN; b) A nuclear ring or spiral with strong HCN and 13CO(1–0). The radio continuum maps show a distribution similar to HCN, an intense ring and weak arcs.
To discuss these results more quantitatively, we chose five regions in the nuclear disk of NGC 1530, and calculated the various line ratios for these regions. Figure 1 shows these regions on the 12CO(1–0) map. Table 2 gives their coordinates and the line ratios, along with the intensity of 12CO(1–0) and fluxes from the cm maps convolved to a gaussian for a better signal to noise ratio. We now relate the kinematics and the physical conditions of the gas in these regions.
| Region | R.A. a | Dec. | b | c | d | Spectral Index | |||
| (s) | (′′) | (K ) | (mJy beam-1) | (mJy beam-1) | |||||
| 1 | 26.0 | 45.5 | 183 | 0.91 | 6.9 | 8.0 | 1.87 | 0.78 | |
| 2 | 27.0 | 42.0 | 206 | 0.77 | 6.9 | 13.0 | 1.77 | 0.63 | |
| 3 | 28.0 | 49.0 | 273 | 0.67 | 9.9 | 28.8 | 0.78 | 0.30 | |
| 4 | 25.5 | 38.0 | 104 | 0.82 | 8.9 | 14.1 | 1.09 | 0.51 | |
| 5 | 24.7 | 40.5 | 168 | 0.76 | 14.9 | 0.52 | 0.12 | ||
| a Coordinates (J2000): ; | |||||||||
| b 12CO(1–0) integrated intensity | |||||||||
| c Line ratios 12CO(2–1)/12CO(1–0), 12CO(1–0)/13CO(1–0) and 12CO(1–0)/HCN(1–0) | |||||||||
| d 20 cm, 6 cm fluxes in diameter lobes | |||||||||
Regions 2, 3 and 5 correspond to local maxima of 12CO(1–0) and 12CO(2–1) emission. Region 1 is a local maximum of 12CO(2–1) and HCN(1–0) while region 4 corresponds to a local minimum of 12CO(1–0) and 12CO(2–1). These regions are typical of the differing conditions in the nuclear disk. We have compared the location of these five regions with a CO(1–0) velocity map from RD 97. Regions 1 and 2 correspond to a nearly circular rotation of the gas, as they are at the contact point between the arcs and the nuclear ring. They are close to the dynamical center, at a radius of 0.7 kpc. Regions 3 and 4, at radii of 1.7 kpc, correspond to transition points in the kinematics, a transition between infall motions (in the CO arcs) and circular rotation (in the ring). Region 5 is further out in the southwest arc, at a 3 kpc radius. The motion of this region has an infall component of . This infall motion is associated with the density wave of the arc (RD 97).
The molecular ratios seem normal in the nuclear disk of NGC 1530. We compare the central kpc of NGC 1530 to the center of the spiral galaxy IC342 which probably contains a weak bar (see Downes et al. 1992, Wright et al. 1993). IC 342 is one of the rare galaxies which has been observed in several different molecules with interferometers. IC 342 shows straight regular 12CO(1–0) lanes (Wright et al. 1993, their Fig. 2b) that are curved near the nucleus, similarly to NGC 1530. The lanes emit in 13CO(1–0) (Wright et al. 1993, their Fig. 2b) but not in HCN(1–0) (Downes et al. 1992, their Fig. 1); in these two transitions one finds five 50 pc diameter clumps at the places where the lanes curve toward the nucleus. These clumps are not prominent in 12CO(1–0). is 4.4 in these clumps and in the CO lanes. Similarly, is 7 in the clouds and in the CO lanes. Therefore the results seem similar for both galaxies, with ratios and lower near the nucleus ( pc for IC342, pc for NGC 1530). The places where the CO lanes become a nuclear ring or spiral show large emissivity in 13CO(1–0) and HCN(1–0), which can be interpreted as the sign of a high concentration of dense gas (see, e.g., Downes et al. 1992, Mauersberger & Henkel 1993).
| Region | a | b | c | d | e | f |
|---|---|---|---|---|---|---|
| (cm-3) | (K) | (K) | (K) | |||
| 1 | 8.2 | 51 | 2.7 | 32.3 | 0.08 | 1.2 |
| 2 | 4.7 | 20 | 2.6 | 12.8 | 0.2 | 2.3 |
| 3 | 3.1 | 18 | 3.2 | 9.8 | 0.3 | 2.0 |
| 4 | 4.5 | 40 | 1.5 | 20.6 | 0.07 | 1.1 |
| 5 | 2.1 | 85 | 2.1 | 16 | 0.13 | 0.35 |
| a H2 density | ||||||
| b Model kinetic temperature | ||||||
| c Observed 12CO(1–0) brightness temperature | ||||||
| d Model 12CO(1–0) brightness temperature | ||||||
| e Area filling factor of molecular clouds | ||||||
| f Conversion factor (in (K pc2)-1) computed | ||||||
| from (CO(1–0)) | ||||||
We supposed that the 12CO and 13CO transitions are emitted by the same masses of gas. Therefore we could run escape probability models, to reproduce the observed line ratios of CO. We assumed the following values for the abundance ratios : [12CO]/[H2] and [12CO]/[13CO]. We assumed a velocity gradient of km s-1 pc-1. Table 3 displays the results of the best fitting model. We deduced from this model the expected H2 density and kinetic temperature of the emitting gas for each region. Then we could derive the theoretical brightness temperature and obtain a filling factor by computing the ratio . We computed also for each one of these 5 regions the CO to H2 conversion factor, using the formula (CO(1–0)), in units of (K pc2)-1 (Radford et al. 1991). This formula is valid for an ensemble of virialized molecular clouds, which is the case here.
The derived kinetic temperatures are standard values for the molecular gas, between 20 and 90 K. This kinetic temperature is weakly constrained by the escape probability calculations, and the error bars of the measured ratios do not allow a precise derivation. The H2 density is more tightly constrained. The gas density is greater near the center ( cm-3) than in the arms (2 to ). Region 4 has a greater density than the equivalent region 3. Regions with greater density (1, 2, 4) show a stronger HCN emission than the ones with a lower density, confirming the association of HCN emission with dense gas (Mauersberger & Henkel 1993). The derived filling factors are loosely constrained, as are the theoretical CO(1–0) brightness temperatures, depending on the kinetic temperatures. The average value is . These low values reveal the clumpy nature of the molecular gas, contained in many small molecular clouds, unresolved with the pc beam of the interferometer. The derived values for the conversion factor have a average of (K pc2)-1. This is lower than the average value for the giant molecular clouds of our own galaxy ( (K pc2)-1, Sage & Isbell 1991). Region 5 has a conversion factor significantly lower than the others, possibly due to different excitation conditions for the molecular transitions.
We found in the central kiloparsec of NGC 1530 a
ratio about three times
lower than the standard galactic value of Sage & Isbell (1991). It is unlikely that this conversion
factor is universal. For the inner 14 kpc diameter region of NGC 891,
Guélin et al. (1993) found a ratio 3 times lower than the standard galactic value. For the innermost
11 kpc of M51, Guélin et al. (1995) found a ratio 4 times lower than the standard galactic value.
Our results are similar to the results found by Guélin et al. (1993, 1995). In the inner 1200 pc of
the Milky Way, Dahmen et al. (1998) found a
factor of 10 discrepancy relative to the standard Galactic value. We do not find comparable results in
the inner kiloparsec of NGC 1530.
4.2 Star formation and dense gas
Helou et al. (1985) found a proportionality between the far infrared flux and the 20 cm flux for disks of spiral galaxies. This proportionality indicates that the global star formation rate and the global 20 cm flux are linearly correlated. We assumed a linear correlation between the local star formation rate and the local 20 cm flux density. Thus for each of the 5 regions we computed its local star formation rate in a beam by the following formula, with mJy (total 20 cm flux from NGC 1530, from Wunderlich et al. 1987, Condon et al. 1996) and yr-1
To compare with the dense gas distribution, we calculated the amount of H2 gas in dense phase present in each one of these five regions. We used for that the relation existing between the mass of dense gas and the velocity integrated HCN intensity. This relation is derived from HCN radiative transfer solutions (Solomon et al. 1992). It can be written as (K pc2)-1, where is the mass of H2 at a density cm-3 as traced by HCN. From the HCN fluxes of Fig. 1 and this relation, we computed the molecular gas masses of Table 4. The comparison of and show that the star formation rate seems correlated with the amount of available dense gas. The region 4 shows a higher and a higher amount of dense gas than regions 3 and 5, even though region 4 is included in an arc, like the other two regions. Region 5 shows a very low level of star formation, consistent with its cm wavelength spectral index, (see Table 2), which indicates the absence of thermal component in the cm emission.
| Region | a | (H2) b |
|---|---|---|
| ( an-1) | () | |
| 1 | 6 | 16 |
| 2 | 5 | 11 |
| 3 | 2 | 4 |
| 4 | 3 | 8 |
| 5 | 1 | 5 |
| a Local star formation rates from 20 cm flux in a beam | ||
| b Dense gas masses from HCN integrated fluxes in a | ||
| beam from (K pc2)-1 | ||
5 Conclusion
We studied the inner molecular disk of the barred spiral galaxy NGC 1530 by means of millimeter
interferometry. The main conclusions of this paper are :
— The 12CO(2–1) intensity map obtained with a resolution is very similar to
the 12CO(1–0) distribution, with a nuclear ring, and around it, two bright curved arcs.
— The 13CO(1–0) intensity map synthesized with a beam is rather similar to the
12CO(1–0) map, with weaker curved arcs.
— The average ratios are and , comparable to other spiral galaxies.
shows a general decrease from the central ring () to the
curved arcs(). shows no such systematic trend. The ratio
is highest () in a region close to the dynamical center.
— The VLA cm maps show a ring very similar to the 12CO ring, but little or no emission in
the curved arcs.
— An escape probability analysis reproduces well the line ratios in five regions of the disk. We could derive
the kinetic temperature and the density of the gas, together with filling factor. The gas density
seems higher in the nuclear ring than in the curved arcs, except for an isolated region in the
south-western arc.
— The conversion factor deduced from this model is
(K pc2)-1, three times
lower than the standard galactic value of (K pc2)-1.
— The star formation rate as calculated from the 20 cm flux and the mass of dense gas deduced
from the HCN flux are spatially correlated.
Acknowledgements.
We thank the technical staff of the IRAM interferometer for the remarkable job they do. We thank Dr. Alan Pedlar for making available the VLA data. We thank the referee Dr. Vogel for helpful comments.References
- (1) Athanassoula E., 1992, MNRAS 259, 345.
- (2) Braine J., Combes F., Casoli F., Dupraz C., Gerin M., Klein U., Wielebinski R., Brouillet N., 1993, A & A S 97, 887
- (3) Condon J.J., Helou G., Sanders D.B., Soifer B.T., 1996, ApJS 103, 81
- (4) Dahmen G., Huttemeister S., Wilson T.L., Mauersberger R., 1998, A & A 331, 959
- (5) Downes D., Radford S.J.E., Guilloteau S., Guélin M., Greve A., Morris D., 1992, A & A 262, 424
- (6) Downes D., Reynaud D., Solomon P.M., Radford S.J.E., 1996, ApJ 461, 186
- (7) Eckart A., Downes D., Genzel R., Harris A.I., Jaffe D.T., Wild W., 1990, ApJ 348, 434
- (8) Friedli D., Benz W., 1993, A & A 268, 65
- (9) Greve A., Reynaud D., Downes D., 1999, A & A submitted.
- (10) Guélin M., Zylka R., Mezger P.G. Haslam C.G.T. Kreysa E., Lemke R., Sievers A.W., 1993, A & A 279, L37
- (11) Guélin M., Zylka R., Mezger P.G., Haslam C.G.T., Kreysa E., 1995, A & A 298, L29
- (12) Guilloteau S., Delannoy J., Downes D., Greve A., Guélin M., Lucas R., Morris D., Radford S., Wink J., Cernicharo J., Forveille T., Garcia-Burillo S., Neri R., Blondel J., Perrigouard A., Plathner D., Torres M., 1992, A & A 262, 624
- (13) Helou G., Soifer B.T., Rowan-Robinson M., 1985, ApJ 298, L7
- (14) Knapp G.R., Phillips T.G., Huggins P.J., Leighton R.B., Wannier P.G., 1980, ApJ 240, 60
- (15) Loiseau, N., Nakai, N., Sofue, Y., Wielebinski, R., Reuter, H.-P., Klein, U., 1990, A & A 228, 331
- (16) Mauersberger R., Henkel C., 1993, ARA & A 6, 69
- (17) Piner B.G., Stone J.M., Teuben P.J., 1995, ApJ 449, 508
- (18) Plambeck R.L., Williams D.R.W., 1979, ApJ 227, L43
- (19) Radford S.J.E., Solomon P.M., Downes D., 1991, ApJ 368, L15
- (20) Regan M.W., Vogel S.N., Teuben P.J., 1995, ApJ 449, 576
- (21) Regan M.W., Teuben P.J., Vogel S.N., van der Hulst T., 1996, AJ 112, 2549
- (22) Reynaud D., Downes D., 1997, A & A 319, 737
- (23) Reynaud D., Downes D., 1998, A & A 337, 671
- (24) Sage L.J., Isbell D.W., 1991, A & A 247, 320
- (25) Saikia D.J., Pedlar A., Unger S.W., Axon D.J., 1994, MNRAS 270, 46
- (26) Sakamoto S., Handa T., Sofue Y., Honma M., Sorai K., 1997, ApJ 475, 134
- (27) Solomon P.M., Downes D., Radford S.J.E., 1992, ApJ 387, L55
- (28) Wright M.C.H., Ishizuki S., Turner J.L., Ho P.T.P., Lo K.Y., 1993, ApJ 406, 470
- (29) Wunderlich E., Klein U., Wielebinski R., 1987, A&AS 69, 487