Using the Comoving Maximum of the Galaxy Power Spectrum to Measure Cosmological Curvature
Abstract
The large-scale maximum at identified in the power-spectrum of galaxy fluctuations provides a co-moving scale for measuring cosmological curvature. In shallow 3D surveys the peak is broad, but appears to be well resolved in 1D, at (), comprising evenly spaced peaks and troughs. Surprisingly similar behaviour is evident at in the distribution of Lyman-break galaxies, for which we find a excess of pairs separated by , equivalent to for , increasing to for , with a number density contrast of 30% averaged over 5 independent fields. The combination, , matches the local scale of 130, i.e. or for the matter-dominated and flat models respectively, with an uncertainty given by the width of the excess correlation. The consistency here of the flat model with SNIa based claims is encouraging, but overshadowed by the high degree of coherence observed in 1D compared with conventional Gaussian models of structure formation. The appearance of this scale at high redshift and its local prominence in the distribution of Abell clusters lends support to claims that the high- ‘spikes’ represent young clusters. Finally we show that a spike in the primordial power spectrum of at has little effect on the CMB, except to exaggerate the first Doppler peak in flat matter-dominated models, consistent with recent observations.
Subject headings:
cosmology: large scale structure1. Introduction
Methods for measuring cosmological parameters are more readily conceived than realized in practice. Recently however, it has become clear that both SNIa lightcurves and CMB temperature fluctuations provide reasonably model-independent and complimentary means of constraining cosmological curvature (Goobar & Perlmutter 1995, Eisenstein, Hu & Tegmark 1998). The angular scale of the first CMB Doppler peak limits combinations of and . At smaller angles more geometric information may be extracted but is subject to greater physical uncertainty and complex foregrounds. The utility of distant Type Ia supernovae has been convincingly demonstrated (Perlmutter et al. 1998,1999), but concerns remain. Local supernovae are largely discovered in luminous dusty late-type galaxies, deliberately targeted for convenience. In the distant field, supernovae are weighted towards lower luminosity galaxies, sometimes undetected because of the volume-limited nature of the selection. Hence it is not clear that both samples should share the same family of light curves. The physical origin of the 15% luminosity residual remaining after correction is not understood, nor indeed the light-curve correlation itself. Furthermore, some evolution is natural via progenitor metalicity, although the redshift independence of both the residual variance and the distribution of event durations is reassuring. An upward revision of the distant SNIa luminosities of only 15% would render a cosmological constant unnecessary (Perlmutter et al. 1999).
Here we attempt a simple model-independent measurement of curvature, using the spatial scale of the maximum in the power spectrum of galaxy perturbations. A broad maximum is naturally expected below , corresponding to the Horizon at the epoch of matter-radiation equality, up to which high frequency power is suppressed relative to an initially rising power-law spectrum, bending the spectrum over at higher frequency. Observations have established a maximum at () from wide angle galaxy and cluster surveys (Bough & Efstathiou 1993,1994, Einasto et al. 1997, Tadros, Efstathiou & Dalton 1998, Guzzo et al. 1998, Einasto et al. 1998, Hoyle et al. 1998, Scheuker et al. 1999). In particular a pronounced peak is evident in local cluster samples (Einsato et al. 1998) and in the deprojection of the large APM survey (Bough & Efstathiou 1994). In all these estimates the high frequency decline is steeper than expected (Feldman, Kaiser & Peacock 1995) and together with the relatively small amplitude fluctuations implied by CMB at very low k (Smoot et al. 1992) requires the existence of a maximum between 0.01k0.1.
The low frequency peak in the projected 3D power-spectrum and its coincidence in scale with the excess large power detected in lower dimensional redshift surveys (Broadhurst et al. 1990,1992,1999; Landy et al. 1995, Small, Sargent & Hamilton 1997, Tucker, Lin, Schectman 1998) encourages the possibility that the test proposed here can be explored already, by simply comparing pencil beam surveys at high and low redshift. Power on these large scales comoves with the expansion, providing a means of measuring curvature. For example, at the redshift interval corresponding to a scale of is , but this stretches by a factor of 4–8 in redshift to at , increasing with and .
Here we describe the evidence for a preferred large scale of in the fields of high redshift galaxies presented by Steidel (1998) and in the Hubble Deep Field (Adelberger et al. 1998). We examine this in light of the increasing local evidence for a maximum in the power spectrum at 130. We obtain the locus of and , under the assumption that the preferred scale in these datasets is the same. Finally we discuss the implication of a spike in the primordial power spectrum for the CMB.
2. Low Redshift Structure
Several independent wide angle surveys of galaxies and clusters allow the projected 3D power spectrum, to be estimated on scales large enough to cover the predicted low frequency roll-over. These surveys all show a sharp decline in power at , and if deep enough, evidence of either a peak, or a maximum at (Baugh & Efstathiou 1993, Einasto et al. 1995, 1998, Tadros & Efstathiou 1996, Hoyle et al. 1999, Schuecker et al. 1999). This despite the relatively sparse sampling and fairly shallow depth, so that the peak may be better resolved in larger ongoing surveys, where the binning in can be made finer, and the isotropy of Fourier amplitudes examined around for any coherent or generally non-Gaussian behaviour.
Consistent with this, redshift surveys directed at the Boötes void and towards the Phoenix region and the Shapley supercluster also show a pronounced pattern of large wall/voids separated by (Kirshner et al. 1981, 1987, 1990, Quintana et al. 1988, Small, Hamilton & Sargent 1997). Large strip surveys in two dimensions also contain excess power around (Landy et al. 1995, Vettolani et al. 1995). This is despite the narrowness of the strips, of only a few Mpc in width, which must therefore underestimate the real radius of voids (Tucker, Lin & Shectman 1999).
The transverse extent of the peaks and troughs identified at the galactic poles by Broadhurst et al. (1990) are now known to span much more than the width of the original beams, which were of order only the correlation length (). The closest northern peak at v=7000km/s intersects the transverse ‘great wall’ structure near the Coma cluster, as revealed in the maps of De-Lapparent, Geller & Huchra (1986), which extends over . Wider angle redshift surveys at the galactic poles (of diameter ) have clearly confirmed and strengthened the early finding of a scale of spanning the redshift range (Broadhurst et al. 1999) revealing a sinusoidal alternating pattern of peaks and troughs spanning the redshift range and hence a correspondingly narrow concentration of power in one dimension , at . Independent support for the reality of this pattern is found in the coincidence of these peaks with the local distribution of rich clusters (Broadhurst 1990, Bahcall 1991, Guzzo et al. 1992) and in a southern field close to the pole (Ettori, Guzzo & Tarengi 1997).
In comparing the 1D distribution with the projected 3D power spectrum it is important to keep in mind that the wide angle redshift surveys do not have sufficient volume and sampling density to construct the real 3D power spectrum on 100 scales, so interpretations are based on , which is the mean power averaged over solid angle. Hence, it is only sensible to compare the amplitude of with if the power is known to be isotropic with . A non-Gaussian distribution leads to “hotter” and “colder” spots at a given frequency, which may average out in projection but generate a larger variance in 1D pencil beams. This is particularly true of course for highly coherent structure (e.g. Voronoi foam, Icke & Van De Weygaert 1991) , where the 3D variance can be sub-Poissonian on scales larger than the coherence length.
3. High Redshift Structure
The most puzzling aspect of the distant dropout galaxies is the appearance of sharp peaks in the redshift distribution (Adelberger et al. 1998, Steidel 1998), resembling the situation at low redshift, implying at face value little growth of structure. A conventional interpretation of these peaks resorts to “bias” (Wechsler et al. 1998) which has come to represent a flexible translation between the observed structure and the relatively smooth mass distribution of standard simulations, so that the observed peaks are interpreted as rare events destined to become massive clusters by today (Wechsler et al. 1998). High biases have been claimed for the Lyman-break population on the basis of the amplitude of small scale clustering at (Adelberger et al. 1997, Giavalisco et al. 1998). The occurrence of such peaks is enhanced with a steep spectrum by a reduction of high frequency ‘noise’ (Wechsler et al 1998) but this gain is offset if the steepness is attributed to low , since then a given redshift bin corresponds to a larger volume, and hence a greater proper density contrast (Wechsler et al 1998). We may regard the existence of regular spikes at low and high redshift as evidence for a revision in our understanding of large scale structure, indicating perhaps that initial density fluctuations are not Gaussian distributed such as may be implied by the observed lack of evolution of the number density of X-ray selected clusters (Rosati et al. 1998). The baryon isocurvature model (Peebles 1997) more naturally accommodates both the early formation and the frequent non-Gaussian occurrence of high density regions (Peebles 1998a,b).
We analyze the fields of Lyman-Break galaxies of Steidel (1998) and Adelberger(1998). These include 4 fields of galaxies and a smaller sample of redshifts in the Hubble Deep Field direction. The fields are Mpc in width by Mpc in the redshift direction and include over 600 redshifts in the range histogrammed in bins of . In Figure 1 we plot the pair counts and correlation function, assuming that galaxies are evenly distributed within the narrow redshift bins. A clear excess is apparent on a large scale, corresponding to a preference for separations of . A pair excess is also seen at twice this separation (Fig 1) indicating phase coherence along the redshift direction. This behaviour is an obvious consequence of the regular peaked structure visible in the redshift histograms of four of the five fields (Fig 1). In a bin of 10Mpc, the number of pairs at the peak is compared with an expected , representing a departure from random (Fig 1).
The observed redshift interval may be related to comoving scale by the usual formula for a universe with negligible radiation energy-density (Peebles 1993),
| (1) | |||||
with
| (2) |
Whereas standard candles at moderate redshift (SNIa) measure , and CMB anisotropies measure , these observations considered here measure or which lies between these two locii, thus adding complimentary information.
With this, the scale of the peak corresponds to for , doubling to for . Flat cosmologies with a positive fall between these limits. If we constrain we find . This gives for an open universe () or for a flat universe (), with an uncertainty of only in , given by the 15% width of the excess correlation (Figure 1). This scale, if borne out by subsequent redshift data, is certainly consistent with the flat model preferred by SNIa data with (Perlmutter et al. 1998,1999).
4. Excess Power and the CMB
One can imagine two broad classes of physical mechanisms that might be responsible for the excess power required to fit this data. The power might be a truly primordial feature in the power spectrum. In inflationary scenarios, for example, this could be generated by the proliferation of super-horizon bubbles in a suitably conspiratorial inflaton potential (La 1991, Occhinero & Amendola 1994). On the other hand, excess power could be due to causal microphysics in the universe after the 130 scales enter the horizon. In other words, the power could be added by the transfer function. A high baryon density naturally imparts large scale “bumps and wiggles” to the power spectrum (Peebles 1998a,b, Eisenstein et al. 1997, Meiksin et al. 1998) in particular if matter density fluctuations are created at the expense of radiation (Peebles 1998a,b). An even more radical possibility is that the universe is topologically compact, and that we are seeing evenly-spaced copies of a small universe with an extent of only although this scale seems too small to accommodate the unique and relatively distant (z=0.18) cluster A1689 (Gott 1980).
In light of this it is interesting to explore the implications of any excess power on CMB temperature fluctuations. Eisenstein et al. (1997) has examined in what way conventional adiabatic models maybe stretched to match the power spectrum of Broadhurst et al. (1990), demonstrating that such models do not naturally account for a scale of 130 in the mass distribution.
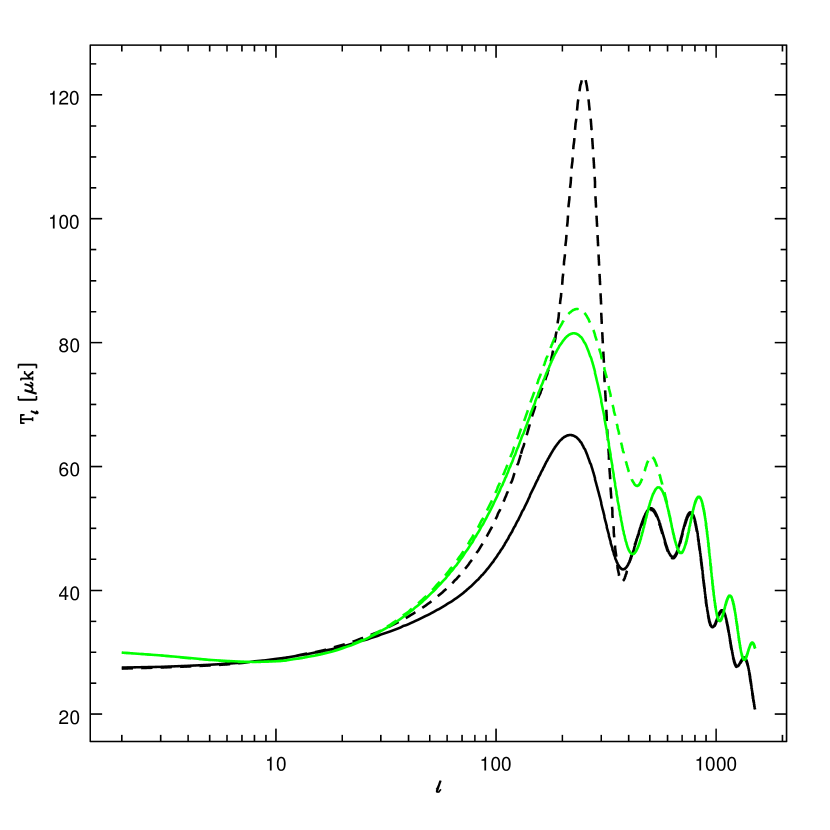
Our approach is to simply add power in the primordial spectrum at a fixed wave number, using a modified version of CMBFAST code (Seljak & Zaldarriaga 1999), to simulate temperature fluctuation spectra. A primordial spike of power will effect the CMB directly through the projection of three-dimensional features. A narrow band of power is added, . The amplitude is set so that , the value of the correlation function at the peak and harmonics equivalent to at 30% density contrast. We ignore bias, which may conceivably be large, lowering the peak amplitude; we also ignore the possibility of non-Gaussian fluctuations which would certainly diminish the angle-averaged power.
If the value of the power spectrum at the peak is already large, as with COBE-normalized models, an additional peak of the above strength has negligible effect. However, COBE-normalized models with and have comparatively low power at this scale, hence, the effect on the final and is significant. Of course, the precise width and location of the peak, not yet at all well-constrained by the CMB data, also affects the relative power in the peak versus the underlying “smooth power-law” spectrum. This is illustrated in Figure 2. The spike is seen to raise the amplitude of the first Doppler peak by nearly a factor of two for the sCDM model.
Note, although it is premature to interpret the claims of the various CMB experiments for and excess of power at (Netterfield et al 1997, Tegmark 1998) without proper treatment of the covariance matrix of errors and foreground subtraction, the indications of a large amplitude for this peak are not inconsistent with the degree of boosting (Fig. 2). Others, Gawiser and Silk 1998, have noted that the whole aggregate of current and data is extremely well-fit—much better than the fit to standard models—by an adiabatic inflationary power spectrum with sharp bump like that considered here.
5. Conclusions
Two interesting results emerge from the above comparison of structure in the local and distant pencil beam data. Firstly both samples of galaxies show regular large scale power confined to a narrow range of frequency. Secondly, by matching these scales we obtain values of and in good agreement with the SNIa claims. These findings may of course be regarded as remarkable coincidences, unlikely to occur by chance in a clumpy galaxy distribution (Kaiser & Peacock 1991).
Distinguishing between the open and flat solutions found here requires pencil beam data at a third redshift. Optimally this redshift turns out to be convenient for observation, , where the ratio of between the open and cases is maximal, differing by 13%, and may be explored with existing data.
Since locally the excess power at 130 is most prominent in cluster selected samples, we may conclude that the peaks in the high- sample correspond to proto-clusters at . This conclusion is independent of the high-bias interpretation which also regards the spikes as young rich clusters.
Understanding the physics behind these spikes is complicated by a conspiracy of scales. We have seen in Fig. 2 that the spike produces a feature in the CMB power spectrum at nearly exactly the position of the first doppler peak. In the simple model presented here—a primordial spike at this position—this is merely a coincidence, however unlikely. That these scales are so closely matched seems yet more unlikely in the light of another fact, that the required peak in the matter power spectrum is at nearly the position of the expected peak due to the passage from radiation to matter-domination.
If the acoustic peaks in the CMB power spectrum are instead a signature of physics at a somewhat later epoch: the sound horizon at recombination (set by ) then that these scales are nearly coincident (within an order of magnitude or so of 100 ) is a consequence of the particular values of the cosmological and physical parameters. Thus, if we change the initial conditions to increase the amplitude of the matter power spectrum near the equality scale, we also increase the CMB temperature power spectrum at roughly the scale of the first acoustic peak. That is, in neither case do we add an unexpected peak, but merely increase the amplitude and “sharpness” of an expected one.
Of course, the inexplicable coincidence is that the feature in the power spectrum appears close to the expected matter-radiation equality peak, but with an amplitude much too large to be explained by standard theories. In addition, we must also note that merely adding a peak to the mean power spectrum cannot account for the nearly periodic structure observed in 1D. A real theoretical explanation must account for the complicated non-Gaussian properties of this distribution.
The excess 1D power identified by Broadhurst et al. (1990) will soon be subject to easy dismissal with large 3D redshift surveys. However, whether or not it transpires that universal large scale coherence exists, the test proposed here is still viable in principle using the general predicted turnover of the 3D power spectrum, requiring larger volume redshift surveys. In particular comparisons of local and distant clusters over a range of redshift will be particularly useful given their sharply peaked and high amplitude power spectrum..
References
- (1)
- (2) Adelberger, K.L, Steidel, C.C., Giavalisco, M., Dickinson, M., Pettini M., Kellogg M., 1998 ApJ 505,18
- (3)
- (4) Bahcall, N.A., 1991, APJ,376,43
- (5)
- (6) Baugh C. M., Efstathiou G., 1993 MNRAS 265,145
- (7)
- (8) Baugh C. M., Efstathiou G., 1994 MNRAS 270,183
- (9)
- (10) Broadhurst T.J., Ellis R.S., Koo D.C., Szalay A.S., 1990 Nature 343,726
- (11)
- (12) Broadhurst T.J., 1990 PhD thesis Unversity of Durham, UK
- (13)
- (14) Broadhurst T.J., Ellis R.S., Koo D.C., Szalay A.S., 1992 “Digitised Optical Sky Surveys” Kluwer, eds Mac Gillivray H.T., Thompson E.B.
- (15)
- (16) De Lapparent V., Geller M.J., Huchra J.P., 1986 APJ 302, L1
- (17)
- (18) Einasto J., Einasto M., Gottloeber S., Mueller V., Saar V., Starobinsky A.A., Tago E., Tucker D., Andernach H., Frish P., 1997 Nature 385,139
- (19)
- (20) Einasto J., Einasto M., Frisch P., Gottloeber S., Muller V., Saar V., Starobinsky A.A., 1997 MNRAS 299, 801
- (21)
- (22) Eisenstein, D. J., Hu W., Tegmark M., 1998 ApJ 504,57
- (23)
- (24) Eisenstein, D. J., Hu W., Silk J., Szalay A. S. 1998 ApJ 494,L1
- (25)
- (26) Ettori, S., Guzzo, L., Tarenghi, M., 1997, 285,218
- (27)
- (28) Feldman, H., Kaiser, N., Peacock, J.A., 1994 ApJ 426,23
- (29)
- (30) Gawiser E., Silk J., 1998 astro-ph/9812200
- (31)
- (32) Giavalisco, M., Steidel C.C., Adelberger K.L., Dickinson, M., Giavalisco, M., Pettini, M., Kellogg, M., 1998 ApJ 503,543
- (33)
- (34) Goobar A., Perlmutter S., 1995 ApJ 440,L41
- (35)
- (36) Gott J.R., 1980 MNRAS 193,153
- (37)
- (38) Guzzo, L., Collins, C.A., Nichol, R.C., Lumsden, S. L., 1992, ApJ 393,L5
- (39)
- (40) Hoyle, F., Baugh C.M., Shanks T., Ratcliffe A., MNRAS submitted/astro-ph9812137
- (41)
- (42) Icke V., Van De Weygaert R., 1991 QJRAS 32,851
- (43)
- (44) Kaiser N., Peacock J.A., 1991 ApJ 379,482
- (45)
- (46) Kirshner, R.P., Oemler, A., Schechter, P.L., Shectman, S.A., 1981 ApJ 248,L57
- (47)
- (48) Kirshner, R.P., Oemler, A., Schechter, P.L., Shectman, S.A., 1987 ApJ 314,493
- (49)
- (50) Kirshner, R.P., Oemler, A., Schechter, P.L., Shectman, S.A., 1990 AJ 100, 1049
- (51)
- (52) La, D., 1991. Phys. Lett. B265, 232
- (53)
- (54) Landy S. D., Shectman S. A., Lin H., Kirshner R.P., Oemler A.A., Tucker D. 1996 ApJ 456,1L
- (55) Rosati P., Della-Ceca R., Norman C., Giacconi R., 1998 ApJ 492, L21
- (56)
- (57) Meiksin A., White M., Peacock J.A., 1998 MNRAS in press astro-ph/9812214
- (58)
- (59) Netterfield, C.B. Devlin M.J., Jarolik N., Page L., Wollack E.J., 1997 ApJ 474,47
- (60)
- (61) Occhionero, F., & Amendola L 1994, Phys Rev D. 47, 4372
- (62)
- (63) Peebles P.J.E., 1993“Principles of Physical Cosmology”, Princeton University Press ISBN 0691019339
- (64)
- (65) Peebles P.J.E., 1997 ApJ, 483, L1
- (66)
- (67) Peebles P.J.E., 1999 ApJ 510, 523
- (68)
- (69) Peebles P.J.E., 1999 ApJ 510, 531
- (70)
- (71) Perlmutter S., et al. 1998 Astro-ph/9812473
- (72)
- (73) Perlmutter S., et al. 1999 ApJ in press Astro-ph/9812133
- (74)
- (75) Quintana, H., Ramirez A., Melnick, J., Raychaudhury A., Slezak E., 1995, AJ 110,463
- (76)
- (77) Rosati, P., Della Ceca, R., Norman, C., Giacconi R., 1998 ApJ 429,21
- (78)
- (79) Schmidt B.P., 1998 ApJ 507,46
- (80)
- (81) Schuecker et al. 1999 in prep
- (82)
- (83) Seljak U., Zaldarriaga M., 1999 Phys. Rev. Lett. 82, 2636
- (84)
- (85) Small T. A., Sargent W.L.W., Hamilton D. 1997 ApJ 487,512
- (86)
- (87) Smoot G.F., 1992 ApJ 396,L1
- (88)
- (89) Steidel C.C., 1998 Astro-p/9811400
- (90)
- (91) Tadros, H., Efstathiou, G., MNRAS 1996 282,1381
- (92)
- (93) Tadros, H., Efstathiou, G., Dalton, G., MNRAS 1998 296,995
- (94)
- (95) Tegmark M., 1999 ApJ 514,69
- (96)
- (97) Tucker D.L., Lin, H., Shectman, S., 1999 “Wide Field Surveys in Cosmology,” proceedings of the 14th IAP Astrophysics Colloquium
- (98)
- (99) Vettolani et al. 1997 A&A 325,954
- (100)
- (101) Wechsler, R.H., Gross M.A.K., Primack, J.R., Blumenthal G.R., Dekel A., 1998 ApJ506,19
- (102)