OPTICAL STUDIES OF THE
X-RAY TRANSIENT XTE J2123–058 – II.
PHASE RESOLVED SPECTROSCOPY
Abstract
We present time-resolved spectroscopy of the soft X-ray transient XTE J2123–058 in outburst. Spectral coverage of 3700–6700 Å was achieved spanning two orbits of the binary. The strongest emission lines are He ii 4686 Å and C iii /N iii 4640 Å (Bowen blend). Other weak emission lines of He ii and C iv are present and Balmer lines show a complex structure, possibly contaminated by He ii. He ii 4686 Å and C iii/N iii 4640 Å show different orbital light curves indicating an origin in different regions. He ii 4686 Å profiles show a complex multiple S-wave structure. Doppler tomography reveals this emission is not associated with the companion star, and occurs at velocities too low for Keplerian disk material. It can possibly be associated with overflowing or splashing stream material. The optical spectrum approximates a steep blue power-law, consistent with emission on the Rayleigh-Jeans tail of a black body spectrum. Orbital modulations show no wavelength dependence; this is as expected if both disk and companion star are hot enough for the peak of their spectral energy distributions to be in the UV. The hot continuum and presence of high-excitation emission lines indicate strong X-ray heating.
-
(1) Astronomy Centre, University of Sussex
Falmer, Brighton, BN1 9QJ, UK
-
(2) Astrophysics, University of Oxford
Nuclear and Astrophysics Laboratory, Keble Road, Oxford, OX1 3RH, UK
-
(3) Instituto de Astrofisica de Canarias,
38200 La Laguna, Tenerife, Spain
Email: R.I.Hynes@open.ac.uk
1 Introduction
The X-ray transient XTE J2123–058 was discovered by the RXTE satellite on 1998 June 27 (Levine, Swank and Smith 1998, [1]). An optical counterpart was promptly identified by Tomsick et al. (1998a, [2]). The discovery of apparent Type-I X-ray bursts (Takeshima and Strohmayer 1998, [3]) indicated that the compact object was a neutron star. Interest in the object increased dramatically when Casares et al. (1998, [4]) reported the presence of a strong optical modulation and attributed this to an eclipse; the orbital period was subsequently determined to be 6.0-hr both photometrically (Tomsick et al. 1998b, [5]; Ilovaisky & Chevalier 1998, [6]) and spectroscopically (Hynes et al. 1998, [7]). Tomsick et al. (1998b, [5]) suggested that the 0.9-mag modulation is likely actually due to the changing aspect of the heated companion in a high inclination system, although partial eclipses appear also to be superposed on this (Zurita, Casares & Hynes 1998, [8]). In this paper we present the results of our spectrophotometric study of XTE J2123–058 using the William Herschel Telescope (WHT), La Palma. Our photometric observations are described in a companion paper in this proceedings, Zurita et al. (1999, hereafter Paper I, [9]).
2 Our dataset
We observed XTE J2123–058 through two 6-hr binary orbits on 1998 July 19–20. We used the blue arm of the ISIS dual-beam spectrograph on the 4.2-m William Herschel Telescope to obtain 28 spectra. The R300B grating combined with an EEV CCD gave an unvignetted coverage of 4000–6500 Å with some useful data outside this range. An 0.7–1.0 arcsec slit gave a spectral resolution 2.9–4.1 Å. Each spectrum was calibrated relative to a second star on the slit. Absolute calibration was tied to the spectrophotometric standard Feige 110 (Oke 1990, [10]). Wavelength calibration was obtained from a copper-argon arc lamp, with spectrograph flexure corrected using sky emission lines.
Our average spectrum shown in Fig. 1 is derived from a straight sum of count rates before slit loss and extinction corrections to maximize the signal to noise ratio. The spectral energy distribution was determined from an average of calibrated spectra interpolated onto a uniform phase grid, i.e. it is a uniformly weighted average over all phases.

3 The line spectrum
At first glance, XTE J2123–058 presents a nearly featureless blue spectrum, with only the Bowen blend (N iii/C iii 4640 Å) and He ii 4686 Å prominent. In addition, however, a number of weaker emission lines are present, the Balmer lines exhibit complex profiles and weak interstellar absorption features are seen.


| Identification | Wavelength (Å) | Comment | |
|---|---|---|---|
| Ca ii K | 3933.7 | Interstellar | |
| He ii Br | 4100.0 | Blended with H? | |
| H | 4101.7 | ||
| He ii Br | 4199.8 | ||
| Ca ii | 4220.1 | ||
| He ii Br | 4338.7 | Blended with H? | |
| H | 4340.5 | ||
| DIB | 4428 | Interstellar | |
| He ii Br | 4541.6 | ||
| N iii/C iii | 4640 | ||
| He ii P | 4685.7 | ||
| He ii Br | 4859.3 | Blended with H? | |
| H | 4861.3 | ||
| He ii Br | 5411.5 | ||
| C iv | 5801.5,5812.1 | ||
| Na i D | 5890.0,5895.9 | Interstellar | |
| He ii Br | 6560.1 | Blended with H? | |
| H | 6562.5 |
Balmer lines from H to H appear to show broad absorption and an emission core. The wavelength range marked underneath each Balmer line in Fig. 2 corresponds to km s-1; this is intended to be an approximate guide to the width, rather than a fit. The emission core may partly be Balmer emission but at least some is attributable to coincident He ii lines (since we see He ii 4542 Å and 5412 Å we would expect to also see related lines such as 4859 Å). This broad absorption plus narrow emission Balmer line structure is also seen in other systems, for example the neutron star LMXB 4U 2129+47 (Thorstensen & Charles 1982, [11]) and the black hole candidate GRO J0422+32 in outburst (Shrader et al. 1994, [12]).
Based on the strength of the Na D1 line and the calibration of Munari & Zwitter (1997, [13]) we estimate .
4 Emission line behavior
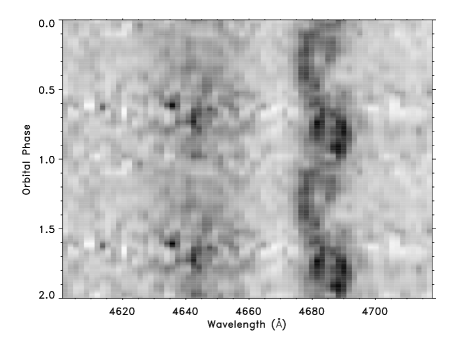
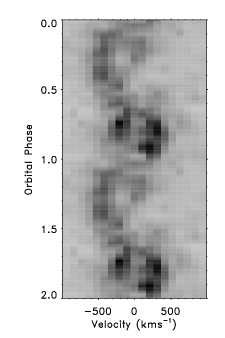
Both N iii/C iii 4640 Å (Bowen blend) and He ii 4686 Å emission lines show changes in integrated flux over an orbital cycle and He ii also reveals complex line profile changes, with multiple S-wave components present in the trailed spectrogram shown in Fig. 3.
The light curves of the two lines shown in Fig. 4 appear somewhat different in structure; the Bowen blend peak is broader and earlier than that of He ii. This suggests an origin from different sites within the system. The Bowen blend light curve in fact appears similar to the continuum light curves shown in Fig. 7; Bowen emission may therefore originate on the heated face of the companion star, with the modulation arising from the varying visibility of the heated region.

He ii emission, shows a strong peak near phase 0.75 with a suggestion of a weaker one near 0.25. The modulation probably indicates that the emission region is optically thick. We should be cautious in interpreting the light curve, however, as the complex line behavior indicates multiple emission sites. The integrated light curve is an average of different light curves of several regions. A possible resolution to this problem will be to use Doppler tomography to locate the dominant emission sites (perhaps the two brightest spots). Then we can fit a toy model in which each of these spots (treated as a point source) is allowed to vary smoothly in brightness over an orbital cycle. This procedure may allow us to approximately allow us to deconvolve the light curves of the different regions.
5 Doppler tomography
We have used the technique of Doppler Tomography (Marsh & Horne 1988, [14]) to identify emission sites in velocity space. Both the back-projection method implemented in molly and maximum-entropy method of doppler give similar results, as does the alternative maximum entropy implementation of Spruit [15]. Fig. 5 shows a maximum entropy tomogram generated with doppler. Appropriate values were chosen for instrumental resolution ( km s-1) and phase smearing. We overplot the position of the Roche lobe of the companion, the accretion stream ballistic velocity, the Keplerian velocity along the accretion stream and the Keplerian velocity around the disk edge. These are derived from uncertain system parameters, so they should be viewed cautiously. The parameters are determined from light curve fits (see Paper I). We should also beware that one of the fundamental assumptions of Doppler tomography, that we always see all of the line flux at some velocity, is clearly violated, as the integrated line flux is not constant.
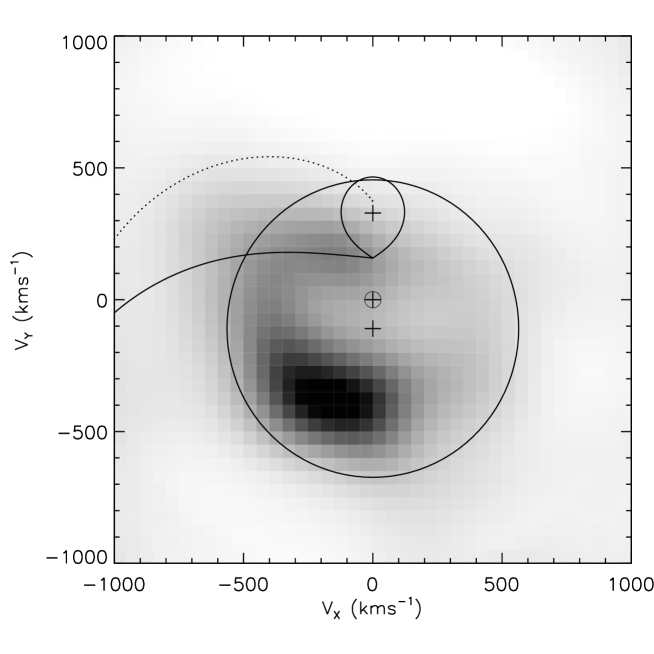
In spite of these cautions, we can learn something from the exercise. The dominant emission site (corresponding to the main S-wave) appears on the opposite side of the neutron star from the companion. It is inconsistent with the heated face of the companion and the stream/disk impact point, although a tail does appear to extend upwards towards the expected stream position. As the emission appears to form an arc roughly centered on the neutron star position, it is tempting to associate it with asymmetric disk emission. Unfortunately the velocity of the strongest emission is too low for disk material. This can be seen from the fact that it lies inside the circle representing the Keplerian velocity at the disk edge; the inner disk will have higher velocities than this. If the observed bright spot is indeed emission from the disk then it must come from sub-Keplerian material. A more promising explanation is suggested by the similarity to some SW Sex type cataclysmic variables (e.g. V1315 Aql; compare H tomograms in Dhillon, Marsh and Jones 1991, [16], and Hellier 1996, [17]). This is that the emission is actually associated with an extension of the accretion stream beyond its nominal disk impact point. One possible model involves a disk-anchored magnetic propeller (Horne 1999 [18]), suggested for SW Sex systems, which ejects some of the stream material from the system. An alternative is that some material splashes from the stream impact point, rising high above the disk. Such material will follow a trajectory similar to that seen, with the brightest observed spot corresponding to the point where this splashing material reimpacts the disk.
6 The spectral energy distribution
We show in Fig. 6 our average spectrum after dereddening using the extinction curve of Cardelli et al. 1989, [19]) and our reddening estimate of derived from the Na D1 line (see above). We also show the photometry of Tomsick et al. (1998a, [2]) from 1998 June 30 and a spectrum of GRO J0422+32 (1992 August 17) provided by C.R. Shrader. This black hole X-ray transient has a 5.1-h orbital period, making it the black hole system most similar to XTE J2123–058. Both the photometry of Tomsick et al. and our spectroscopy appear steeper than the spectrum of GRO J0422+32, taking a steep blue power-law form. In view of the difficulties of accurately calibrating U band data, it is unclear whether the apparent flattening off of the spectrum at high energies is real or an artifact.

7 Continuum behavior
We show in Fig. 7 light curves for three ‘continuum’ bins at 4500 Å, 5300 Å and 6100 Å. The light curves show very similar shapes, with no significant differences in profile or amplitude within this wavelength range. The apparent differences between them, most noticeable around phase 0.6, are likely due to calibration uncertainties: coverage on each night was approximately from phase 0.6 through 1.6.
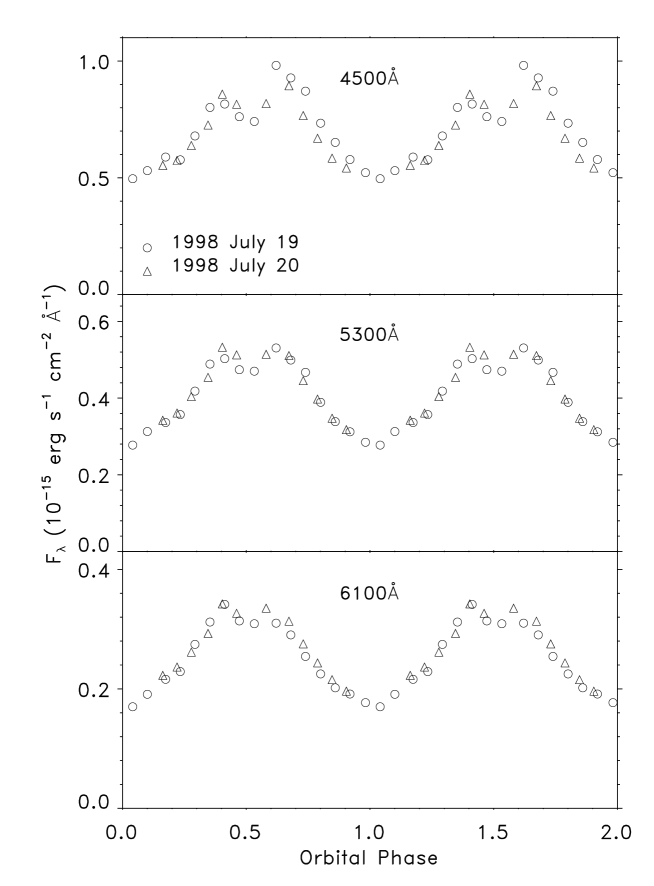
The light curve morphology is fully discussed in Paper I. We believe it is mainly due to the changing aspect of the heated companion star, which is the dominant light source at maximum light, near phase 0.5. At minimum light (phase 0.0) the heated face is obscured and we see the accretion disk only. At all phases the unilluminated parts of the companion star are expected to contribute negligible flux as the outburst amplitude is magnitudes.
The lack of strong color dependence then indicates that either the disk and heated companion have similar temperatures, or that both are sufficiently hot that we only see the Rayleigh-Jeans part of the spectrum. The very steep spectral energy distribution shown in Fig. 6 suggests that the latter is the case.
8 Conclusion
Our main findings are summarized below. Where appropriate, we make comparisons with the black hole X-ray transient, GRO J0422+32. This system has a 5.1-h orbital period and may be the black hole system most similar to XTE J2123–058. We also note some similarities to the neutron star LMXB 4U 2129+47 which has a 5.2-hr orbital period and shows similar large amplitude photometric variations to XTE J2123–058.
-
High excitation emission lines dominate the spectrum (He ii, N iii/C iii, C iv (see upper left panel). No He i emission is seen. The blue line spectrum looks rather similar to that of 4U 2129+47 (Thorstensen & Charles 1982, [11]).
-
He ii emission is dominated by a region that coincides with neither the heated companion star, the ballistic accretion stream nor a Keplerian disk. This is unlike GRO J0422+32 (Casares et al. 1995, [20]), the only other transient for which outburst Doppler tomography has been performed. In GRO J0422+32, He ii emission appears to originate from the accretion stream/disk impact point. Our observations may possibly be explained by extension of the stream beyond the initial impact point. This may be similar to the He ii emission in 4U 2129+47 (Thorstensen & Charles 1982, [11]) which has a radial velocity modulation with similar phase and amplitude to that we see.
-
The continuum spectral energy distribution is very blue, and steeper than in black hole X-ray transients such as GRO J0422+32 (see Fig. 6). This implies that both the heated face of the companion star, and the disk, are hotter than in similar short-period black hole systems. Such a conclusion is supported by the dominance of high-excitation emission lines. We suggest tentatively that this may indicate more efficient X-ray irradiation in this (neutron star) transient compared to black hole systems. This has previously been suggested by King, Kolb and Szuszkiewicz (1997, [21]) as an explanation for why most transient LMXBs contain black holes whereas apparently all persistent sources contain neutron stars. Before we can claim this is a firm conclusion we will need to assess the uncertainty in the spectral energy distribution and perform a more systematic comparison with other systems taking into account differences in X-ray luminosity.
Acknowledgments
Thanks to Chris Shrader for providing the spectrum of GRO J0422+32 for comparison. Doppler tomography used molly and doppler software by Tom Marsh and dopmap software by H.C. Spruit ([15]). The William Herschel Telescope is operated on the island of La Palma by the Isaac Newton Group in the Spanish Observatorio del Roque de los Muchachos of the Instituto de Astrofisica de Canarias. RIH is supported by a PPARC Research Studentship.
References
References
- [1] Levine A., Swank J., Smith E., 1998, IAU Circ. 6955
- [2] Tomsick J. A., Halpern J. P., Leighly K. M., Perlman E., 1998a, IAU Circ. 6957
- [3] Takeshima T., Strohmayer T. E., 1998, IAU Circ. 6958
- [4] Casares J., Serra-Ricart M., Zurita C., Gomez A., Alcalde D., Charles P., 1998, IAU Circ. 6971
- [5] Tomsick J. A., Kemp J., Halpern J. P., Hurley-Keller D., 1998b, IAU Circ. 6972
- [6] Ilovaiksy S. A., Chevalier C., 1998, IAU Circ. 6975
- [7] Hynes R. I., Charles P. A., Haswell C. A., Casares J., Serra-Ricart M., Zurita C., 1998, IAU Circ. 6976
- [8] Zurita C., Casares J., Hynes R. I., 1998, IAU Circ. 6993
- [9] Zurita C., et al., 1999, this proceedings
- [10] Oke J. B., 1990, AJ, 99, 1621
- [11] Thorstensen J. R., Charles P. A., 1982, ApJ, 253, 756
- [12] Shrader C. R., Wagner R. M., Hjellming R. M., Han X. H., Starrfield S. G., 1994, ApJ, 434, 698
- [13] Munari U., Zwitter T., 1997, A&A, 318, 274
- [14] Marsh T. R., Horne K., 1988, MNRAS, 235, 269
- [15] Spruit H. C., 1998, astro-ph/9806141
- [16] Dhillon V. S., Marsh T. R., Jones D. H. P., 1991, MNRAS, 252, 342
- [17] Hellier C., 1996, ApJ, 471, 949
- [18] Horne K., 1999, to appear in proc. Magnetic Cataclysmic Variables eds. K. Mukai, C. Hellier, ASP (astro-ph/9901007)
- [19] Cardelli J. A., Clayton G. C., Mathis J. S., 1989, ApJ, 345, 245
- [20] Casares J., Marsh T. R., Charles P. A., Martin A. C., Martin E. L., Harlaftis E. T., Pavlenko E. P., Wagner R. M., 1995, MNRAS, 274, 565
- [21] King A. R., Kolb U., Szuszkiewicz E., 1997, ApJ, 488, 89