Magnetic fields and strong density waves in the interacting galaxy NGC 3627
Abstract
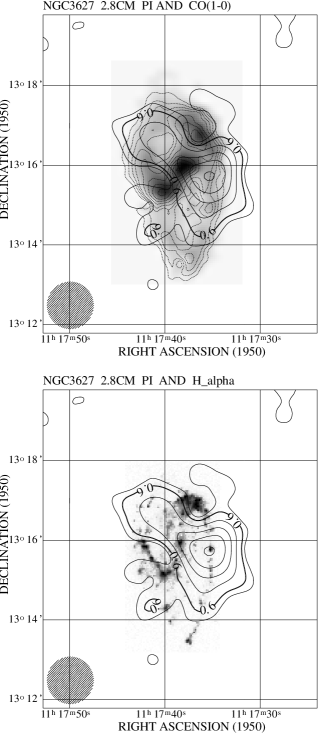
We present 10.55 GHz observations of the strong-density-wave spiral NGC 3627. Total power and polarization maps with a resolution of 113, sensitive to a weak extended emission were obtained. In the analysis we used also available data in the CO and H lines.
The total power brightness distribution shows two equally bright sources close to the bar ends, coincident with similar peaks in CO and H. The strong central peak of the CO emission does not correspond to a detectable central source in radio continuum. A weak H flux from this region is thus due not only to a strong absorption but may also indicate a low star formation level in the central molecular complex. The equally strong total power peaks at the bar ends do not reflect the asymmetry of the H emission, the latter being stronger at the northern bar end. The H asymmetry is likely to be due to differences in absorption.
The polarized emission has the form of two asymmetric lobes with B-vectors running parallel to the optical arms. The stronger lobe is located at the position of the dust lane in the western arm while the weaker one falls on the middle of the interarm space in the NE disk. Smooth polarized emission away from any spiral structures was also detected. Despite the strong density waves, many polarization properties of this galaxy like the large-scale distribution of polarized intensity or azimuthal variations of magnetic pitch angles can be reasonably explained by the presence of an axisymmetric, dynamo-type magnetic field component. However, extra effects like the depolarization of the southern segment of the eastern arm by vertical fields above star-forming regions, as well as some compressional enhancement of regular fields in the western arm seem necessary to explain our polarization data.
Key Words.:
Polarization – Galaxies:individual:NGC 3627 – Galaxies:magnetic fields – Galaxies:spiral – Radio continuum:galaxies1 Introduction
The role of gas flows in spiral arms upon the galactic magnetic field evolution is a lively debated issue. Theories of the field amplification by small scale turbulent motions (e.g. axisymmetric dynamo, Wielebinski & Krause 1993), which well reproduce the polarization properties of galaxies with weak density waves (Urbanik et al. 1997), do not need any spiral arm flows. In other theories (e.g. Chiba 1993), the density wave perturbations are the main agent amplifying the galactic magnetic field. The importance of the latter process compared to the dynamo action may be a function of the density wave strength. Though successful attempts to model the magnetic field evolution driven by the dynamo and spiral arms or bars have been made (Mestel & Subramanian 1991, Subramanian & Mestel 1993, Moss 1997, Moss et al. 1998), this issue has still very poor observational grounds.
Existing observations of large, nearby spirals (Beck et al. 1996) do not allow to state whether in case of strong density waves the magnetic field evolution becomes dominated by processes in spiral arms. Strong density wave signatures are present in M51 and in the inner disk of M81. In M51 the polarization B-vectors follow local structural details of dust lanes (Neininger & Horellou 1996), as expected for a magnetic field dominated by density-wave compression. However, the spiral arms are too tightly wound to separate this field component from a possible dynamo-generated one, which is usually distributed more uniformly in the disk. No clear magnetic field component related to density waves has been identified in M81, however its inner disk shows a subtle network of local compression regions filling the whole interarm space (Visser 1980).
NGC 6946, NGC 4254 and the outer parts of M81 do not show strong density wave signatures. Their magnetic fields form either broad ”magnetic arms“ in the middle of the interarm space (NGC 6946, Beck & Hoernes 1996) or smoothly fill the interarm space (M81, Krause et al. 1989). In NGC 4254 a coherent spiral pattern of polarization B-vectors exists even in regions of completely chaotic optical structures (Soida et al. 1996). The nearby well-studied spirals also have enhanced star formation in spiral arms, destroying the regular fields. We note that the detection of smoothly distributed dynamo-type fields needs a very good sensitivity to extended polarized emission, which is not always ensured by high-resolution studies.
In this paper we present observations with good sensitivity to smooth, extended structures to check whether a galaxy with very strong signs of density waves may have a global magnetic field dominated by the component caused by density wave action. We obtained 10.55 GHz total power and polarization maps of the spiral NGC 3627 interacting within the Leo Triplet (Haynes et al. 1979). The galaxy has a bar and two spiral arms with a broad interarm space discernible even with a modest resolution (see Fig. 1). The western arm contains a long dust lane tracing large-scale gas (and possibly frozen-in field) compression, accompanied by little star formation (cf. H map by Smith et al. 1994). The middle part of the arm is unusually straight, bending sharply in the outer disk. The eastern arm has a heavy dust lane in its southern part, breaking into a subtle network of filaments in its northern half. The southern dust lane segment is accompanied by a chain of bright star-forming regions. Reuter et al. (1996) found perturbations of the galaxy’s CO velocity field possibly due to streaming motions related to spiral arms. NGC 3627 has been also observed in the far infrared by Sievers et al. (1994). A total power map at 1.49 GHz using the VLA D-array was made by Condon (1987).
2 Observations and data reduction
The total power and polarization observations at 10.55 GHz were performed in May 1993, as well as in April and May 1994 using the four-horn system in the secondary focus of the Effelsberg 100-m MPIfR telescope (Schmidt et al. 1993). With 300 MHz bandwidth and K system noise temperature, the r.m.s. noise for 1 sec integration and combination of all horns is mJy/beam area in total power and mJy/beam area in polarized intensity.
Each horn was equipped with two total power receivers and an IF polarimeter resulting in 4 data channels containing the Stokes parameters I, Q and U. The telescope pointing was corrected by making cross-scans of Virgo A at time intervals of about 2 hours. As flux calibrator the highly polarized source 3C286 was observed. A total power flux density of 4450 mJy at 10.55 GHz has been adopted using the formulae by Baars et al. (1977). The same calibration factors were used for total power and polarized intensity, yielding a mean degree of polarization of 12.2%, in reasonable agreement with other published values (Tabara & Inoue 1980).
In total 29 coverages of NGC 3627 in the azimuth-elevation frame were obtained. The data reduction process was performed using the NOD2 data reduction package (Haslam 1974). By combining the information from appropriate horns, using the ”software beam-switching“ technique (Morsi & Reich 1986) followed by a restoration of total intensities (Emerson et al. 1979), we obtained for each coverage the I, Q and U maps of the galaxy. All coverages were then combined using the spatial frequency weighting method (Emerson & Gräve 1988), yielding the final maps of total power, polarized intensity, polarization degree and polarization position angles. A digital filtering process, which removes spatial frequencies corresponding to noisy structures smaller than the telescope beam, was applied to the final maps. A special CLEAN procedure to remove instrumental polarization was applied to the polarization data. The original beam of our observations was 113. With the distance modulus of given by Ryan & Visvanathan (1989), corresponding to a distance of 11.9 Mpc, our beamwidth is equivalent to 3.9 kpc in the sky plane. In the galaxy’s disk plane this corresponds to 3.9 and 8 kpc along major and minor axes, respectively.
3 Results
3.1 Total power emission
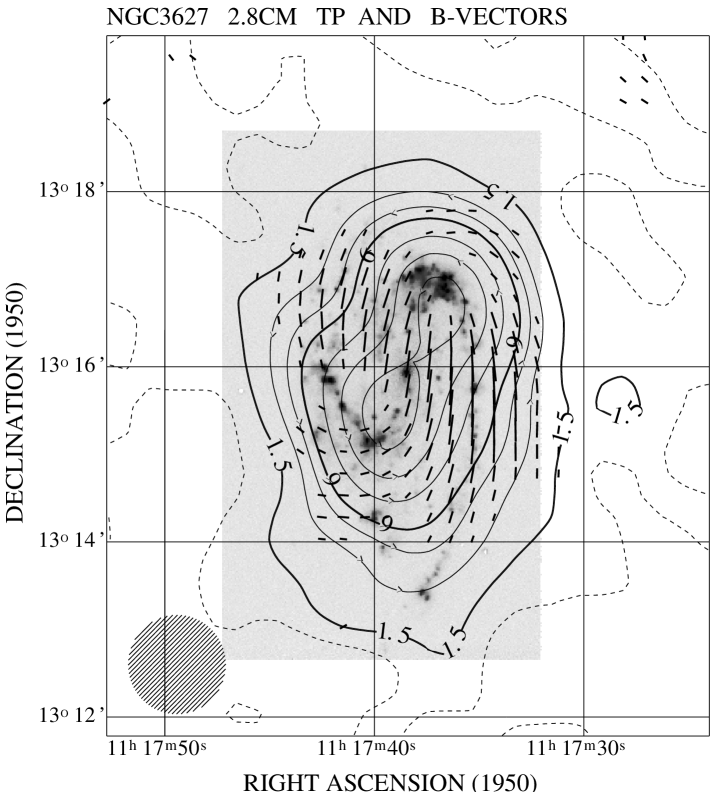
The total power map at the original resolution with B-vectors of polarized intensity is shown in Fig. 1. The map has an r.m.s. noise of 0.6 mJy/b.a. Bright total power peaks are found at the bar ends, where both the CO(1-0) and CO(2-1) maps by Reuter et al. (1996) as well as the H map by Smith et al. (1994) show large accumulations of molecular gas and young star formation products. There is no indication of a bright central source.
The outer disk shows a remarkable asymmetry. The total power emission is considerably more extended and decreases more smoothly towards the south than to the north. In this respect it resembles the optical, CO and H morphology: the western arm running southwards extends to a considerably larger distance from the centre than does the eastern one.
A slight extension towards the east at RA1950 of about and Dec1950 of about is also seen in the map by Urbanik et al. (1985) and must be real. It has no optical counterpart but corresponds roughly to the region where Haynes et al. (1979) found a counter-rotating HI plume, probably caused by tidal interactions within the Leo Triplet.

The integration of the total power map in elliptical rings using an inclination of and a position angle of (both taken from the Lyon-Meudon Extragalactic Database) yields an integrated flux density at 10.55 GHz of 10310 mJy within the radius of 20 kpc, very close to the total flux obtained by Niklas et al. (1995). This value has been combined with available data at lower frequencies collected in Table 1. All values have been converted to the flux density scale by Baars et al. (1977). A weighted power law fit to the data yields a mean spectral index of 0.640.04 (). As the deviations from a single power law are comparable to the errors in the observed flux densities (Fig. 2), a spectral index of 0.64 has been adopted for the whole frequency range between 80 MHz and 10.7 GHz.
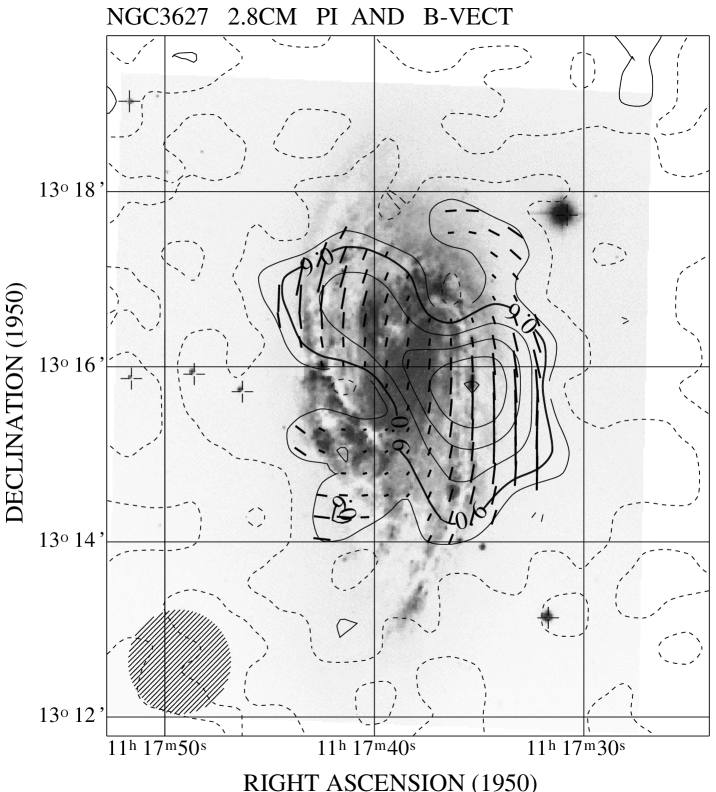
Table 1. The integrated radio spectrum of NGC 3627
| Frequ- | Flux | error | References |
|---|---|---|---|
| ency | density | ||
| [GHz] | [mJy] | [mJy] | |
| 0.080 | 2448 | 410 | Slee (1972) |
| 0.160 | 1680 | 315 | Huchtmeier (1975) |
| 0.430 | 946 | 106 | Lang & Terzian (1969) |
| 0.430 | 938 | 20 | Israel & van der Hulst (1983) |
| 0.611 | 915 | 105 | Lang & Terzian (1969) |
| 0.835 | 580 | 20 | Israel & van der Hulst (1983) |
| 1.415 | 551 | 100 | de la Beaujardiere et al. (1968) |
| 1.415 | 512 | 51 | Hummel (1980) |
| 1.420 | 567 | 72 | Whiteoak (1970) |
| 2.695 | 359 | 28 | de Jong (1967) |
| 2.695 | 206 | 41 | Kazes et al. (1970) |
| 5.000 | 187 | 19 | Whiteoak (1970) |
| 5.000 | 175 | 20 | Sramek (1975) |
| 10.550 | 103 | 10 | This paper |
3.2 Polarized intensity
Our polarized intensity map has an r.m.s. noise of 0.18 mJy/b.a.. It shows two asymmetric lobes with B-vectors locally parallel to the principal arms (Fig. 3). The strongest peak of the polarized brightness, with the polarization degree reaching locally 25%, is located west of the galaxy’s centre, at the position of the unusually straight dust lane segment (see also Fig. 5). No bright star-forming regions are present there. The second, weaker peak does not coincide with a prominent dust lane but is located in the interarm region between the northern segment of the eastern arm and the bar where only small, barely visible dust filaments are present. No polarization was detected in the vicinity of a particularly heavy dust lane segment in the southern part of the eastern arm at RA1950 of about and Dec1950 of , accompanied by a chain of star-forming regions.

With a polarization degree less than 3% the bar ends are generally weakly polarized. However, clear polarization patches in the vicinity of RA1950 of Dec1950 of and RA1950 of Dec1950 of , surrounding the bar ends and being marginally significant in Fig. 3, exceed the noise level after convolving the data to a beamwidth of 13 (Fig. 4). The degree of polarization in these regions is about 5–6%.
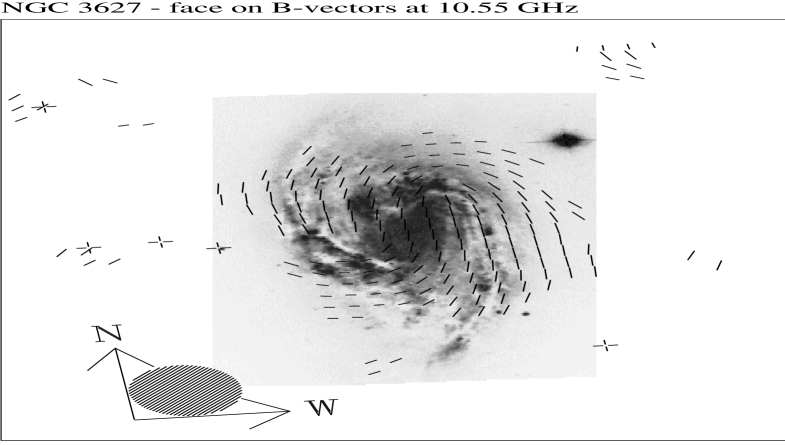
The orientations of the polarization B-vectors corrected to face-on position are shown in Fig. 5. West of the centre they run parallel to a straight segment of the dust lane, following its bend in the southern disk. In the polarized peak in the NE disk the B-vectors in the interarm region follow the direction of the dust lane which itself is only weakly polarized.
In the above mentioned weak polarization patches near the bar ends, best visible in Fig. 4, the B-vectors tend to turn smoothly around the terminal points of the bar. No ordered optical or H structures are present there. Close to the northern bar end the vector orientations smoothly join these in the western arm (see also Fig. 5). Near the southern bar end the B-vectors deviate strongly to the east with a large pitch angle. Across the unpolarized region in the southern part of the eastern arm their orientations jump by about . The question of possible geometrical depolarization at this position is discussed in detail in Sect. 4.
The integration of the polarized intensity map shown in Fig. 3 in the same rings as described in Sect 3.1 yields an integrated polarized flux density of mJy. This implies a mean polarization degree of %. An application of the formula of Segalovitz et al. (1976) yields a mean ratio of regular to total field strengths .
4 Discussion
4.1 Total magnetic field strength and distribution of total power brightness

The integrated radio spectrum of NGC 3627 does not show obvious deviations from a single power-law with a slope (see Fig. 2). Using the integrated flux density, and assuming the minimum-energy or energy equipartition condition we derive a mean total magnetic field strength of G. The regular field component (assuming that it is entirely parallel to the disk) derived from the polarized intensity equals G. This value refers to a magnetic field which is regular over scales larger than our beam of 4 kpc. In computing the above values we assumed a lower limit of the cosmic-ray spectrum of 300 MeV (cf. Beck 1991), a ratio of proton-to-electron density ratio of 100 (Pacholczyk 1970), and a nonthermal disk scaleheight of 1 kpc. The error in the total magnetic field strength includes an uncertainty by a factor of 2 of the proton-to-electron ratio, the disk thickness and the lower energy cutoff, as well as an unknown thermal fraction between 0% and 40%. The mean total magnetic field of NGC 3627 is stronger than average for spiral galaxies (Beck et al. 1996), in spite of the low neutral gas content (Young et al. 1983, Zhang et al. 1993, see also Urbanik 1987).
The bright total power sources at the ends of the bar lie at the positions of huge star-forming molecular complexes, also coincident with HI peaks (Zhang et al. 1993). Their spectral index between 1.49 GHz and 10.55 GHz derived using Condon’s (1987) map is 0.73–0.75, thus nonthermal emission is dominating. Fig. 6 shows the cross-sections along the bar of the total power intensity at 10.55 GHz as well as of the H and CO(1-0) line emission (Smith et al. 1994, Reuter et al. 1996), both convolved to our resolution. All profiles were normalized to their maximum values. The CO profile has a peak at the galaxy’s centre due to the emission from the central molecular complex which in the original maps (Reuter et al. 1996) has the same peak brightness and extent as the CO complexes at the bar ends. However, the H emission lacks the central peak being very weak in the nuclear region. An intense star formation in the central molecular complex with its manifestation in the H line obscured by the dust (abundant in nuclear regions of spiral galaxies) is unlikely as the 10.55 GHz profile (Fig. 6) has a central depression, too. The total power minimum is even deeper than in CO(1-0) after subtracting completely the nuclear region from the original CO map of Reuter et al. (1996). Thus the central molecular complex apparently forms stars at a much lower rate than aggregates of the cold gas at the bar ends. We also note that the HI map of Zhang et al. (1993) shows a central depression, too.
The H emission from the southern bar end is considerably weaker than from the northern one. No such asymmetry exists in radio continuum. The CO(1-0) brightness (thus also the content of an opaque cold gas) is however somewhat higher at the southern than at the northern end of the bar. The mentioned asymmetry of the H emission may thus be caused by a higher absorption in the southern bar end.
The determination of the radial scale length of the nonthermal disk by fitting a beam-smoothed exponential model encounters severe problems because of the high inclination and emission excess at the bar ends. Nevertheless reasonable values are in the range 12–18 corresponding to 4.2–6.2 kpc at the distance of 11.9 Mpc.
4.2 The magnetic field structure
The polarized brightness is strongly peaked at the middle of a straight portion of the dust lane in the western arm. To check whether the emission is resolved we tried to subtract the beam-smoothed point source at the position of the observed brightness maximum. We found that the polarized peak can be decomposed into an unresolved source with a polarized flux density of about 1.8 mJy and an extension along the southern part of the dust lane with a maximum polarized brightness of about 0.8 mJy/b.a.. The eastern lobe is however rather poorly resolved.

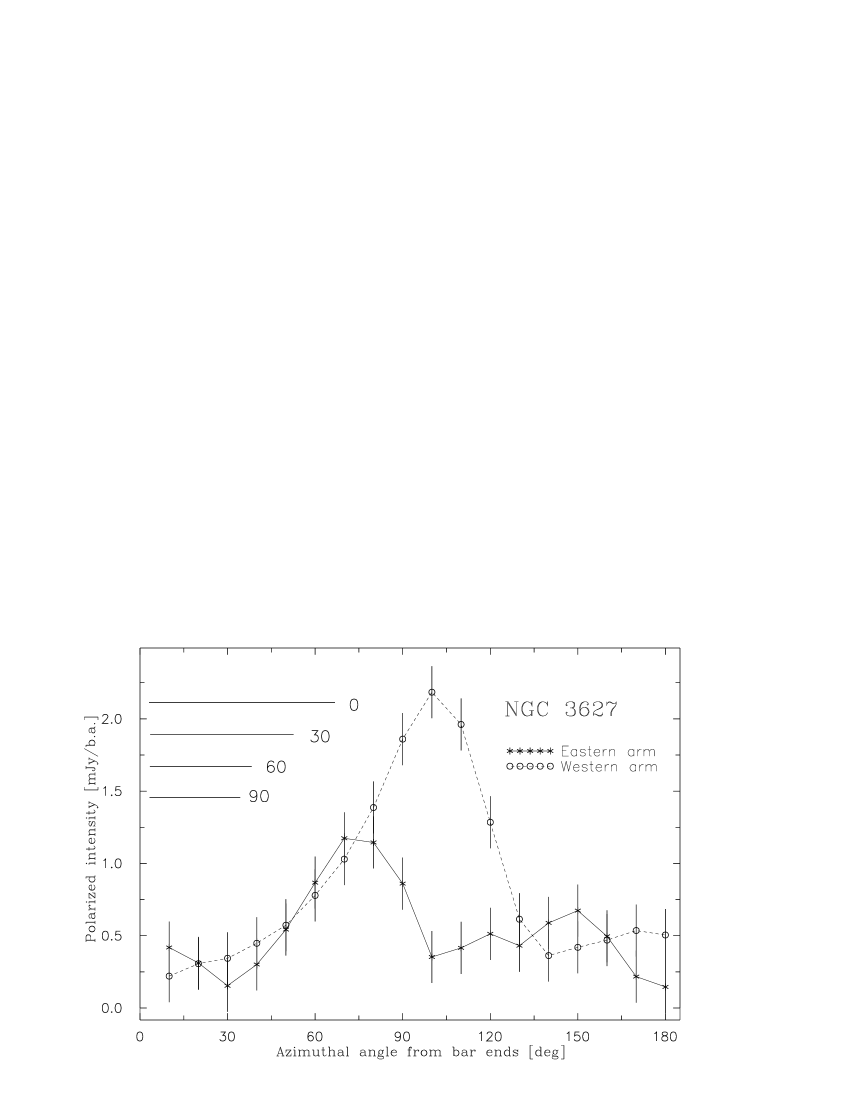
The eastern and western polarized lobes differ not only in their peak brightness but also in their positions and azimuthal extent relative to optical arms. Moving in the galactic disk along the azimuth anticlockwise from the corresponding bar ends, we observe initially a very similar increase of polarized brightness (Fig. 7). However, while the polarized intensity in the western arm continues to rise reaching a maximum at an azimuthal distance of about from the southern bar end, the polarized brightness in the eastern arm drops at an azimuthal distance of from the northern bar end, showing even a local minimum at . As the inner parts of both arms have a similar shape the unpolarized region in the eastern arm does not result from effects related to the spiral arm geometry. The statistical significance of the differences between the profiles was estimated by averaging them in non-overlapping azimuthal angle intervals corresponding to the beam size at the appropriate azimuthal distance from the bar end. This yielded for each profile 7 statistically independent points. Assuming that they represent independent random variables having the r.m.s. dispersion equal to the polarization map noise we found that the probability that the differences between profiles result purely from random fluctuations is smaller than . This result was checked to be independent of the starting point of averaging intervals.
The dust lanes in the western arm and its segment in the inner part of the eastern one coincide with ridges of CO(1-0) emission (Reuter et al. 1996, see also Fig. 8a) tracing very dense, narrow and elongated molecular gas complexes forming in density-wave compression regions. They are also visible in the HI map of Zhang et al. (1993). While the western polarized lobe peaks on the CO ridge and extends along it, the eastern one falls on a hole in the CO emission. On the other hand, the CO (and HI) ridge in the southern part of the eastern arm, being even stronger than the western one, coincides with a completely unpolarized region. The narrow, elongated CO features are thus not always associated with highly polarized regions, as one would expect from pure compression of magnetic field by density waves. We note however, that the western CO ridge is accompanied by only isolated, small HII regions (Smith et al. 1994, Fig. 8b) while the unpolarized CO ridge in the eastern arm hosts a chain of large complexes of H-emitting gas. Faraday effects at 10.55 GHz are negligible, thus the depolarization is primarily of geometrical nature. Tangling of the magnetic field by star-forming process inside the H-bright knot is insufficient: most of the star formation occurs outside of the dust lane, thus it cannot destroy a possible density wave-related field and occupies a too small volume to randomize a smoothly-distributed dynamo field in a whole disk quadrant. However, at the inclination of the polarization degree may be significantly lowered by vertical magnetic field fluctuations developing above the strongly star-forming chain in the eastern arm. They may be caused by vertical chimneys or superbubbles powered by multiple supernova explosions (see e.g. Mineshige et al. 1993, Tomisaka 1998). Some role of Parker instabilities (Parker 1966) cannot be excluded, too. The magnetic field structures stretching perpendicularly to the disk with a significant vertical field component, projected to the sky plane and seen by a large beam together with the disk-parallel field (either concentrated in the dust lane or filling the whole disk), may provide an efficient depolarizing agent.
4.3 Magnetic field models
To judge whether our polarization map is dominated by the density-wave magnetic field component or by the axisymmetric, dynamo-type we need the beam-smoothed models of polarized emission from magnetic fields of an assumed structure. Four kinds of models were computed using techniques described by Urbanik et al. (1997):
-
a)
A model assuming a regular magnetic field concentrated in prominent dust lanes and running along them. In addition the magnetic field running along the bar could be switched on and off.
-
b)
The above model without polarized emission from the strongly star-forming segment of the eastern arm.
-
c)
A model assuming an axisymmetric, spiral, plane-parallel field with a constant intrinsic pitch angle of (mean value for NGC 3627).
-
d)
The above model without polarized emission in the eastern region corresponding to the discussed star-forming arm segment, as expected for strong vertical field fluctuations seen in projection together with a disk-parallel field.
In all models the adopted radial distribution of the total field strength and cosmic ray electron density was set to yield an exponential total power disk with a radial scale length (Sect. 4.1). The intrinsic degree of polarization was rising linearly from in the centre to in the disk outskirts. , and were adjusted to yield the best qualitative agreement of the models with observations.
The best results presented in Fig. 9a–d are as follows:
-
-
The presence of two polarized lobes with B-vectors running parallel to optical spiral arms is reproduced by both axisymmetric and spiral arm models. They both give the position of the western lobe on the middle of the spiral arm, in agreement with observations.
-
-
Both axisymmetric and spiral arm models need an extra depolarizing agent in the star-forming segment of the eastern arm, otherwise both models give the maximum of polarized intensity where observations show a complete lack of polarization (Fig. 9a and c).
-
-
Only the axisymmetric models (with and without an extra depolarization, Fig. 9c and d) correctly place the NE lobe in the interarm space. The spiral arm models (Fig. 9a and b) invariably give the position of the eastern polarized lobe on the position of the prominent dust lane which disagrees with observations.
-
-
Only the axisymmetric models reproduce the observed regions of a weak polarized signal encircling minima at the bar ends with B-vectors turning smoothly from one arm to the other.
-
-
Even with a suppressed polarization in the SE disk region the axisymmetric model yields similar peak amplitudes of both lobes and thus does not reproduce their observed asymmetry. The spiral arm model does this considerably better.
-
-
Another difficulty of the axisymmetric model is a too large extent of the modelled lobes into the outer disk compared to their rather peaked shape in NGC 3627 (especially of the western one). Varying and/or can make the western lobes more peaked but moves it to the interarm space, worsening the agreement with observations.
The last two difficulties of the axisymmetric model can be somewhat relaxed by adding an unresolved polarized source in the middle of the western arm, where its unusually straight part (see Fig. 5) and a steep HI gradient on this disk side are suggestive for an external gas compression (Haynes et al. 1989). However, the difficulties of the spiral arm model can only be improved by adding a widespread, significant axisymmetric magnetic field.

Attempts to reproduce the variations of face-on corrected magnetic pitch angles with the azimuthal angle in the disk are shown in Fig. 10. The observed changes of , and especially a jump near the azimuthal angle of , rule out a purely axisymmetric magnetic field. However, addition of the discussed unpolarized region to our axisymmetric model yields the jump at the correct position, though its exact shape in our simple model is still far from reality. The spiral arm models shown in Fig. 9a and b also have some dip at about 90o, however they yield abrupt jumps of at and . These features do not depend on model parameters, nor on the inclusion or exclusion of low-brightness regions in model maps. They naturally result from the spiral arm shape and cannot be removed without changing the basic model assumptions. In the azimuthal angle range of to the spiral arm model deviates also from the data much more than that assuming the axisymmetric field.
Despite very strong density waves NGC 3627 still shows clear signatures of axisymmetric, dynamo-type magnetic fields. At present it is hard to say whether it dominates the disk field, showing only locally effects of external compression, or whether it coexists with the density-wave component as an important constituent of the global magnetic field. A detailed discrimination between these possibilities needs observations with a considerably higher resolution complemented by extensive computations of a whole grid of detailed quantitative models of NGC 3627, which is beyond the scope of this paper.
5 Summary and conclusions
The strongly interacting Leo Triplet galaxy NGC 3627 has been observed at 10.55 GHz with the 100-m MPIfR radio telescope. Total power and polarization maps with a resolution of 113, very sensitive to extended, diffuse polarized emission were obtained. Their analysis in the context of optical, CO and H data yielded the following results:
-
-
The total power map shows two bright maxima at the bar ends, coincident with strong CO and H peaks. There is no evidence of a significant radio emission from the central region, thus a large central molecular complex (Reuter at al. 1996) has star formation rate much lower than the molecular gas accumulations at the bar ends and its weak H emission is not entirely due to a strong dust obscuration. However, differences in absorption could explain the asymmetry of H emission between the bar ends.
-
-
The polarized emission forms two asymmetric lobes: a strong one peaking on the dust lane bent inwards in the western arm and extending along this arm while a weaker one is located in the interarm space in the NE disk. We also detected diffuse, extended, polarized emission encircling the bar ends away from spiral arms. The polarization B-vectors run parallel to the principal arms, twisting around the bar ends in weakly polarized regions.
-
-
The southern part of the eastern arm is completely depolarized. This region shows signs of strong density wave compression however, it contains a lot of ionized gas indicating strong star formation. At the galaxy’s inclination, the development of vertical magnetic instabilities seen in projection together with the disk-parallel magnetic field could be a suitable depolarizing agent.
-
-
Attempts to qualitatively explain the distribution of polarized intensity and the B-vector geometry in NGC 3627 in terms of simple magnetic field models suggest the presence of a significant (if not dominant) axisymmetric, dynamo-type field. However, to best explain our polarization maps all models need an extra geometrical depolarization e.g. by vertical fields above the discussed star-forming segment of the eastern arm. To reproduce the polarization asymmetry the dynamo-generated field also requires an extra polarized component (probably due to external compression?) at the position of the straight western arm segment.
The present work demonstrates that even in galaxies with strong density waves observations sensitive to extended diffuse polarized emission cannot be fully explained by the density wave-related magnetic field component but show clear signatures of large-scale axisymmetric dynamo-type fields. On the other hand, in the same object the density-wave component may show up much better or become dominant in high-resolution interferometric observations underestimating the extended polarized emission. We believe that combined interferometric and single-dish data on such objects supported by extensive modelling might help to establish the mutual relationships and relative roles of turbulence and density-wave flows in galactic magnetic field evolution.
Acknowledgements.
The Authors wish to express their thanks to Dr Beverly Smith from IPAC for providing us with her H map in a numerical format. We are grateful to numerous colleagues from the Max-Planck-Institut für Radioastronomie (MPIfR) in Bonn, in particular to Drs E.M. Berkhuijsen and P. Reich for their valuable discussions during this work. M.S. and M.U. are indebted to the Directors of the MPIfR for the invitations to stay at this Institute, where substantial parts of this work were done, and to Dr H-P. Reuter for his assistance in using his CO maps. They are also grateful to colleagues from the Astronomical Observatory of the Jagiellonian University in Kraków and in particular to Drs. K. Otmianowska-Mazur and M. Ostrowski for their comments. We thank to the anonymous referee for the valuable remarks. This work was supported by a grant from the Polish Research Committee (KBN), grants no. 578/P03/95/09. and 962/P03/97/12. Large parts of computations were made using the HP715 workstation at the Astronomical Observatory in Kraków, partly sponsored by the ESO C&EE grant A-01-116 and on the Convex-SPP machine at the Academic Computer Centre ”Cyfronet“ in Kraków (grant no. KBN/C3840/UJ/011/1996 and KBN/SPP/UJ/011/1996).References
- (1) Arp H., 1966, ApJS 14, 1
- (2) Baars J.W.M., Genzel R., Pauliny-Toth, I.I.K., Witzel A., 1977, A&A 61, 99
- (3) Beck R., 1991, A&A 251, 15
- (4) Beck R., Hoernes P., 1996, Nat 379, 47
- (5) Beck R., Brandenburg A., Moss D., Shukurov A., Sokoloff D., 1996, Ann. Rev. A&A 34, 155
- (6) Chiba M., 1993, in Krause F., Rädler K.-H., Rüdiger G. (eds.) Proc. IAU Symp. 157, The Cosmic Dynamo. Kluwer, Dordrecht p.373
- (7) Condon J.J., 1987, ApJS 65, 485
- (8) de Jong M.L., 1967, ApJ 150, 1
- (9) de la Beaujardiere O., Kazes I., Le Squeren A.M., Nguyen-Quang-Rieu, 1968, Ann. Astrophys. 31, 387
- (10) Emerson D.T., Gräve R., 1988, A&A 190, 353
- (11) Emerson D.T., Klein U., Haslam C.G.T., 1979, A&A 76, 92
- (12) Haslam C.G.T., 1974, A&AS 15, 333
- (13) Haynes M.P., Giovanelli R., Roberts M.S., 1979, ApJ 229, 83
- (14) Huchtmeier W.K., 1975, A&A 44, 101
- (15) Hummel E., 1980, A&AS 41, 151
- (16) Israel F.P., van der Hulst J.M, 1983, AJ 88, 1736
- (17) Kazes I., Le Squeren A.M., Nguyen-Quang-Rieu, 1970, ApL 6, 193
- (18) Krause M., Beck R., Hummel E., 1989, A&A 217, 17
- (19) Lang K.R., Terzian Y, 1969, ApL 3, 29
- (20) Mestel L., Subramanian K., 1991, MNRAS 248, 677
- (21) Mineshige S., Shibata K., Shapiro P.R., 1993, ApJ 409, 663
- (22) Moss D., 1997, MNRAS, 289, 554
- (23) Moss D., Korpi M., Rautiainen P., Salo H., 1998, A&A 329, 895
- (24) Morsi H.W., Reich W., 1986, A&A 163, 313
- (25) Neininger N., Horellou, C., 1996, in W. Roberge & D. Whittet (eds), Polarimetry of the Interstellar Medium, ASP Conf. Ser. 97, 592
- (26) Niklas S., Klein U., Braine J., Wielebinski, R., 1995, A&AS, 114, 21
- (27) Pacholczyk A.G., 1970, Radio Astrophysics, Freeman, S. Francisco
- (28) Parker E.N., 1966, ApJ 145, 811
- (29) Reuter H.-P., Sievers A.W., Pohl M., Lesch H., Wielebinski R., 1996, A&A 306, 721
- (30) Ryan S., Visvanathan N. 1989, IAU Circular No. 4730
- (31) Schmidt A., Wongsowijoto A., Lochner O. et al., 1993, MPIfR Technical Report No. 73, MPIfR, Bonn
- (32) Segalovitz A., Shane W.W., de Bruyn A.G., 1976, Nat 264, 222
- (33) Sievers A.W., Reuter H.-P., Haslam C.G.T., Kreysa E., Lemke R., 1994, A&A 281, 681
- (34) Slee O.B., 1972, ApL 12, 75
- (35) Smith B.J., Harvey P.M., Colome C., Zhang C.Y., DiFrancesco J., 1994, ApJ 425, 91
- (36) Soida M., Urbanik M., Beck R., 1996, A&A 312, 409
- (37) Sramek R.A., 1975, AJ 80,771
- (38) Subramanian K., Mestel L., 1993, MNRAS 265, 649
- (39) Tabara H., Inoue M., 1980, A&AS 39, 379
- (40) Tomisaka K., 1998, MNRAS 298, 797
- (41) Urbanik M., 1987 The Radio Studies of Spiral Galaxies at 10.7 GHz, Jagiellonian University press, Habil. Diss. 126, Krakow
- (42) Urbanik M., Gräve R., Klein U., 1985, A&A 152, 291
- (43) Urbanik M., Elstner D., Beck R., 1997, A&A 326, 465
- (44) Visser H.C.D., 1980, A&A 88, 159
- (45) Whiteoak J.B., 1970, ApLett. 5, 29
- (46) Wielebinski R., Krause F., 1993 A&A Rev. 4, 449
- (47) Young J.S., Tacconi L.J., Scoville M., 1983, ApJ 269, 136
- (48) Zhang X., Wright M., Alexander P., 1993, ApJ 418, 100