HST observations of the very young SMC “blob” N 88A††thanks: Based on observations with the NASA/ESA Hubble Space Telescope obtained at the Space Telescope Science Institute, which is operated by the Association of Universities for Research in Astronomy, Inc., under NASA contract NAS 5-26555., ††thanks: Based on observations obtained at the European Southern Observatory, La Silla, Chile.
Abstract
High-resolution Hubble Space Telescope images have allowed us for the first time to resolve the compact SMC ionized “blob” N 88A (diameter 3′′.5 or 1 pc). This very young H ii region, which is hatching from its natal molecular cloud, is heavily affected by absorbing dust associated with the cloud. The interstellar reddening towards N 88A is on average 1.5 mag and strikingly rises to more than 3.5 mag in a narrow dust band crossing the core of the H ii region. Such a high extinction is unprecedented for an H ii region in the metal-poor SMC. We present the photometry of some 70 stars lying towards the OB association at the center of which lies N 88A. The exciting star(s) of N 88A is not detected, due to the heavy extinction. The chronology of star formation is discussed for the whole region.
Key Words.:
Stars: early-type – dust, extinction – H ii regions – individual objects: N 88 – Galaxies: Magellanic Clouds1 Introduction
The Hubble Space Telescope (HST) offers a unique opportunity for studying very young massive star formation regions in the outer galaxies. The fact that the Small Magellanic Cloud (SMC) is the most metal-poor galaxy observable with very high angular resolution makes it an ideal laboratory for investigating star formation in very distant galaxies reminiscent of those populating the early Universe.
Our search for the youngest massive stars in the Magellanic Clouds started almost two decades ago on the basis of ground-based observations. This led to the discovery of a distinct and very rare class of H ii regions in these galaxies, that we called high-excitation compact H ii “blobs” (HEBs). So far only five HEBs have been found in the LMC: N 159-5, N 160A1, N 160A2, N 83B-1, and N 11A (Heydari-Malayeri & Testor 1982, 1983, 1985, 1986, Heydari-Malayeri et al. 1990) and two in the SMC: N 88A and N 81 (Testor & Pakull 1985, Heydari-Malayeri et al. 1988a). These objects are expected to harbor newborn massive stars.
The first part of our HST project studying the H ii “blobs” was devoted to the SMC N 81 (Heydari-Malayeri et al. hey99 (1999), hereafter Paper I). The Wide Field Planetary Camera 2 (WFPC2) observations allowed us to resolve N 81 and discover a tight cluster of newborn massive stars embedded in this nebula of 10′′ across. The WFPC2 images also uncovered a striking display of violent phenomena such as stellar winds, shocks, and ionization fronts, typical of turbulent starburst regions.
The SMC “blob” N 88A is part of the H ii region N 88 (Henize hen (1956)), or DEM 161 (Davies et al. dav (1976)) which lies in the Shapley Wing at 2∘.2 (2.4 kpc) from the main body of the SMC. Other H ii regions lying towards the Wing are from west to east N 81, N 84, N 89, and N 90. The HEB nature of N 88A was first recognized by Testor and Pakull (tes (1985)) who used CCD imaging at 2′′ resolution through H, H, and [O iii] filters and IDS spectroscopy (4′′ 4′′ aperture) to study the central component N 88A. They found a high excitation object ([O iii]/H = 7.8) with an interstellar extinction = 1.7 mag. The chemical abundances in N 88 had previously been determined by Dufour & Harlow (dh (1977)) who, using a 10′′ 79′′ slit, found a low-metal content typical of the chemical composition of the SMC. CCD photometry and spectroscopy of 10 stars lying around N 88A were carried out by Wilcots (wil (1994)) using the ctio 90 cm telescope. However, the ground-based observations in general were unable to reveal the internal morphology and stellar content of N 88A.
The HST was used for imaging and FOS spectroscopy of N 88A (Kurt et al. kurt (1995)). These pre-costar observations, in spite of the effort made in data analysis, could not clearly show the internal details of N 88A. Garnett et al. (gar (1995)) revisited the chemical abundances in N 88A on the basis of HST ultraviolet FOS (0′′.7 2′′.0 aperture) and ground-based spectra.
In this paper we present recent HST observations (GO 6535) of N 88A and its surroundings. In the following sections we elaborate on the extinction and emission properties of each component and suggest a plausible scenario on the star formation history of this region.
2 Observations and data reduction
The observations of N 88A described in this paper were obtained with WFPC2 on board the HST on August 31, 1997 using the wide- and narrow-band filters (F300W, F467M, F410M, F547M, F469N, F487N, F502N, F656N). The observational techniques, data reduction procedures, and photometry are similar to those explained in detail in Paper I. A composite image is presented in Fig. 1.
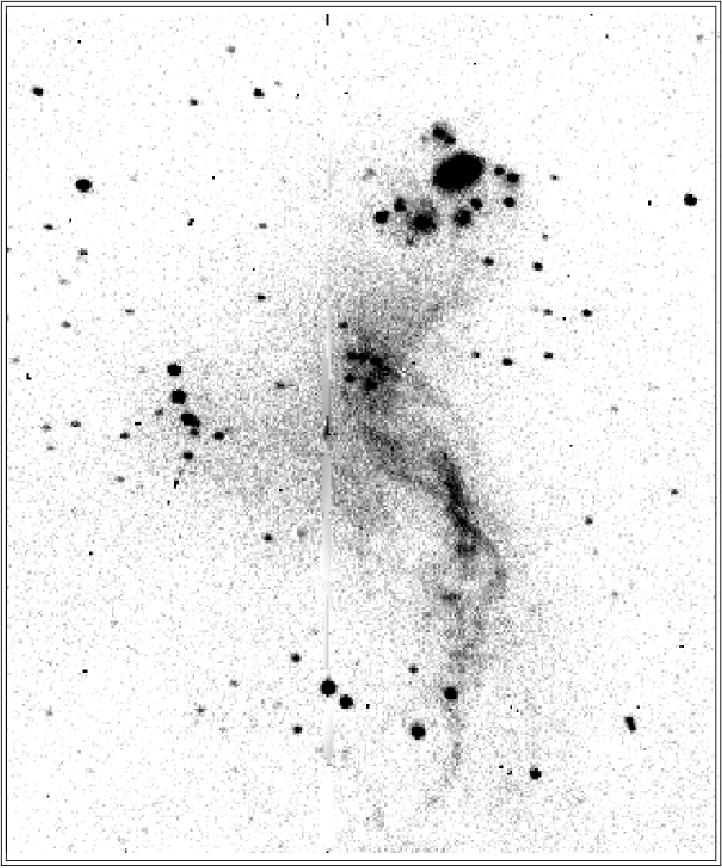
The ESO EFOSC Camera at the 3.6 m telescope was also used on 4 June 1988 for imaging N 88 through a narrow H filter (ESO#507, 6565.5 Å, = 12 Å) with exposure times of 1 and 5 minutes. The detector was a RCA CCD chip (#11) with 0′′.36 pixels and the seeing was 1′′.5 (fwhm). This H image is displayed in Fig. 2. Due to its relatively short exposure, this image displays only the brightest part of the H ii emission.
3 Results
3.1 Morphology
N 88 is a relatively large concentration of ionized gas with several components (Fig. 1a). From the central region emanate a number of fine-structure filaments running southwards over 40′′ ( 10 pc) which can be seen in the “true-color” composite image (Fig. 1a). The larger field of the H image obtained with EFOSC (Fig. 2) shows a veil of thin filaments curling southwards over more than 20 pc and brightening at some points.
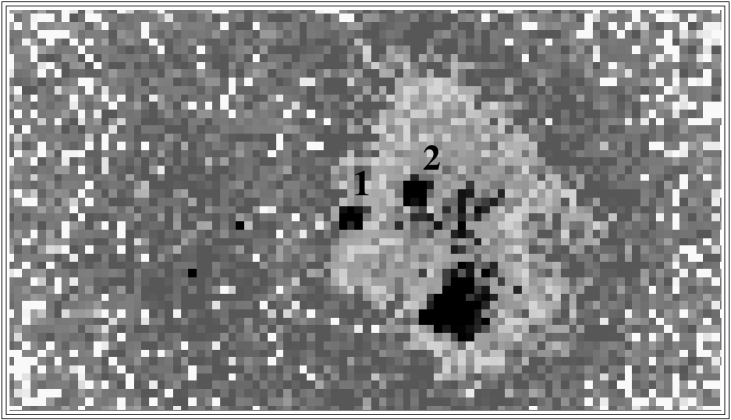
The main component, N 88A, is a compact, high excitation H ii region 3′′.5 ( 1 pc) in diameter surrounded by seven diffuse H ii regions, labelled B to H in Fig. 1b. N 88A has a complex morphology. An absorption lane crossing the nebula from north to south appears as an undulating yellow structure in Fig. 1c (see Sect. 3.2 for more details). West of this structure lies the brightest part of N 88A, a small core of diameter 0′′.3 (0.08 pc), especially apparent on the H image (white spot in Fig. 1c; see also Fig. 5). N 88A is clearly ionization-bounded to the north-west since the sharp edge visible in Fig. 1 indicates an ionization front in that direction. It is limited to the south-east by the weaker component B. N 88B resembles a hollow sphere – a shell – centered on the bright star #55 (see Sect. 3.4). N 88A and N 88B are clearly in interaction, as shown by the brightening of the shell between the two regions. Moreover, we note a high excitation narrow filament showing up in the [O iii] emission north-east of N 88B (Fig. 1a). The other components are situated farther away from N 88A. N 88 E-F-G and H appear as more extended, diffuse, and spherical H ii regions.
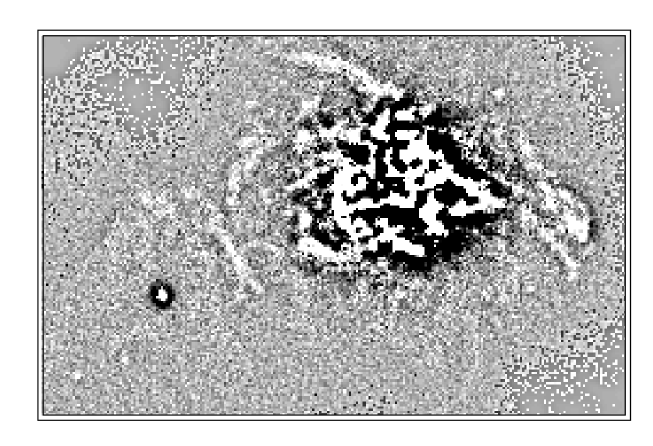
Several lower excitation arc-shaped features and filaments emerging from N 88A run outward in the north-east and south-west directions. These wind-induced structures are best seen in Fig. 3, which presents an un-sharp masked image of N 88A-B created from H. In this image large-scale structures have been suppressed by the technique explained in Paper I. Note also the mottled structure of the main component A, even in the direction of the absorbing lane, indicating a very inhomogeneous medium, both for gas and dust, with a typical cell size of 0′′.4 (0.1 pc).
3.2 Nebular reddening
The Balmer H/H intensity ratio map of N 88A-B is presented in Fig. 4a. The most striking feature is the presence of a heavy absorption lane of 0′′.7 2′′.3 ( 0.2 0.7 pc2) in size, running in a north-south direction, which divides the bright N 88A into two parts. The mean H/H ratio in the lane is 7.10 1.42 (rms), corresponding to = 2.5 mag if the LMC interstellar reddening law is used (Prévot et al. pre (1984)), and reaches values as high as 10, or 3.5 mag. The mean ratio for component A, 4.81 1.46, corresponds to 1.5 mag. The extinction is also high towards component B, where H/H keeps a relatively uniform value of 4.27 0.90 ( 1.1 mag). For comparison, previous lower resolution spectroscopic observations yielded = 1.1 mag (Dufour & Harlow dh (1977), using a 10′′ wide slit) and = 1.7 mag (Testor & Pakull tes (1985), 4′′ 4′′ slit). The H/H map was used to de-redden the H flux on a pixel to pixel basis.
The G component shows a sharp dividing line in the middle separating it into two distinct halves, one much fainter than the other. This feature should be due to absorbing dust.
3.3 Ionized gas emission
The total H flux of component A is F(H) = 3.45 10-12 erg s-1 cm-2 (accurate to 3%). Correcting for the reddening (Sect. 3.2) gives a flux F0(H) = 1.85 10-11 erg s-1 cm-2. The total flux for both components A and B is F0(H) = 1.97 10-11 erg s-1 cm-2. Thus, component B provides less than 10% of the total H energy. A Lyman continuum flux of = 2.10 1049 photons s-1 can be estimated for component A, using a distance of 66 kpc, if the H ii region is ionization-bounded. A single O6V star can account for this ionizing flux (Vacca et al. vacca (1996), Schaerer & de Koter sch (1997)). Similarly, the Lyman continuum flux corresponding to component B is 3.5 1047 photons s-1. If we take the estimated UV fluxes at face values, the exciting star of component B should be an early B type star. However, these should be considered as lower limits, since the H ii regions are not ideally ionization-bounded.
We find an rms electron density of 2700 cm-3 for component A from the total H flux, a = 14 000 ∘ K (Garnett et al. gar (1995)), and assuming a radius of 0.5 pc for the object. The corresponding total ionized mass of N 88A is 45 .
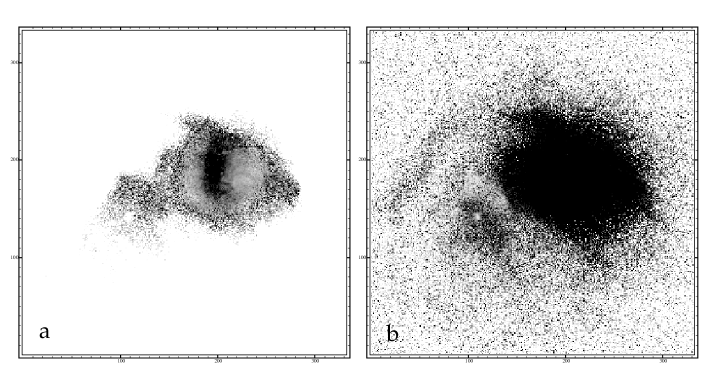
The [O iii]5007/H intensity map displays an extended high excitation zone towards N 88A (Fig. 4b), where the ratio has a mean value of 7. The ratio peaks at some points to values as high as 9. Taking 14 000 ∘ K and = 2 700 cm-3, a ratio [O iii]/H 7 indicates an ionic abundance O++/H+ 9.4 10-5. Since the mean SMC oxygen abundance is O/H 10.5 10-5 (Dufour duf (1984)), this means that 90% of the oxygen atoms in N 88A are in the form of doubly ionized O++ ions, in agreement with the result of Garnett et al. (gar (1995)). The [O iii]/H ratio for component B is comparatively much smaller, with a mean value of 4.
The high excitation narrow filament emanating from component A is clearly visible in the [O iii]/H map, suggesting that the O++ ions in the filament may be excited by shock collisions.
3.4 Stars
The HST images reveal tens of previously unknown stars towards the N 88 complex. Many of them, especially the brightest ones, are gathered in several small groups often un-resolved in the EFOSC image (Fig. 2). The photometry obtained for the 79 brightest stars of the field using the filters wide (F300W), Strömgren (F410M), Strömgren (F467M), He ii (F469N), and Strömgren (F547) is presented in Table 1 which also gives the coordinates (J2000) of each star. These stars are identified by their numbers in Fig. 6 and Table 1. The capital letters in the last column of the table identify the associated H ii regions. The spectral types of the ionizing stars proposed by Wilcots (wil (1994)), as well as their labels, are also listed in the table. Note that the present observations show the exciting star of N 88D to be double (#71 & #72) and the given type corresponds therefore to both of them. Table 1 is available in electronic form at the Centre de Données astronomiques de Strasbourg (via anonymous ftp to cdsarc.u-strasbg.fr or via http://cdsweb.u-strasbg.fr/Abstract.html).
While the exciting stars of the fainter H ii regions are easily identified on the true-color image, a remarkable point is the absence of prominent stars towards the main component A. Nevertheless, we detect two faint stars embedded in the core of N 88A east of the absorption lane (Fig. 5). These are stars #1 and #2 with and 18.3 mag and colors and +0.6 mag respectively. It should however be underlined that these magnitudes are very uncertain since the stars lie in a very bright area where nebular subtraction is not straightforward. A third fainter star ( 20 mag), not visible in Fig. 5, is marginally detected just to the east of the bright H core of N 88A. Its position suggests it as being a good candidate for an exciting star.
Star #55, situated towards the center of component B, has mag and is one of the brightest in the field. It has a highly elongated PSF profile which is due to multiplicity (at least three components are resolved). This may be the star “” detected by Wilcots (wil (1994)) relatively close to the brightest part of N 88. Its spectrum shows strong He i 4471 Å and He ii 4686, but weak He ii 4541 Å indicative of an O9 V star. If this spectrum belongs actually to #55, it should correspond to the brightest component of this system.
The color-magnitude diagram for the brightest stars of the sample (Fig. 7) shows a main sequence with the bulk of the stars centered on Strömgren colors and mag, typical of massive OB stars (Relyea & Kurucz rk (1978)). These colors are equivalent to a Johnson = –0.30 (Turner tur (1990)), which indicates a negligible reddening (Conti et al. conti (1986)). This result is due to the fact that the main sequence is overwhelmingly dominated by stars lying outside the N 88 complex and means that the areas situated north-east, east, south, and south-west of N 88 are not affected by dust.
However, taking a sub-sample made up of all the exciting stars of the N 88 H ii regions (excluding stars #1 & #2), we find the Strömgren colors and which indicate = –0.21 corresponding to a visual extinction of = 0.3 mag. This clearly confirms that the N 88 complex is the most reddened part of this region of the SMC. Of particular interest are stars #60 and #61 situated immediately north-west of N 88A (Fig. 1b). Assuming that these two stars are of O type, their colors suggest an extinction of 1 mag. This result has implications for the location of the molecular cloud (Sect. 4.4).
The brightest stars of the sample are #39, #12, #19, and #6. The first two are blue stars and the latter ones are red. The red population showing up in the color-magnitude diagram represents a collection of evolved field stars as well as young massive ones contaminated by nebulosity/dust. For instance, it is noteworthy that the very red stars #76, and #74 are not associated with a nebulosity, and this suggests that they should be evolved field stars.
In the particular case of stars #1 and #2 lying inside N 88A, in spite of their red colors, they may be young blue stars suffering from heavy extinction. Assuming that star #1 has an O9 V spectrum with = –4.4 mag (Vacca et al. vacca (1996)), and considering that the distance modulus of SMC is 19 mag, then an extinction of = 3.4 mag is necessary to make it appear as faint as 18 mag. Similarly, in order for a star of spectral type O6 V (Sect. 3.3) to have an 20 mag, we need an 6 mag. Thus, the main exciting star(s) of N 88A should remain hidden in the optical due to the presence of dust by an extinction of at least 6 mag.

4 Discussion and concluding remarks
4.1 Comparison with N 81
The most striking feature of N 88A is its lack of prominent stars, even at the WFPC2 resolution. This indicates a young age and is supported by other observational findings about N 88A: its compactness, its high density, and its exceptionally high extinction. These facts considered together suggest that N 88A is just hatching from its natal molecular cloud. Stars #1 and #2 are probably among the exciting sources of N 88A. Other exciting stars may still be embedded in the densest part of the nebula, such as he bright spot highlighted in Fig. 1c and Fig. 5, and remain invisible due to the high dust content. Compared with N 81, N 88A is probably younger since N 81 is more extended, less dense, and exhibits several of its exciting stars (Paper I). Although N 81 and N 88A are both very young, the present observations underline their difference. Apart from the exciting stars aspect, N 88A is surrounded by several diffuse H ii regions. In contrast, N 81 is an isolated object. These facts point to the diversity of star forming regions belonging to the same chemical environment and also to the necessity of observing each case in detail.
On the other hand, the whole N 88 region is very reminiscent of the LMC N 59 region studied by Armand et al. (arm (1992)). N 88 and N 59 contain several individual H ii regions, in various evolutionary states. They range from compact, bright and young components with a lot of dust hiding the exciting stars (N 88A and N 59A) to diffuse, spherical and evolved regions (N 88E-F-G-H and N 59C), and also to shell components (N 88B and N 59B which contains a supernova remnant). Similarly, both regions display a filamentary structure which results from the interaction of the strong stellar winds emitted by the massive stars with the surrounding medium, as well as small scale brightness variations pointing to a very inhomogeneous distribution of matter or dust inside or around these objects.
4.2 Associated neutral material
CO emission from the molecular cloud associated with N 88A was observed by Israel et al. (isco (1993)) using the ESO-SEST 15 m telescope. They detected the 12CO(1–0) emission with a brightness temperature of 750 mK, a width of 2.5 km s-1 and a radial velocity of VLSR = 147.8 km s-1. The molecular cloud is much brighter than the one associated with N 81 (Paper I) and ranks among the few sources in the SMC detected in 13CO(1–0) (Israel et al. isco (1993)). Rubio et al. (rub (1996)) mapped the molecular cloud in 12CO(1–0) and 12CO(2–1) transitions using the SEST telescope with respective spatial resolutions of 43′′ ( 13 pc) and 22′′ ( 7 pc). It turns out that the cloud is in fact relatively small, 1′ (18 pc) in size in the east-west direction and slightly smaller in north-south. More recently, Rubio et al. (private communication) have detected molecular transitions 12CO(3–2), CS(2–1), CS(3–2), HCO+(1–0) which probably originate from the hot and dense core of the cloud. Molecular hydrogen emission also has been detected towards N 88A (Israel & Koornneef ik88 (1988)).
The SMC is known to have an overall complex structure with several overlapping neutral hydrogen layers (McGee & Newton McGee (1981)). We used the recent observations by Stanimirovic et al. (stan (1998)), with a resolution of 98′′ (30 pc), to examine the H i emission towards N 88. The H i spectrum profile has two main emission peaks at 150 and 175 km s-1. The column density corresponding to their sum is 3.12 1021 atoms cm-2, slightly smaller than that corresponding to N 81 (Paper I). It seems that the molecular cloud is correlated with the smaller velocity H i component.
4.3 Extinction
N 88 was detected as a very bright IRAS source (Schwering & Israel schwering (1990)). The fact that near infrared photometry of N 88A, at , , , and bands obtained using a 10′′ aperture (Israel & Koornneef ik91 (1991)), is consistent with the IRAS spectrum (12, 25, 60, and 100 m) suggested that the IR emission arises mostly from the compact object in the aperture. Moreover, these authors found a quite red – color of more than 2 mag indicating the presence of hot dust.
Our HST images for the first time show the heavy concentration of absorbing dust towards the inner parts of the H ii region. More strikingly, the extinction rises to as high as 3.5 mag in a narrow band towards the bright core of the nebula. This high absorption is quite unexpected for a metal-poor galaxy like the SMC. In fact N 88A holds the record of extinction among ionized nebulosities in the SMC. The correlation between the zones of the high excitation and high extinction is an argument in favor of the physical association of the dust with hot gas.
It is important to know the properties of this dust. Roche et al. (roche (1987)) studied 8–13 m spectra of N 88A and found a featureless continuum without any evidence of dust signatures attributed to silicate grains. This led them to the conclusion that the dust is likely composed of carbon grains. Further progress in this area requires appropriate IR observations using the highest spatial resolutions.
4.4 Star formation
The N 88 nebular complex results from a small starburst which occurred recently in the Wing of the SMC. While the main stars creating N 88A are not visible, the other members of the starburst show up in the HST images (Fig. 1). The stars exciting the diffuse H ii regions (C to H) were formed in the outer, less dense parts of the molecular cloud, whereas the compact, very dusty N 88A is associated with the core of this small molecular cloud (Sect. 4.2). The cloud must be to the north-east of N 88A, as indicated by the ionization front detected in that direction (Sect. 3.1) and also by the fact that stars #60 and #61 situated north of the front are heavily affected by extinction (Sect. 3.4). This is further supported by ground-based higher exposure images showing a large front north-west of N 88A beyond which no stars are visible (Fig. 2; also Testor & Pakull tes (1985)).
The case of component B is interesting. Although it is, like N 88A, apparently related to the core of the molecular cloud, it seems more evolved. In fact N 88B has a significantly lower density and less dust, and reveals its exciting star (#55). It can be considered that N 88A has resulted from sequential star formation, that is the collapse of the shock/ionization front layer created by stars #55. If so, we are dealing with two successive generations of stars formed in the core of the molecular cloud.
The stars situated towards N 88 are also known as HW 81 following Hodge & Wright (hw (1977)) who surveyed the SMC in search of OB associations. The present observations reveal the fainter members of this association. The HST images also resolve another association in the direction of N 88. Lying 50′′ (15 pc) south-east of N 88A, at the lower-left corner of Fig. 1a, HW 82 (Hodge & Wright hw (1977)) is composed of a dozen stars several of which are tightly packed multiple ones. HW 82 is not associated with ionized gas, and a relatively large number of its stars are red. At present we do not know whether the red and blue stars are co-spatial members of the same cluster. Nevertheless, the facts that the ionized gas is already dispersed from there and that no significant amount of dust is detected (Sect. 3.4) suggest that HW 82 represents an older burst of star formation in the Wing. This is confirmed by the larger field of EFOSC H image (Fig. 2) which shows no H ii regions south of the HST field of view. Star formation must have therefore proceeded from south to north and N 88 is the most recent site of star formation in this part of the SMC.
A noteworthy aspect of the stellar population towards N 88 is the presence of several tight clusters or multiple systems uncovered by the present observations. For example, the exciting star of N 88B (#55) is a multiple system of at least three components. There are also at least two stars hidden inside N 88A, while both N 88C and D are excited by two blue stars of comparable brightness. Note also the tight cluster in HW 82 composed of stars #9, #10, #11, #12 , and #13. These cases present new pieces of evidence in support of collective formation of massive stars in the SMC (see Paper I for a brief discussion).
An intriguing, though unanswered question, is related to the origin of the large-scale filamentary veil visible in the EFOSC image. Our true-color image shows that filaments originating from north-east of N 88 run towards the anonymous blue cluster in the south (stars #16, #17, #21, #22, #23, and #24). However, the veil significantly brightens south of that cluster and bends to the south-east. In consequence, the association of the veil with the N 88 region is not established. It is possible that this filamentary structure is linked to the neighboring huge bubble nebula DEM 167 (Davies et al. dav (1976)).
Acknowledgements.
We are grateful to an anonymous referee for his careful reading of the manuscript and comments that contributed to substantially improve the paper. VC would like to acknowledge the financial support from a Marie Curie fellowship (TMR grant ERBFMBICT960967).References
- (1) Armand C., Deharveng L., Caplan J., 1992, A&A 265, 504
- (2) Conti P.S., Garmany D., Massey P., 1986, AJ 92, 48
- (3) Davies, R.D. Elliott K.H., Meaburn J., 1976, MNRAS 81, 89
- (4) Dufour R.J., 1984, in Structure and Evolution of the Magellanic Clouds, eds. S. van den Bergh & K.S. de Boer, Reidel, Dordrecht, p. 353
- (5) Dufour R.J., Harlow W.V., 1977, ApJ 216, 706
- (6) Fruchter A.S., Hook R.N, 1998, PASP, submitted (astro-ph/9808087)
- (7) Garnett D.R., Skillman, E.D., Dufour R.J., et al., 1995, ApJ 443, 64
- (8) Henize K.G., 1956, ApJS 2, 315
- (9) Heydari-Malayeri M., Beuzit J.-L., 1994, A&A 287, L17
- (10) Heydari-Malayeri M., Testor G., 1982, A&A 111, L11
- (11) Heydari-Malayeri M., Testor G., 1983, A&A 118, 116
- (12) Heydari-Malayeri M., Testor G., 1985, A&A 144, 98
- (13) Heydari-Malayeri M., Testor G., 1986, A&A 162, 180
- (14) Heydari-Malayeri M., Le Bertre T., Magain P., 1988, A&A 195, 230
- (15) Heydari-Malayeri M., Van Drom E., Leisy P., 1990, A&A 240, 481
- (16) Heydari-Malayeri M., Rosa M.R., Zinnecker H., Deharveng L., Charmandaris V., 1999, A&A 344, 848 (Paper I)
- (17) Hodge P.W., Wright F.W., 1977, The Small Magellanic Cloud (Seattle: University of Washington Press)
- (18) Israel F. P., Koornneef J., 1988, A&A 190, 21
- (19) Israel F. P., Koornneef J., 1991, A&A 248, 404
- (20) Israel F.P., Johansson L.E.B., Lequeux J., et al., 1993, A&A 276, 25
- (21) Kurt C.M., Dufour J., Garnett E.D., et al., 1995, RexMexAA 3, 223
- (22) McGee R.X., Newton L.M., 1981, Proc. Astron. Soc. Australia 4, 189
- (23) Prévot M.L., Lequeux J., Maurice E., Prévot L., Rocca-Volmerange B., 1984, A&A 132, 389
- (24) Relyea L.J., Kurucz R.L., 1978, ApJS 37, 45
- (25) Roche P.F., Aitken D.K., Smith C.H., 1987, MNRAS 228, 269
- (26) Rubio M., Lequeux J., Boulanger F., et al., 1996, A&AS 118, 263
- (27) Schaerer D., de Koter A., 1997, A&A 322, 598
- (28) Schwering P.B.W., Israel F.P., 1990, Atlas and Catalogue of Infrared Sources in the Magellanic Clouds, Kluwer, Dordrecht
- (29) Stanimirovic S., Stavley-Smith L., Dickey J.M., et al., 1998, MNRAS, in press
- (30) Testor, G. Pakull M., 1985, A&A 145, 170
- (31) Turner D.G., 1990, PASP 102, 1331
- (32) Vacca W.D., Garmany C.D., Shull J.M., 1996, ApJ 460, 914
- (33) Wilcots E.M., 1994, AJ 108, 1674
| Star | wide | He ii | Notes | |||||
|---|---|---|---|---|---|---|---|---|
| (J2000) | (J2000) | (F300W) | (F410M) | (F467M) | (F469N) | (F547M) | ||
| 1 | 1:24:08.10 | -73:09:03.98 | – | – | 19.1 | – | 18.2 | |
| 2 | 1:24:08.02 | -73:09:03.84 | – | – | 18.9 | – | 18.3 | |
| 4 | 1:24:25.42 | -73:10:25.20 | 14.83 | 16.35 | 16.64 | 16.70 | 16.78 | |
| 5 | 1:24:27.12 | -73:10:24.20 | 15.56 | 17.10 | 17.22 | 17.14 | 17.49 | |
| 6 | 1:24:27.58 | -73:10:19.97 | 16.82 | 16.94 | 16.21 | 16.27 | 15.64 | |
| 7 | 1:24:27.39 | -73:10:19.50 | 16.84 | 18.21 | 18.27 | 18.42 | 18.55 | |
| 8 | 1:23:57.75 | -73:10:17.77 | 16.51 | 17.74 | 17.92 | 17.95 | 18.08 | |
| 9 | 1:24:28.00 | -73:10:15.11 | 16.97 | 18.19 | 18.36 | 18.59 | 18.78 | |
| 10 | 1:24:28.29 | -73:10:13.63 | 13.54 | 15.34 | 15.63 | 15.73 | 15.82 | |
| 11 | 1:24:27.83 | -73:10:13.06 | 17.91 | 18.92 | 19.02 | 19.30 | 19.39 | |
| 12 | 1:24:28.23 | -73:10:12.98 | 13.39 | 15.14 | 15.36 | 15.42 | 15.55 | |
| 13 | 1:24:28.09 | -73:10:12.39 | 16.42 | 17.86 | 18.03 | 17.92 | 18.27 | |
| 14 | 1:24:21.08 | -73:10:10.12 | 15.86 | 17.33 | 17.43 | 17.47 | 17.44 | |
| 15 | 1:24:20.38 | -73:10:10.01 | 17.32 | 18.36 | 18.48 | 18.54 | 18.68 | |
| 16 | 1:24:14.68 | -73:10:10.16 | 16.19 | 17.62 | 17.79 | 17.89 | 17.83 | |
| 17 | 1:24:16.27 | -73:10:08.28 | 18.52 | 18.28 | 17.80 | 17.76 | 17.48 | |
| 18 | 1:24:26.37 | -73:10:06.22 | 18.91 | 19.43 | 19.43 | 19.80 | 19.49 | |
| 19 | 1:24:28.52 | -73:10:05.18 | 16.25 | 16.19 | 15.90 | 15.98 | 15.62 | |
| 21 | 1:24:14.42 | -73:10:03.10 | 15.77 | 17.34 | 17.48 | 17.49 | 17.60 | |
| 22 | 1:24:15.30 | -73:10:01.91 | 15.29 | 16.89 | 17.00 | 17.10 | 17.16 | |
| 23 | 1:24:16.08 | -73:10:01.38 | 14.96 | 16.60 | 16.76 | 16.93 | 17.03 | |
| 24 | 1:24:13.82 | -73:10:01.50 | 17.72 | 18.98 | 19.06 | 19.30 | 19.40 | |
| 25 | 1:24:07.39 | -73:10:01.03 | 16.47 | 17.71 | 17.93 | 17.93 | 17.87 | |
| 26 | 1:23:59.63 | -73:09:48.58 | 15.06 | 16.63 | 16.79 | 16.77 | 16.90 | |
| 27 | 1:24:02.37 | -73:09:48.20 | 15.72 | 17.35 | 17.47 | 17.57 | 17.68 | |
| 28 | 1:24:22.40 | -73:09:43.50 | 15.40 | 16.82 | 16.99 | 17.19 | 17.28 | |
| 30 | 1:24:03.05 | -73:09:34.47 | 15.30 | 16.65 | 16.85 | 16.82 | 16.97 | |
| 32 | 1:24:06.48 | -73:09:32.96 | 15.20 | 16.80 | 16.91 | 16.94 | 17.01 | |
| 34 | 1:24:11.99 | -73:09:26.63 | 16.74 | 18.11 | 18.12 | 18.14 | 18.13 | |
| 35 | 1:24:02.55 | -73:09:25.42 | 16.70 | 17.87 | 17.89 | 17.98 | 18.06 | |
| 37 | 1:24:07.62 | -73:09:21.20 | 18.97 | 19.50 | 19.52 | 19.71 | 19.26 | |
| 38 | 1:24:11.09 | -73:09:20.59 | 14.20 | 15.72 | 15.95 | 15.89 | 15.94 | H (B0 III, s3) |
| 39 | 1:24:13.94 | -73:09:19.47 | 13.39 | 14.98 | 15.31 | 15.30 | 15.28 | |
| 40 | 1:24:27.56 | -73:09:17.94 | 17.72 | 18.89 | 18.88 | 18.99 | 19.01 | |
| 41 | 1:24:08.69 | -73:09:19.24 | 18.15 | 18.53 | 19.07 | 19.06 | 18.96 | |
| 43 | 1:24:07.69 | -73:09:17.90 | 18.01 | 18.92 | 19.37 | 19.14 | 19.36 | |
| 46 | 1:24:07.21 | -73:09:15.60 | 15.25 | 16.63 | 16.92 | 16.81 | 16.88 | C |
| 48 | 1:24:07.37 | -73:09:14.63 | 15.88 | 17.32 | 17.63 | 17.54 | 17.56 | C |
| 53 | 1:24:20.76 | -73:09:08.05 | 17.75 | 18.41 | 18.57 | 18.63 | 18.81 | |
| 54 | 1:24:15.05 | -73:09:06.80 | 17.39 | 18.21 | 18.65 | 18.68 | 18.95 | |
| 55 | 1:24:09.09 | -73:09:06.05 | 15.21 | 16.57 | 16.62 | 16.62 | 16.57 | B |
| 56 | 1:24:14.64 | -73:09:05.42 | 16.91 | 18.08 | 18.18 | 18.30 | 18.35 | |
| 57 | 1:24:05.66 | -73:09:05.06 | 15.50 | 16.97 | 17.26 | 17.26 | 17.29 | F |
| 60 | 1:24:07.65 | -73:09:02.22 | 18.51 | 19.83 | 19.91 | 19.33 | 19.63 | |
| 61 | 1:24:06.91 | -73:09:01.67 | 17.87 | 19.04 | 19.43 | 18.85 | 18.92 | |
| 62 | 1:24:09.05 | -73:08:55.90 | — | 19.70 | 18.85 | 18.54 | 18.02 | |
| 63 | 1:24:10.88 | -73:08:55.38 | 17.78 | 18.86 | 19.02 | 18.79 | 19.08 | |
| 64 | 1:24:09.88 | -73:08:53.65 | 15.49 | 16.86 | 16.96 | 16.95 | 17.00 | G (O9.5 I, #4) |
| 65 | 1:24:26.97 | -73:08:44.10 | 15.74 | 17.28 | 17.54 | 17.46 | 17.69 | |
| 66 | 1:24:22.46 | -73:08:41.42 | 15.29 | 16.52 | 16.78 | 16.76 | 16.89 | |
| 67 | 1:24:13.95 | -73:08:36.73 | 17.21 | 18.29 | 18.27 | 18.51 | 18.57 | |
| 68 | 1:24:17.58 | -73:08:29.33 | 18.48 | 19.37 | 18.90 | 19.58 | 19.11 | |
| 69 | 1:24:24.35 | -73:08:28.14 | 16.26 | 17.75 | 17.99 | 18.03 | 18.13 | |
| 70 | 1:24:16.32 | -73:08:14.91 | 17.74 | 18.53 | 18.95 | 18.66 | 19.15 | |
| 71 | 1:24:04.97 | -73:09:15.11 | 15.05 | 16.55 | 16.54 | 16.46 | 16.46 | D (B0 III, #6) |
| 72 | 1:24:04.97 | -73:09:14.38 | 14.97 | 16.42 | 16.48 | 16.31 | 16.41 | D |
| 73 | 1:24:04.80 | -73:09:07.55 | – | – | – | – | – | E (B0 V, #5) |
| 74 | 1:24:05.23 | -73:10:03.39 | 20.42 | 19.96 | 18.69 | 18.52 | 17.84 |
Table 1. (continued)
| Star | wide | He ii | Notes | |||||
|---|---|---|---|---|---|---|---|---|
| (J2000) | (J2000) | (F300W) | (F410M) | (F467M) | (F469N) | (F547M) | ||
| 75 | 1:24:02.35 | -73:10:01.49 | 19.65 | 19.23 | 18.86 | 18.94 | 18.46 | |
| 76 | 1:24:27.49 | -73:10:31.19 | 22.46 | 20.12 | 19.13 | 18.96 | 18.18 | |
| 77 | 1:24:29.48 | -73:10:17.94 | 16.24 | 17.70 | 17.82 | 17.94 | 18.05 | |
| 78 | 1:24:12.68 | -73:09:16.29 | 14.65 | 16.20 | 16.43 | 16.46 | 16.46 | |
| 79 | 1:24:12.71 | -73:09:13.91 | 16.92 | 18.14 | 18.32 | 18.42 | 18.43 |