A Radio Galaxy at 11affiliation: Based on observations at the W.M. Keck Observatory, which is operated as a scientific partnership among the University of California, the California Institute of Technology, and the National Aeronautics and Space Administration. The Observatory was made possible by the generous financial support of the W.M. Keck Foundation.
Abstract
We report the discovery of the most distant known AGN, the radio galaxy TN J09242201 at . The radio source was selected from a new sample of ultra–steep spectrum (USS) sources, has an extreme radio spectral index , and is identified at near–IR wavelengths with a very faint, object. Spectroscopic observations show a single emission line at Å which we identify as Ly. The –band image, sampling rest frame –band, shows a multi–component, radio–aligned morphology, typical of lower–redshift radio galaxies. TN J09242201 extends the near–IR Hubble, or , relation for powerful radio galaxies to , and is consistent with models of massive galaxies forming at even higher redshifts.
1 Introduction
How did the first objects form after the Big Bang? In hierarchical cosmogonies (e.g., Turner 1998), the first gravitationally bound systems may have been stars and small star–forming systems which merge to form galaxies in large dark matter halos. Arising from the end products of stellar evolution and mergers, central black holes could grow to become extremely massive. However, it is not clear how this process would work at very high redshifts, where little time is available. It has been suggested that primordial black holes may form well before their host galaxies (Loeb 1993). In any case, accretion events fueling massive black holes are thought to manifest themselves as active galactic nuclei (AGN; e.g., Rees 1984). Due to their extreme luminosity, AGN are convenient beacons for exploring these formative, ‘Dark Ages’ of our Universe.
Extragalactic radio sources have played an important role in identifying active galaxies at high redshifts. The most distant known galaxies have consistently been radio–selected until only very recently. In this Letter we report the discovery of a radio galaxy at . At this redshift it is the most distant known AGN, surpassing even quasars for the first time in 36 years. Throughout this paper we use , , and . For these parameters, 1″ subtends 7.0 kpc at and the Universe is only 1.08 Gyr old, corresponding to a lookback time 91.1% of the age of the Universe.
2 Source Selection
The most efficient method to find high–redshift radio galaxies (HzRGs) is to combine two well–known techniques. The first is to select radio sources with ultra–steep spectra (USS) at radio wavelengths, i.e. very red radio colors (e.g., Chambers, Miley, & van Breugel 1990). Most powerful radio galaxies have radio spectral energy distributions which steepen with frequency. Therefore, at fixed observing frequencies more distant sources exhibit steeper spectra (e.g., van Breugel et al. 1999).
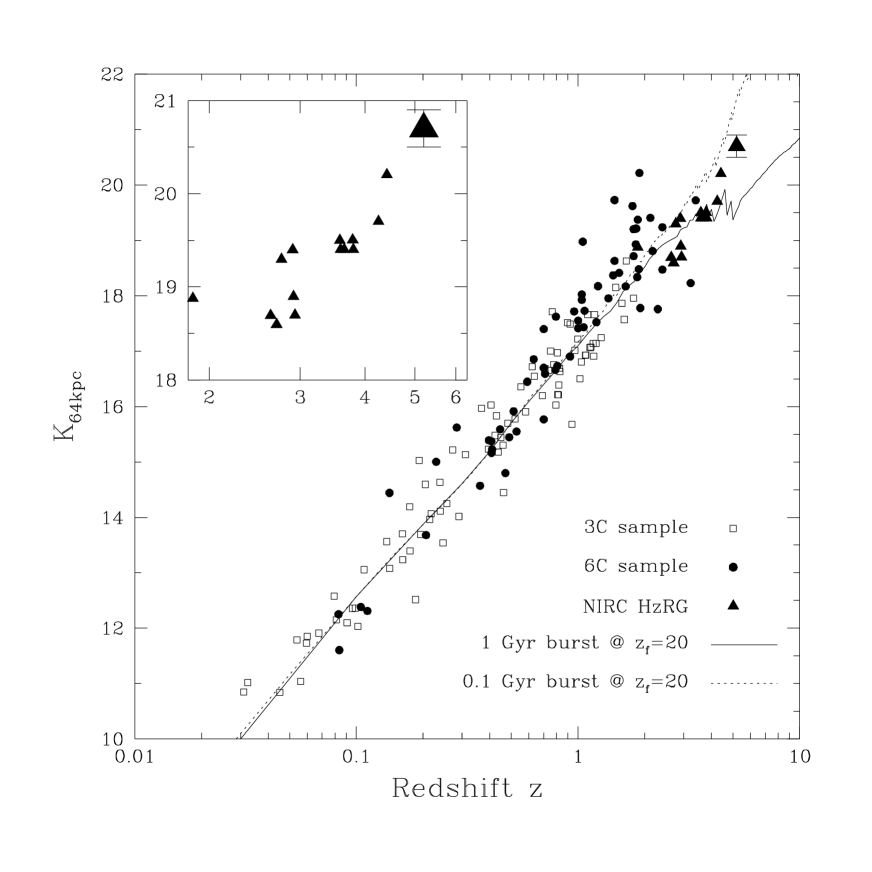
A second selection criterion relies upon the magnitude–redshift relationship at infrared wavelengths, or Hubble diagram, for powerful radio galaxies (Figure 1). At low redshifts (), powerful radio galaxies are uniquely associated with massive galaxies. The well–behaved diagram suggests that such galaxies can be found through near–IR identification. This has been confirmed by the discovery of many radio galaxies which approximately follow the relationship, even to the highest redshifts and despite significant morphological evolution (van Breugel et al. 1998).
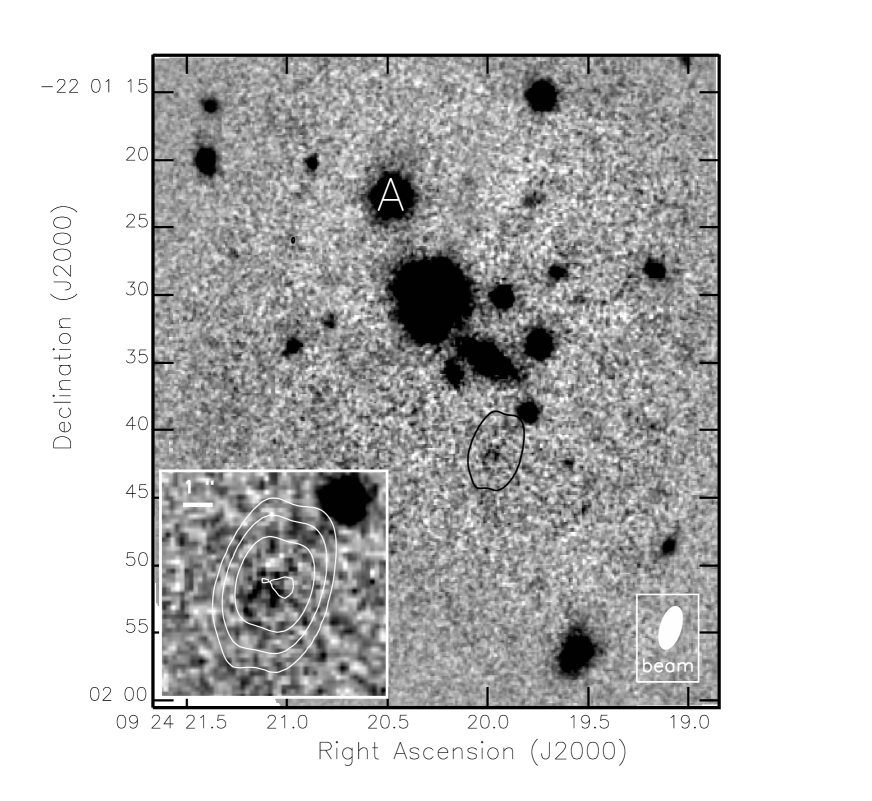
Using several new, large radio surveys we constructed a USS sample (; De Breuck et al. 1999 [DB99]) which is much larger, more accurate, and reaches fainter flux density limits than previous such samples. TN J09242201, with , is among the steepest sources of our sample. VLA observations at 4.85 GHz show the source is a slightly resolved double, with mJy, centered at , (Figure 2).
3 Observations
We obtained images of TN J09242201 using NIRC (Matthews & Soifer 1994) at the Keck I telescope. We integrated for 32 minutes on UT 1998 April 18 in photometric conditions with seeing, and again for 32 minutes on UT 1998 April 19 through light cirrus with seeing. The observing procedures, calibration, and data reduction techniques were similar to those described in van Breugel et al. (1998). The final image comprising 3840 s of on–source integration is shown in Figure 2. Using circular apertures of diameter, encompassing the entire object, we measure for night 1, and 21.45 for night 2. We estimate that . If TN J09242201 is at (§4), then redshifted [O ] 3727 at m would be included in the passband and some of the -band flux might be due to line emission.
We obtained spectra of TN J09242201 through a 15 wide, 3′ long slit using LRIS (Oke et al. 1995) at the Keck II telescope. The integration times were 5400 s on UT 1998 December 19 (position angle 0∘) and 4400 s on UT 1998 December 20 (position angle 180∘); both nights were photometric with 06 seeing. The observations used the 150 lines mm-1 grating ( Å; Å), sampling the wavelength range 4000 Å to 1m. Between each 1800 s exposure, we reacquired offset star A (see Fig. 2), performed 20″ spatial shifts to facilitate removal of fringing in the reddest regions of the spectra, and blind offset the telescope to return TN J09242201 within the slit. We calculated the dispersion using a NeAr lamp spectrum taken immediately subsequent to the observations (RMS variations of 0.50 Å), and adjusted the zero point according to telluric emission lines. Final wavelength calibration is accurate to 1 Å. The spectra were flux calibrated using observations of Feige 67 and Feige 110 obtained on each night and were corrected for foreground Galactic extinction using a reddening of determined from the dust maps of Schlegel, Finkbeiner, & Davis (1998).
We find a strong, single emission line at Å which shifts by Å between the two nights. (Figure 3; Table 1). The cause of the line offset is unclear, though it may be related to problems LRIS was experiencing with slippage in the movable guider at the time of the observations. The relative brightnesses of other sources on the slit vary between each 1800 s observation, indicating that despite our precautions of reacquiring the target after each exposure, guider slippage must have caused some variations in telescope offsetting. These slight pointing changes may have caused the slit to sample different regions of spatially–extended, line–emitting gas. Indeed, TN J09242201 shows two separate components at (Figure 2), and emission–line regions of HzRGs are known to be kinematically complex (Chambers, Miley & van Breugel 1990; van Ojik et al. 1997).
Line parameters are measured with a Gaussian fit to the emission line and a flat (in ) fit to the continuum (Table 1). Equivalent width values were derived from a Monte Carlo analysis using the measured line flux and continuum values with errors, subject to the constraint that both are positive. For UT 1998 Dec. 19, when no continuum was reliably detected, we quote the 90% confidence limit, Å. For UT 1998 Dec. 20, when continuum was marginally detected, we quote the 90% confidence interval, Å.
4 Redshift Determination
As discussed by Dey et al. (1998) and Weymann et al. (1998) for two Ly-emitting field galaxies, a solitary, faint emission line at red wavelengths is most likely to be either low-redshift [O ] 3727 or high-redshift Ly. Similar arguments are even more persuasive for HzRGs because of their strong, rich emission line spectra. For example, if the line at 7530 Å were [O II] at then composite radio galaxy spectra (McCarthy 1993; Stern et al. 1999a) indicate that the TN J09242201 spectrum should have shown C ] 2326 at 4699 Å with % the strength of [O II], and Mg 2800 at 5653 Å with % the strength of [O II]. Similar arguments rule out identifying the emission line with H at or [O ] 5007 at , since in these cases even stronger confirming lines should have been seen.
The large equivalent widths also argue against identifying the emission line with [O II] at , implying Å (night 1) and Å (night 2). Radio galaxy composites typically have rest–frame [O II] equivalent widths of Å (McCarthy 1993; Stern et al. 1999a), though active galaxies with extreme are occasionally observed ( Å; Stern et al. 1999b). The equivalent width of TN J09242201 is more typical of high-redshift Ly which is often observed with rest frame values of several 100 Å in HzRGs (Table 2). We also note that the observations from the second night show that Ly is attenuated on the blue side, presumably due to associated and intervening hydrogen gas, as is commonly observed in HzRGs (e.g., van Ojik et al. 1997; Dey 1997) and normal star-forming galaxies at (e.g., Dey et al. 1998).
Finally, the faint -band magnitude of TN J09242201 conforms to the extrapolation of the relation to (Figure 1). Identifying the emission line with [O II] would imply a severely underluminous HzRG (by 3 – 4 mag). Therefore, the most plausible identification of the emission line in TN J09242201 is with Ly at a (mean) observed wavelength of 7530 Å and . Table 1 gives the dereddened emission–line fluxes.
5 Discussion
Among all known HzRGs, TN J09242201 is fairly typical in radio luminosity, equivalent width, and velocity width (Table 2). But this source has the steepest radio spectrum, consistent with the relationship for radio galaxies (e.g., Röttgering et al. 1997). TN J09242201 also has the smallest linear size, perhaps indicating that the source is relatively young and/or embedded in a denser environment compared to the other HzRGs, commensurate with its large velocity width (van Ojiket al. 1997) and very high redshift. Together with 8C 143563, TN J09242201 appears underluminous in Ly, which might be caused by absorption in a relatively dense cold and dusty medium. Evidence for cold gas and dust in some of the most distant HzRGs has been found from sub–mm continuum and CO–line observations of 8C 143563 and 4C 41.17 (e.g., Ivison et al. 1998).
Our observations of TN J09242201 extend the Hubble diagram for powerful radio galaxies to . Simple stellar evolution models are shown in Figure 1 for comparison with the HzRG. Despite the enormous –correction effect (from at to at ) and strong morphological evolution (from radio–aligned to elliptical structures), the diagram remains a powerful phenomenological tool for finding radio galaxies at extremely high redshifts. Deviations from the relationship may exist (Eales et al. 1997; but see McCarthy 1998), and scatter in the values appears to increase with redshift.
The clumpy, radio–aligned morphology resembles that of other HzRGs (van Breugel et al. 1998; Pentericci et al. 1998). If the continuum is dominated by star light, as appears to be the case in the radio–aligned HzRG 4C 41.17 at (Dey et al. 1997), then for TN J09242201Ṫhen we can derive a SFR of 200 M⊙ yr-1, assuming a Bruzual & Charlot (1999) GISSEL stellar evolution model with metallicity , no extinction, and a Salpeter IMF. This SFR value is highly uncertain due to the unknown, but competing, effects of extinction and [O II] emission–line contamination, but is not unreasonable. It is 2.5 times less than in 4C 41.17, which has using the same aperture (Chambers et al. 1990). TN J09242201 may be a massive, active galaxy in its formative stage, in which the SFR is boosted by induced star formation (e.g., Dey et al. 1997). For comparison other, ‘normal’ star forming galaxies at have 10 – 30 times lower SFR (; Dey et al. 1998; Weymann et al. 1998; Spinrad et al. 1998).
Recent and Lyman–break galaxy observations have suggested a possible divergence of star formation and AGN activity at high redshift (Steidel et al. 1999), contrary to what was previously thought (e.g., Haehnelt, Natarajan & Rees 1998). However, if starbursts and AGN are closely coupled, as suggested to explain the ultraluminous infrared galaxies (Sanders & Mirabel 1996), then young AGN may inhabit especially dusty, obscured galaxy systems. To obtain a proper census of the AGN population at the very highest redshifts therefore requires samples which avoid optical photometric selection and extinction bias, such as our cm–wavelength/-band radio galaxy sample.
As emphasized by Loeb (1993), if massive black holes form in a hierarchical fashion together with their host galaxies, this process must be quick and efficient, as available timescales are short: at the Universe is only 1 Gyr old. It is unclear how this could be done, so other models, where primordial massive black holes form soon after the Big Bang and prior to the beginning of galaxy formation, may require additional investigation.
References
- (1)
- (2) Bruzual, A. G., & Charlot, S. 1999, personal communication
- (3) Chambers, K. C., Miley, G. K., & van Breugel, W. J. M. 1990, ApJ, 363, 21
- (4) De Breuck, C., van Breugel, W., Röttgering, H., Miley, G., & Carilli, C. 1999, A&A, in preparation (DB99)
- (5) Dey, A. 1997, in Proc. Mass Ejection from Active Galactic Nuclei, ed. N. Arav, I. Schlossman & R. Weymann 1997, ASP Conf. Series, 128, 35
- (6) Dey, A., van Breugel, W., Vacca, W. D., & Antonucci, R. 1997, ApJ, 449, 698
- (7) Dey, A., Spinrad, H., Stern, D., Graham, J. R., & Chaffee, F. 1998, ApJ, 498, L93
- (8) Eales, S., Rawlings, S., Law-Green, D., Cotter, G., & Lacy, M. 1997, MNRAS, 291, 593
- (9) Haehnelt, M., Natarajan, P. & Rees. M. J. 1998, MNRAS, 300, 817
- (10) Ivison, R. J. et al. 1998, ApJ, 494, 211
- (11) Loeb, A. 1993, ApJ, 403, 542
- (12) McCarthy, P. J. 1993, ARA&A, 31, 639
- (13) McCarthy, P. J. 1998, in proc. “KNAW colloquium: High Redshift Galaxies”, (Kluwer: Dordrecht), in press
- (14) Mathews, K., & Soifer, B. T., 1994, in Proc. Infrared Astronomy with Arrays: The Next Generation, ed. I. McClean (Dordrecht: Kluwer, pg. 239)
- (15) Oke, J. B. et al. 1995, PASP, 107, 375
- (16) Pentericci, L. et al. 1998, A&A, 341, 329
- (17) Rawlings, S., Lacy, M., Blundell, K., Eales, S, Bunker, A. & Garrington, S. 1996, Nature, 383, 502
- (18) Rees, M. J. 1984, ARA&A, 22, 471
- (19) Röttgering, H., van Ojik, R., Chambers, K., van Breugel, W., & de Koff, S. 1997, A&A, 326, 505
- (20) Sanders, D. B. & Mirabel 1996, ARA&A, 34, 749
- (21) Schlegel, D. J., Finkbeiner, D. P., Davis, M. 1998, ApJ, 500, 525
- (22) Spinrad, H. et al. 1998, AJ, 116, 2617
- (23) Steidel, C. C., Adelberger, K., Giavalisco, M., Dickinson, M., & Pettini, M., 1999, ApJ, in press, astro-ph/9811399
- (24) Stern, D. et al. 1999a, AJ, in press, astro-ph/9811344
- (25) Stern, D., Bunker, A. J., Spinrad, H., & Dey, A. 1999b, in preparation
- (26) Turner, M. S 1998, in “Axions ’98”, ed. P.Sikive (Nucl. Phys. Proc. B), in press, astro-ph/9811366
- (27) van Ojik, R., Röttgering, H. J. A., Miley, G. K., & Hunstead, R. W. 1997, A&A, 317, 358
- (28) van Breugel, W., Stanford, S. A., Spinrad, H., Stern, D., & Graham, J. R. 1998, ApJ, 502, 614
- (29) van Breugel, W., De Breuck, C., Röttgering, H., Miley, G., & Stanford, A., 1999, in proc. “Looking Deep in the Southern Sky”, (Springer: Berlin), p. 236
- (30) Weymann, R. et al. 1998, ApJ, 505, L95
- (31)
| UT Date | 1998 Dec 19 | 1998 Dec 20 |
|---|---|---|
| [Å] | ||
| [10-17 erg cm-2 s-1] | ||
| [10-21 erg cm-2 s-1 Å-1] | ||
| [Å] | ||
| FWHMLyα [km s-1] |
| Name | FWHMLyα | Radio size | Reference | |||||
|---|---|---|---|---|---|---|---|---|
| (erg s-1) | (erg s-1) | (Å) | (km s-1) | (kpc) | ||||
| TN J09242201 | 5.19 | 1.3 | 7.5 | 1.63 | 115 | 1500 | 8 | This paper; DB99 |
| 6C 0140326 | 4.41 | 11 | 1.3 | 1.15 | 1500 | 19 | Rawlings et al. (1996) | |
| 8C 143563 | 4.25 | 3.2 | 11 | 1.31 | 670: | 1800 | 28 | Spinrad et al. (1995) |
| TN J13381942 | 4.13 | 20 | 2.3 | 1.31 | 700: | 1300 | 37 | DB99 |
| 4C 41.17 | 3.798 | 12 | 3.3 | 1.25 | 100 | 1400 | 99 | Dey et al. (1997) |
| 4C 60.07 | 3.79 | 16 | 4.1 | 1.48 | 150 | 2900: | 65 | Röttgering et al. (1997) |