22institutetext: Astrophysics Research Institute, Liverpool John Moores University, Twelve Quays House, Egerton Wharf, Birkenhead L41 1LD, United Kingdom; e-mail: sas@astro.livjm.ac.uk
33institutetext: Harvard-Smithsonian Center for Astrophysics, 60 Garden St., Cambridge, MA 02138 USA. e-mail: falco@cfa.harvard.edu
The gravitationally lensed quasar Q2237+0305 in X-rays: ROSAT/HRI detection of the “Einstein Cross”
Abstract
We report the first detection of the gravitationally lensed quasar Q2237+0305 in X-rays. With a ROSAT/HRI exposure of 53 ksec taken in Nov./Dec. 1997, we found a count rate of 0.006 counts per second for the combined four images. This corresponds to an X-ray flux of erg/cm2/sec and an X-ray luminosity of erg/sec (in the ROSAT energy window 0.1-2.4 keV). The ROSAT/HRI detector is not able to resolve spatially the four quasar images (maximum separation 1.8 arcsec). The analysis is based on about 330 source photons. The signal is consistent with no variability, but with low significance. This detection is promising in view of the upcoming X-ray missions with higher spatial/spectral resolution and/or collecting power (Chandra X-ray Observatory, XMM and ASTRO-E).
Key Words.:
Cosmology: observations – gravitational lensing – Galaxies: quasars: individual: Q2237+0305 – X-rays: galaxies – X-rays: general1 Introduction
The quasar Q2237+0305 at a redshift of is lensed by a relatively nearby galaxy at (Huchra et al. (1985)). It is a quadruply-imaged case, and one of the best investigated lens systems, both observationally and theoretically. For recent work, see Chae et al. (1998); Yonehara et al. (1998) and Blanton et al. (1998); Mediavilla et al. (1998), Schmidt et al. (1998), respectively.
Q2237+0305 was the first multiple quasar system in which microlensing was detected (see, e.g. Irwin et al. (1989), Corrigan et al. (1991), Lewis et al. (1998)). The analysis of well covered microlensing light curves of a quasar can be used to uncover its size and structure (Wambsganss et al. 1990, Wambsganss & Paczyński 1992). A number of groups are optically monitoring this system to measure any microlensing effects. The expected time delay between the four images is only of order a day (Rix et al. (1992); Wambsganss & Paczyński (1994)) and hence unlikely to be determined from optical light curves.
Recently, HST observations in the UV allowed the determination of highly accurate relative positions of the four images (Blanton et al. 1998). With ground-based spectrophotometry, an extended arc comprising three of the four images was discovered (Mediavilla et al. 1998).
Not very much is known yet about gravitationally lensed quasars in X-rays. The double quasar Q0957+561 was seen with HEAO-1 and with ROSAT, and dramatic differences in the flux of image B of up to a factor of five were observed chartas95 (Chartas et al. 1995). There is an X-ray selected gravitationally lensed quasar, RX J0911.4+0551 which was found in the ROSAT All-Sky Survey bade97 (Bade et al. 1997). With and an X-ray luminosity of ergs/s it is a very X-ray bright quasar. The two bright images are separated by 0.8 arcsec. High-resolution optical/infrared imaging revealed four images with a maximum distance of 3.1 arcsec (bur98 (Burud et al. 1998), see also Munoz et al. 1999 or http://cfa-www.harvard.edu/castles for HST/NICMOS data obtained by the CASTLES collaboration).
Here we present the first X-ray detection of Q2237+0305, an analysis of a ROSAT/HRI observation. The combined X-ray emission of the four quasar images is clearly detected, though at a relatively low count rate. Due to the coarse resolution of the ROSAT/HRI the individual images are not resolved.
2 Observations
We observed the quasar Q2237+0305 with the ROSAT/HRI (Trümper (1983)) for a total exposure time of seconds. The observations took place between November 20 and December 5, 1997. The Standard Analysis Software System (SASS) determined an average background rate of 0.0032 counts/sec/arcmin2 which – multiplied by the “exposure time” yields an average of 171.7 background counts per square arcmin in total.
To determine the count rate of Q2237+0305, we extracted the photons in circles of different sizes and subtracted the background, whose count rate was determined from empty regions of considerably larger size. A circle with a radius of 15 arcseconds centered on the pixel with the highest count (RA 22:40:30.21, Dec +03:21:28.7; J2000) resulted in a total number of 361 counts. The average number of background photons determined from ten “empty” circles nearby resulted in 39.8 background photons. This leaves 321.2 source counts, which results in a count rate of 6.0 counts per kilosecond. A similar determination with a much larger extraction radius of 50 arcseconds (100 pixels) centered on position RA 22:40:30.0, Dec +03:21:28.7 produced 800 counts. The average background for this size is 466.8 counts, which results in 333.2 source counts and a count rate of counts/ksec.
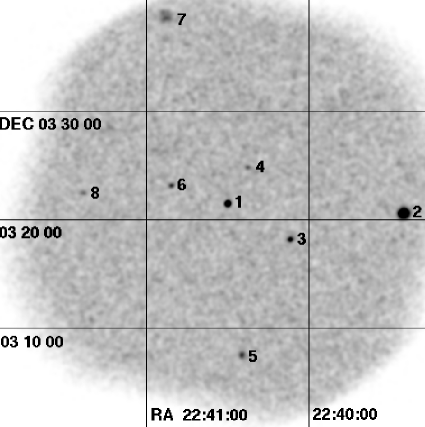
The complete HRI field of the exposure is shown in Figure 1. The central source is Q2237+0305 (labelled “1”). Table 1 contains the positions and count rates of all the sources in the field that are detected with a S/N of at least 4.0 in one of the ROSAT/HRI detection cells (squares with sizes ranging from 12 to 120 arcsec side length). In the table we also list the count rates and possible identifications of these X-ray detections. Cross-checking with the databases SIMBAD and NED, we could find one other identification of an X-ray detection in our field with a catalogued source (aside from the “target” Q2237+0305): Source No. 2 coincides with the G0 star BD +02 4540 (V magnitude: 9.6). The G5 star HD 214787 (V magnitude: 8.3) is about 50 arcsec off the position of detection No. 5, but this is a very unlikely match, even considering the poor accuracy for large off-axis angles.
| frame | pixel | world | coord | counts per | nearby | ||||
|---|---|---|---|---|---|---|---|---|---|
| No. | RA | Dec | x | y | x | y | S/N | 1000sec | counterpart |
| 1 | 22 40 30.05 | 3 21 28.94 | 304 | 299 | 34.5 | 14.5 | 14.4 | 6.2 | Q2237+0305 |
| 2 | 22 39 25.21 | 3 20 35.14 | 499 | 288 | 1984.5 | 124.5 | 12.5 | 25.5 | BD +02 4540, V=9.6, |
| G0-star (within fraction of arcsec) | |||||||||
| 3 | 22 40 6.87 | 3 18 10.74 | 373 | 259 | 724.5 | 414.5 | 10.1 | 2.9 | |
| 4 | 22 40 22.62 | 3 24 50.49 | 326 | 339 | 254.5 | -385.5 | 5.2 | 1.1 | |
| 5 | 22 40 24.74 | 3 07 32.64 | 319 | 131 | 184.5 | 1694.5 | 4.6 | 2.8 | HD 214787, V=8.3, |
| G5-star (50 arcsec off) | |||||||||
| 6 | 22 40 50.78 | 3 23 8.02 | 242 | 318 | -585.5 | -175.5 | 7.3 | 1.7 | |
| 7 | 22 40 53.3 | 3 38 34.29 | 236 | 505 | -645.5 | -2045.5 | 4.5 | 9.8 | |
| 8 | 22 41 23.25 | 3 22 25.15 | 144 | 310 | -1565.5 | -95.5 | 3.6 | 1.1 |
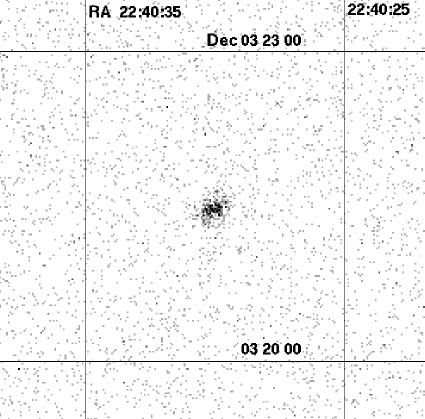
Figure 2 depicts a higher-resolution map of Q2237+0305. The image appears slightly elliptical; but the same small ellipticity is seen in other images as well and hence seems to be an artifact of imperfect pointing (the separation of the four quasar images is only of order one arcsecond; this cannot explain the apparent extension).
3 Results and Discussion
The average rate of counts/ksec translates into an energy flux of erg/sec/cm2 in the interval 0.1-2.4 keV, with the assumption of a hydrogen column density of cm-2 (Dickey & Lockman 1990) and a power law index (photon) of . This flux can be converted into an X-ray luminosity in the ROSAT energy window of erg/sec. The intrinsic X-ray luminosity of the quasar must be lower, since due to the gravitational lensing there is a magnification of at least a few, possibly even a few hundred (Kent & Falco (1988); Rix et al. (1992); Wambsganss & Paczyński (1994)).
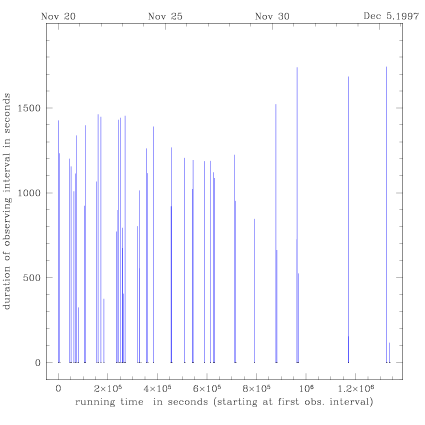
As briefly mentioned in the introduction, it is of great interest to study any variability of this quasar. The standard ROSAT/SASS analysis did not find any indication for variability in Q2237+0305. With only about 330 source photons spread over two weeks in real time, it is difficult to determine any variability. In Figure 3, we display the observing intervals of this X-ray exposure for possible comparison with observations in other wave bands at the same time. The “zero” on the time axis corresponds to November 20, 1997, 01:49:58 UT (or JD 2450772.576). It is clear from this Figure that the “coverage factor” is less than 5%. So it makes no sense to present a continuous light curve of Q2237+0305 over the observing period.
We can also “bin” the data to compare the Q2237+0305 “light curve” with the light curve of the “background” (or of the other seven detected sources, cf. Table 1). Such a binned artificial light curve is displayed in Figure 4 for bin widths of 1000 seconds111For the binning we basically put together all observing intervals back-to-back, thus ignoring all the “dead times”. The data in these 53 bins of 1000sec each are in fact spread out over about about two weeks (cf. Figure 3). The top panel is the X-ray light curve for Q2237+0305, the bottom panel is the “light curve” of a background field with the same average count rate (6.2 counts per ksec). In order to find out whether the “peaks” in the quasar light curve could be due to enhanced background radiation, we chose to compare the quasar light curve with a background light curve normalized to the same average count rate. Figure 4 shows that the fluctuations in the flux of Q2237+0305 are uncorrelated with the variations in the background flux.

There is no obvious variability visible at the top of Figure 4 that exceeds any variability in the bottom panel (which sets the “noise” level). Neither is there any “correlated” variability obvious, which could be expected for a highly increased background at certain phases of the observation (since the extraction circle of the Q2237+0305 light curve is much smaller than that for the background, this would be surprising).
We investigated the issue of variability more quantitatively. We performed a KS-test with the real arriving times of the source photons of Q2237+0305 (extraction radius 30 arcseconds), comparing them with the background light curve of a circular region corresponding to the same total number of photons and for the total background. Both were consistent with no variability. Furthermore, we performed a chi-square test with the binned data. Similarly, we found no indication for variability.
Among the 53 bins, the bin with the highest count contains 15 photons, and one bin is completely empty. The Poissonian probability for finding 15 counts for an average of 6.2 is only about , the Poissonian probability for finding 0 counts with the same average is .
Similarly, if one divides the bins in two sets, the first 26 bins contain 150 counts; the standard variation for an average of 150 counts is counts. The second 26 bins contain 194 counts, which is 2.4 above the counts of the first half. These two tests leave open the possibility of source variability, but at very low significance.
Another issue is a possible contamination of the X-ray counts by the (lensing) galaxy. We estimated the X-ray luminosity of this galaxy both by using Dell’Antonio et al. (1994)’s correlation (where is in erg s-1 and is in solar luminosities), as well as by extrapolating from the known X-ray count rate of M31 (West et al. 1997). Both these estimates result in a possible contribution of the lensing galaxy of less than one percent of our detection, which hence can be neglected.
4 Conclusions and Outlook
The detection of the quadruply-imaged quasar Q2237+0305 in X-rays with () counts per ksec opens up the possibility of being able to monitor this system with the next generation of X-ray telescopes (Chandra X-ray Observatory, XMM, ASTRO-E). It would then be feasible to study both the intrinsic variability of the quasar and microlens-induced fluctuations. The Chandra X-ray Observatory with its on-axis resolution of 0.5 arcsec and its effective area almost twice as large as ROSAT’s will be able to detect and resolve the four images of Q2237+0305. In addition to the possibility of determining microlens-induced fluctuations (see Yonehara et al. 1998), such observations could offer the opportunity of measuring relative time delays in this system. Intrinsic X-ray variations of the lensed quasar on time scales of less than a day would be required. On the other hand, if one could follow a “caustic crossing event” in X-rays (which should appear in only one of the four images, according to the very high magnifications expected due to the small source size), we could also have the possibility of determining the size or even the source profile of the X-ray emission region of the quasar.
Acknowledgements.
It is a pleasure to thank Ingo Lehmann for providing help with his MIDAS tools. This research has made use of the NASA/IPAC Extragalactic Database (NED) which is operated by the Jet Propulsion Laboratory, California Institute of Technology, under contract with the National Aeronautics and Space Administration. This research has also made use of the SIMBAD database, operated at CDS, Strasbourg, France.References
- (1) Bade, N., Siebert, J., Lopez, S., Voges, W., Reimers, D., 1997, A&A 317, L13,
- Blanton et al. (1998) Blanton, M., Turner, E.L., Wambsganss, J., 1998, MNRAS 298, 1223
- (3) Burud, I., Courbin, F., Lidman, C., Jaunsen, A. O., Hjorth, J., et al. 1998, ApJ 501, L5
- Chae et al. (1998) Chae, K.-H., Turnshek, D.A., Khersonsky, V.K., 1998, ApJ 495, 609
- (5) Chartas, G., Falco, E. Forman, W., Jones, C., Schild, R., Shapiro, I., 1995, ApJ 445, 140
- Corrigan et al. (1991) Corrigan R.T., Arnaud J., Fahlman G.G., Fletcher J.M., Hewett P.C., Hewitt J.N., Le Fevre O., McClure R., Pritchet C.J., Schneider D.P., Turner E.L, Webster R.L., Yee H.K.C, 1991, AJ, 102, 34
- (7) Dell’Antonio, I.P., Geller, M.J., & Fabricant, D.G., 1994, AJ, 107, 427
- (8) Dickey J.M., Lockman F.J., 1990, ARA&A 28, 215
- Huchra et al. (1985) Huchra J., Gorenstein M., Kent S., Shapiro I., Smith G., Horine E., Perley R., 1985, AJ, 90, 691
- Irwin et al. (1989) Irwin M.J., Webster R., Hewett P.C., Corrigan R.T., Jedrzejewski R.I., 1989, AJ, 98, 1989
- Kent & Falco (1988) Kent S.M., Falco E.E., 1988, AJ, 96, 1570
- Lewis et al. (1998) Lewis, G.F., Irwin, M.J., Hewett, P.C., Foltz, C.B., 1998, MNRAS 295, 573
- Mediavilla et al. (1998) Mediavilla, E., Arribas, S., del Burgo, C., Oscoz, A., Serra-Ricart, M. et al., 1998, ApJ 503, L27,
- Munoz et al. (1999) Munoz, J.A., Falco, E.E., Kochanek, C.S. et al., 1999, preprint astro-ph/9902131
- Rix et al. (1992) Rix H.-W., Schneider D.P., Bahcall J.N., 1992, AJ, 104, 959
- Schmidt et al. (1998) Schmidt, R., Webster, R.L., Lewis, G.F., 1998, MNRAS 295, 488
- Trümper (1983) Trümper J., 1983, Adv. Space Res. 2, 142
- Wambsganss et al. (1990) Wambsganss J., Paczyński B., Schneider P., 1990, ApJL, 358, L33
- Wambsganss & Paczyński (1992) Wambsganss J., Paczyński B., 1992, AJ, 102, 864
- Wambsganss & Paczyński (1994) Wambsganss J., Paczyński B., 1994, AJ, 108, 1156
- (21) West R.G., Barber, C.R., & Folgheraier, E.L., 1997, MNRAS, 287, 10
- Yonehara et al. (1998) Yonehara, A., Mineshige, S., Manmoto, T., Fukue, J., Umemura, M., Turner, E., 1998, ApJ 501, L41