Detection of HD in the Orion molecular outflow ††thanks: Based on observations with ISO, an ESA project with instruments funded by ESA Member States (especially the PI countries: France, Germany, The Netherlands and the United Kingdom) and with the participation of ISAS and NASA.
Abstract
We report a detection in the interstellar medium of an infrared transition within the electronic ground state of the deuterated hydrogen molecule, HD. Through a deep integration with the Short-Wavelength-Spectrometer (SWS) on board the Infrared Space Observatory (ISO), the pure rotational R(5) line at 19.43 m was detected toward the Orion (OMC-1) outflow at its brightest H2 emission region, Peak 1. The beam-averaged observed flux of the line is . Upper flux limits were derived for sixteen other rotational and ro-vibrational HD lines in the wavelength range 2.5 to 38 m.
We utilize the rich spectrum of H2 lines observed at the same position to correct for extinction, and to derive a total warm HD column density under the assumption that similar excitation conditions apply to H2 and HD. Because the observed HD level population is not thermalized at the densities prevailing in the emitting region, the total HD column density is sensitive to the assumed gas density, temperature, and dissociation fraction. Accounting for non-LTE HD level populations in a partially dissociated gas, our best estimate for the total warm HD column density is . The warm molecular hydrogen column density is , so that the relative abundance is .
The observed emission presumably arises in the warm layers of partially dissociative magnetic shocks, where HD can be depleted relative to H2 due to an asymmetry in the deuterium-hydrogen exchange reaction. This leads to an average HD depletion relative to H2 of about 40%. Correcting for this chemical depletion, we derive a deuterium abundance in the warm shocked gas, [D]/[H]= .
The derived deuterium abundance is not very sensitive to the dissociation fraction in the emitting region, since both the non-LTE and the chemical depletion corrections act in oppositite direction. Our implied deuterium abundance is low compared to previous determinations in the local interstellar medium, but it is consistent with two other recent observations toward Orion, suggesting that deuterium may be significantly depleted there.
Key Words.:
Shock waves – ISM: abundances – ISM: individual objects: Orion Peak 1 – ISM: molecules – Cosmology: observations – Infrared: ISM: lines and bands1 Introduction
Deuterium is an important clue to the physics of the Big Bang. Its creation rate during primordial nucleosynthesis depended strongly on the number ratio of photons to baryons, a quantity not at all well-known but crucial for a correct description of the earliest events (e.g., Wilson & Rood 1994; Smith et al. 1993). Ever since, conditions have not been right to add further deuterium to the primordial production; neither nuclear fusion processes nor the spallation of heavier nuclei by energetic cosmic rays can augment the original abundance (although stellar flares were suggested by Mullan & Linsky [1999] to produce deuterium). The deuterium abundance in fact decreases continuously as deuterium is burned up in stars. The present day deuterium abundance in the interstellar medium provides a lower limit to its primordial value, and it reflects the history of stellar reprocessing of the gas; measurements of its spatial variation may shed light on the star formation history in a given region (e.g., Tosi 1998, Tosi et al. 1998).
Deuterium and D-bearing species were detected in giant planets (Encrenaz et al. 1996; Feuchtgruber et al. 1997), in cosmic rays (Beatty et al. 1985; Casuso & Beckman 1997; Geiss & Gloeckner 1998), in the local ISM (Linsky et al. 1993, 1995; Linsky 1998; Piskunov et al. 1997; Helmich et al. 1996; Jacq et al. 1993; Turner 1990), and in extragalactic sources (Songaila et al. 1994; Tytler et al. 1996; Burles & Tytler 1998). Through recent D i Ly observations of the local ISM, McCullough (1992), Linsky et al. (1993, 1995), Piskunov et al. (1997), and Dring et al. (1997) derived a deuterium abundance [D]/[H] along the line of sight toward nearby bright stars. These observations are hampered however by the possible confusion with the H i Ly line, which is only 80 km s-1 apart. High spectral resolution UV absorption observations of DI Lyman and were recently performed by Jenkins et al. (1999) and Sonneborn et al. (in prep.) along three lines of sight, which yield significant [D]/[H] variations between and . Observations of the hyperfine transitions of D i and H i at radio frequencies (Chengalur et al. 1997), or of the H2 and HD molecules, provide further means to sample the deuterium abundance. The [HD]/[H2] ratio is subject to variations due to small differences in chemical reaction rates in high temperature molecular gas as in shocks (see Sect. 3.5) and photodissociation regions. To date, rotationally excited HD has been detected with ISO from giant planets (Feuchtgruber et al. 1997), and in the interstellar medium through UV-observations by Wright & Morton (1979). Accounting for the three lowest rotational levels of HD Wright & Morton found [HD]/[H2] in the cold molecular gas toward Oph. D-bearing species such as HDO, CH2DOH, DCO+ or DCN (Jacq et al. in prep.), are observed at radio-frequencies in the ISM, but due to fractionation the deuterium abundance cannot be deduced accurately from these observations.
The infrared emissivity of HD has been modeled and predicted for photodissociation regions (Sternberg 1990 - not including the reaction ) and magnetic (C-type) shocks (Timmermann 1996), where latter calculations include deuterated species in the chemical reaction network. But even state-of-the-art IR-spectrometers had been unsuccessful in detecting HD emission in the ISM, because of the low HD abundance, and because the pure rotational and rotation-vibrational lines appear at wavelengths that are affected by strong telluric interference.
ISO now for the first time opened the skies to a successful search for HD emission. Wright et al. (1999) detected the emission of HD 0-0 R(0) toward the Orion Bar photodissociation region, and derive [HD]/[H2]. A measure of the deuterium abundance in PDRs is complicated by the fact that the HD dissociation front is located deeper into the molecular cloud than that of H2. The average excitation of HD may therefore be lower than that of H2, making it difficult to derive column densities referring to the same regions. In regions of pure collisional excitation such as shocks, this problem should not occur.
We here report HD observations toward the brightest H2 emission region in the sky, Peak 1 in the Orion molecular outflow that surrounds several deeply embedded far-infrared sources (Genzel & Stutzki 1989; Menten & Reid 1995; Blake 1997; van Dishoeck et al. 1998; Stolovy et al. 1998; Schultz et al. 1998). Our observations, which we discuss in Sect. 2, were part of a line survey of shocked molecular gas, and of a program to investigate the oxygen-chemistry in the warm molecular interstellar medium with the Short-Wavelength-Spectrometer (SWS). In Sect. 3 we derive an HD column density from the flux of one detected HD line, making use also of extinction and excitation measurements from a large number of H2 lines which we detected in related observations. We then estimate the deuterium abundance in the shocked, warm gas of the Orion outflow. In Sect. 4 we summarize our results.
2 Observations
| transition | integrationb | peak | d | ||||||
|---|---|---|---|---|---|---|---|---|---|
| m | sec | Jy | km s-1 | s-1 | K | erg s-1cm-2sr-1 | mag | cm-2 | |
| 0–0 R(2) | 37.7015 | 192 | 300 | 1.72(–6) | 765.9 | 9.9(–4) | 0.09 | 1.5(17) | |
| 0–0 R(3) | 28.5020 | 100 | 350 | 4.11(–6) | 1270.7 | 7.9(–4) | 0.30 | 4.6(16) | |
| 0–0 R(4) | 23.0338 | 35 | 350 | 7.91(–6) | 1895.3 | 6.0(–4) | 0.51 | 1.8(16) | |
| 0–0 R(5) | 19.4305 | 3010 | 2.37 | 134 | 1.33(–5) | 2635.8 | (–5) | 0.60 | (14) |
| 0–0 R(6) | 16.8940 | 8.5 | 230 | 2.03(–5) | 3487.5 | 1.3(–4) | 0.53 | 1.1(15) | |
| 0–0 R(7) | 15.2510 | 1110 | 5.0 | 185 | 2.88(–5) | 4445.3 | 6.8(–5) | 0.41 | 3.3(14) |
| 0–0 R(8) | 13.5927 | 10 | 215 | 3.87(–5) | 5503.8 | 1.8(–4) | 0.37 | 5.6(14) | |
| 0–0 R(9) | 12.4718 | 8 | 230 | 4.97(–5) | 6657.5 | 1.7(–4) | 0.54 | 4.3(14) | |
| 1–0 P(4) | 3.0690 | 0.2 | 280 | 7.37(–6) | 5958.5 | 2.8(–5) | 1.11 | 2.0(14) | |
| 1–0 P(3) | 2.9800 | 0.1 | 270 | 1.09(–5) | 5593.5 | 1.4(–5) | 1.08 | 6.4(13) | |
| 1–0 P(2) | 2.8982 | 0.25 | 300 | 1.64(–5) | 5348.7 | 3.9(–5) | 0.94 | 1.0(14) | |
| 1–0 P(1) | 2.8225 | 0.4 | 305 | 3.23(–5) | 5225.7 | 6.6(–5) | 0.80 | 7.6(13) | |
| 1–0 R(0) | 2.6900 | 0.2 | 330 | 1.72(–5) | 5348.7 | 3.7(–5) | 0.70 | 7.0(13) | |
| 1–0 R(1) | 2.6326 | 0.3 | 330 | 2.51(–5) | 5593.5 | 5.7(–5) | 0.70 | 7.3(13) | |
| 1–0 R(2) | 2.5811 | 0.4 | 245 | 3.22(–5) | 5958.5 | 5.8(–5) | 0.72 | 5.7(13) | |
| 1–0 R(3) | 2.5350 | 1200 | 0.2 | 215 | 3.91(–5) | 6441.1 | 2.6(–5) | 0.74 | 2.1(13) |
| 1–0 R(4) | 2.4943 | 0.35 | 235 | 4.60(–5) | 7037.7 | 5.0(–5) | 0.76 | 3.5(13) |
a expected wavelengths. 0-0 R(5) is observed at m.
b on target integration time for SWS 02 observations; the SWS 01
2.4 – 40 m scan took 6538 sec.
c FWHM of observed HD line, or of neighboring H2 lines.
d upper level column, corrected for extinction.
e numbers in brackets denote powers of ten.
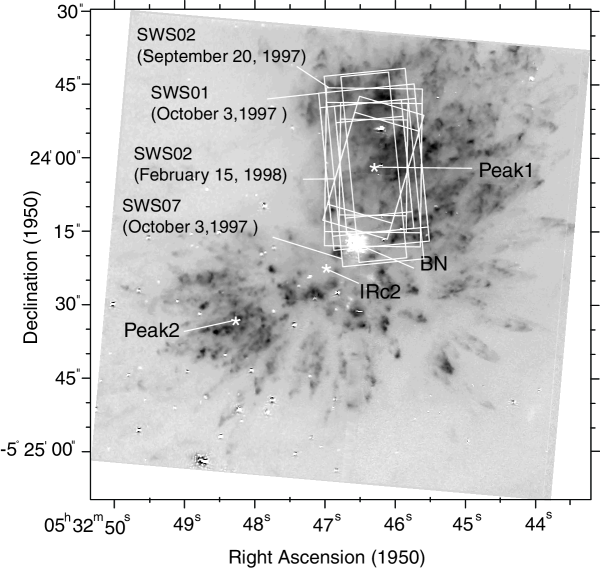
Orion Peak 1 was observed in the SWS 01 (full grating scan) and SWS 07 (Fabry-Pérot) modes of the short wavelength spectrometer (de Graauw et al. 1996) on board ISO (Kessler et al. 1996) on October 3, 1997, and in the SWS 02 ( range grating scan) mode on September 20, 1997 and February 15, 1998. Figure 1 illustrates the various aperture orientations with respect to the H2 1–0 S(1) emission observed with NICMOS on the HST (Schultz et al. 1998). The full 2.3 to 45 m SWS 01 spectrum was recorded in its slowest mode with the highest possible resolution. A preliminary reduction of this spectrum was presented by Bertoldi (1997). Table 1 summarizes the HD line observations. The H2 lines will be discussed in more detail in a forthcoming article (Rosenthal et al. in prep.).
The data reduction was carried out using standard Off Line Processing (OLP) routines up to the Standard Processed Data (SPD) stage within the SWS Interactive Analysis (IA) system. Between the SPD and Auto Analysis Result (AAR) stages, a combination of standard OLP and in-house routines were used to extract the individual spectra. The in-house routines included an interactive dark-current subtraction for individual scans and detectors as well as for the removal of fringes. The flux calibration errors range from 5% at 2.4 m to 30% at 45 m. (SWS-Instrument Data User Manual, version 3.1). The statistical uncertainties derived from the line signal to noise ratio are for most detected lines smaller than the systematic errors due to flux calibration uncertainties.
2.1 Line Fluxes

The spectra at the expected wavelengths of seventeen HD transition lines are shown in Figs. 2 and 3. The wavelengths (Table 1) of the pure rotational HD transitions were adopted from Ulivi et al. (1991), while those for the rotation-vibrational lines were computed from the rotational (Essenwanger & Gush 1984) and vibrational constants (Herzberg 1950). Only one of the seventeen lines sought was detected, the 0–0 R(5) (i.e. ) dipole transition at an expected wavelength of 19.4305 m111 The experimental value for the R(5) transition wavelength is m, whilst the calculated value is m (Ulivi et al. 1991 and references therein). The discrepancy is yet unexplained. (observed at 19.4290 m, see Fig. 3). Although the detection may seem marginal, the line does appear in two independent observations. It is apparent in the fringed data, and after defringing, it stands out well above the noise in the central wavelength range of the coadded SWS 02 scans. A beam-averaged flux of erg s-1cm-2sr-1 was derived from a continuum-subtracted integration over the feature; the error derives from the line’s S/N (the RMS noise being evaluated within ) plus an estimated 11% flux calibration uncertainty. The line width (FWHM) is 134 km s-1, which agrees with the instrumentally expected width for extended objects, 130 km s-1, and is not sufficient to resolve the emission, which should have a velocity dispersion similar to that observed in H2 1–0 S(1), which has a FWHM of km s-1, with emission from -100 to +100 km s-1 (Chrysostomou et al. 1997; Stolovy et al. 1998). The line center is positioned at km s-1, which is within the range of line center velocities, to +41 km s-1, observed in the H2 1–0 S(1) emission (Chrysostomou et al. 1997). The high spectral resolution and sensitivity of the ISO SWS around 19 m made R(5) the most promising line for a detection of HD in Peak 1. The stronger lines from lower rotational states suffer from the rapidly rising continuum level at longer wavelengths and the resulting strong fringing.

The available integration time was insufficient to detect two other HD lines which we tried to observe in the SWS 02 mode. We derived upper flux limits for a total of sixteen HD lines from the noise level near the expected line wavelengths (Table 1). The peak-to-peak noise envelope approximately corresponds to a 3 flux density dispersion, and we assumed that a line with a peak flux density of 3 would have stood out clearly enough to be detected. As upper flux limits we therefore adopted the 3 flux density noise level times the FWHM of neighboring H2 lines, except for 0–0 R(7), R(8), R(9), for which we adopted the linewidths expected from instrumental resolution.
3 Extinction correction and H2 excitation
The column density of molecules in a particular rotation-vibrational level is computed from the observed line flux, , of a transition to a lower state , times the wavelength, , divided by the radiative transition rate (Einstein) coefficient222 The Einstein coefficients for H2 and HD are taken from Turner et al. (1977), confirmed by Wolniewicz et al. (1998), and Abgrall et al. (1982), respectively. The transition energies for H2 were computed from the level energies that were kindly provided by Roueff (1992, private communication). for this transition, , times a correction for extinction along the line of sight:
| (1) |
where is the effective extinction at wavelength . All H2 and HD transitions are optically thin. Previous measurements of the Peak 1 molecular emission estimated K band (2.12 m) extinctions between 0.5 and 1 magnitude (Everette et al. 1995). To apply an extinction correction to the observed H2 and HD lines requires knowledge of the “extinction law” between 2.4 and 40 m, which especially above m is observationally not well constrained (Draine 1989). The near-IR extinction is usually approximated to follow a power law (see Fig. 4),
| (2) |
with an increase in opacity beyond 6 m due to stretch and bend mode resonances in silicate grains (Draine & Lee 1984), the shape and depth of which are yet poorly understood. A recent ISO study of the extinction toward the W51 H ii region, e.g., finds and (Bertoldi et al. in prep.). Draine & Lee (1984) suggested , and observations of circumstellar dust emissivities suggest values for this ratio between 0.35 (Pegourie & Papoular 1985) and 0.5 (Volk & Kwok 1988).
The effective extinction toward the emitting gas in Peak 1 may not necessarily follow an average interstellar extinction law, since the emitting and absorbing gas may be mixed. We therefore tried to estimate the effective extinction as a function of wavelength toward Peak 1 from the observed emission of Peak 1 itself. The differential extinction between two wavelengths can be derived from a comparison of H2 line fluxes of transitions arising either from the same upper level, or from neighboring thermalized levels with a well determined relative excitation. Since the warm HD and H2 are likely to be well mixed, we will use the extinction toward the H2 to deredden also the HD line intensities.
The extinction-corrected H2 column density distribution serves as a “thermometer” that probes the excitation conditions in the emitting gas. Since we detected only one HD line, we cannot determine the HD excitation directly –this would require at least two lines of transitions arising from different upper levels. Instead, we rely on the reasonable assumption that HD is subject to the same excitation conditions as H2. We can thereby derive both molecules’ total column densities in the warm, emitting gas, and from that, their abundance ratio.

3.1 2.4 – 6 m extinction
It is useful to plot the observed H2 or HD column densities, , divided by the state’s statistical weight,333 The statistical weights are for para-H2 (even ) and for ortho-H2 (odd ). HD has non-identical nuclei (and a small dipole moment Debye). Therefore, unlike H2, which exists in the form para-H2 and ortho-H2, such a difference does not exist for HD, and . , against the state’s energy, . Examining this “excitation diagram,” which we first plotted from the not yet extinction-corrected H2 line intensities, we found no indication up to K of fluorescent excitation, or for deviations from the statistical ortho- to para-H2 abundance ratio of 3 (details will be given by Rosenthal et al. in prep.). Instead, the populations appear both in thermodynamic and statistical equilibrium, which means, they depend only on the level energy and degeneracy, not on the vibrational quantum number. As a consequence, is a smooth function of the level energy.
In contrast, H2 that is fluorescently excited generally displays level populations that are not in vibrational and rotational LTE, and also show ortho-to-para column density ratios between neighboring states that are smaller than 3 (see e.g., Draine & Bertoldi 1996, Bertoldi 1997). Timmermann (1998) predicted that in low-velocity shocks the ortho-to-para ratio can also be significantly lower, which was confirmed in recent ISO-SWS observations by Neufeld et al. (1998), who found a value of in the outflow HH54. Peak 1 however shows no deviations from statistical equilibrium.
We were able to obtain the most reliable line fluxes for the H2 and lines between 2.4 and 6 m that have upper level energies K. Excluding lines in the water ice absorption feature between 2.8 and 3.3 m, we selected thirty-two high S/N lines in this wavelength and energy range to constrain the power law part of the extinction curve. Assuming that the H2 columns vary smoothly with , we fit a second order polynomial to the observed column densities, corrected for extinction following Eq. (1) with and as free parameters. We searched for values of and which minimize the dispersion of . Within the range , is well constrained to magnitudes. It was not possible to narrow down the value of further, so we adopted , which was suggested by previous observational studies (see Draine 1989; Brand et al. 1988 used and ). The second order fit to versus K for and is (see Fig. 5)
| (3) |
for K, and has a fit quality ; the uncorrected () dispersion is .
We should note that our extinction curve between 4 and 7 m is not constrained well enough to address the claim by Lutz et al. (1997) that the extinction curve flattens and lacks the presumed minimum at 7 m.

3.2 Mid-IR extinction
Having constrained the extinction curve below 6 m and the H2 excitation from 5800 – 17,000 K, we now estimate the strength of the 10 m silicate feature with the observed H2 , column densities. The intensity of the 0–0 S(3) line at 9.66 m gives a column density of the , level that is significantly below that expected from an interpolation between the (0–0 S(1) 17.0 m) and (0–0 S(6) 6.1 m) levels. The observed to level populations are all affected by silicate absorption. We estimate the shape of the 9.7 m and 18 m silicate features from the calculations of Draine & Lee (1984), and adjust the strengths of the features individually (Fig. 4). Assuming mag and tuning such that the level column density smoothly follows that of the levels (Fig. 5 shows the resulting dereddened columns) results in a possible range mag, if we allow for a variation in , and a 15% uncertainty of the column due to the difference between two measurements of the 0–0 S(3) line in different AOTs. When we narrow the 10 m feature below reasonable width estimates, the extinction correction for the and levels decreases significantly, thereby lowering the dereddened flux in the 0–0 S(3) line and decreasing the required extinction to mag.
Considering all uncertainties we estimate mag, and with , we find mag. Our value for is in good agreement with the found toward W51.
The extinction correction for the detected HD line we then estimate as . The dereddened column densities of the H2 , levels are fit by
| (4) |
At upper level energies , 2636 K (HD ) and 5800 K this corresponds to excitation temperatures , 740 and 1190 K, respectively.
3.3 Water ice feature
The rotation-vibrational HD transitions 1–0 P(2), P(3), and P(4) fall into the water ice absorption feature at m. To correct these line flux limits for extinction we estimated the depth and width of the feature from the apparently enhanced (over the power law, Eq. [3]) extinction of five H2 lines with K and 2.8 m 3.3 m. The Gaussian
| (5) |
approximately fits the additional extinction noticeable for the five H2 lines, and was used to correct the rovibrational HD line fluxes.

3.4 Total column of and HD
How can we derive the total HD column density with only one measured high-excitation level? We can make use of the observed H2 excitation, and estimate that the excitation conditions – i.e., the fractions of the total gas column density that are at a particular temperature and density – are the same for HD and for H2. We assume that at least up to the excitation energy of HD ( K), the H2 level populations are thermalized, and thereby reflect the kinetic temperature distribution of the gas. The assumption of thermalized level populations is supported by the lack of deviations from vibrational degeneracy or non-statistical ortho-to-para ratios, and by detailed non-LTE calculations of the H2 level populations, which show that deviations from LTE are small at ( K) for densities higher than and temperatures above 600 K (Draine & Bertoldi, unpublished).
Because they are permitted dipole transitions, the radiative decay rates of HD are much higher than those of H2 levels at comparable energy. This results in “critical” densities (i.e. densities above which a level is thermalized for a given temperature) which are higher for HD than for H2. If the gas density was high enough to thermalize the HD levels, then HD would show the same level excitation as H2: normalizing the H2 populations (4) with the measured HD level, we would then expect the HD populations to follow
| (6) |
for K. The measured upper limits to sixteen HD level column densities are consistent with this distribution (Fig. 6).
However, deviations from LTE are important at the expected density of and temperatures of K in the shocked gas of the OMC-1 outflow. Let be the actual non-LTE population in level , divided by its LTE value. The total warm HD column density is given by the sum over all level column densities
| (7) |
where is given by Eq. (6).

To compute the deviations from LTE of the HD level population we solved the equations of statistical equilibrium (see Timmermann 1996), including radiative decay and excitation/deexcitation through collisions with He, H2, and H. The abundance of H varies throughout the shock, and we adopted [H]/[H2], which is typical for the dissociation fraction in the hot layers of a partially dissociative shock. In Fig. 7 we compare the resulting level population to that in LTE for gas volume densities of and , and three different kinetic temperatures that should span the range typical of the observed, shocked gas.
HD collisional (de)excitation rate coefficients with H2 were computed properly only for pure rotational transitions up to and temperatures up to 600 K and 300 K, respectively (Schäfer 1990). The rate coefficients for higher level transitions and temperatures were extrapolated from the lower ones. The H–HD and H2–HD collision rate coefficients were recently computed by Roueff & Flower (1999) and Roueff & Zeippen (1999), respectively.
We find that for H2 densities below the HD level populations deviate significantly from LTE. At a density of and a temperature of 600 K, the population of the level is about a factor two below its LTE value.

To assess the non-LTE effects on the derived total HD column density, we evaluated from Eq. (7) and plot this in Fig. 8 as a function of the gas density for three different temperatures. Only at H2 densities above do the populations assume LTE, and the warm HD column is
| (8) |
The error derives from the uncertainty of the column measured by the 0–0 R(5) line, and is a combination of spectral noise (22%), flux calibration uncertainty (11%), and the uncertainty of the extinction correction (14%). At lower densities, the total column density much depends on the gas temperature, and since H is the strongest collision partner of HD, on the dissociation fraction.
The emission of the OMC-1 outflow had been modeled previously with C-shocks that propagate at velocities of order into gas with densities of (Draine & Roberge 1982; Chernoff et al. 1982; Kaufman & Neufeld 1996). The gas in such shocks reaches temperatures of order 1000 K, and remains at approximately constant density through the region where most of the H2 emission occurs. The lowest H2 levels we observed show excitation temperatures of 600–700 K, which probably reflects the kinetic temperature of much of the warm, emitting gas. Taking these temperatures and densities as estimates for the prevailing excitation conditions, we estimate that the total observed HD column density must be in the range
| (9) |
If we had neglected H–HD collisions, the HD level would be less thermalized, and our estimate for the total HD column would rise to . However, we believe that much of the emission arises from partially dissociative shocks, so that collisions with neutral hydrogen should be important.
We now compare the HD column to that of warm H2. Summing over the H2 level populations given by the least squares fits, Eqs. (3) and (4), we find
| (10) |
where the error reflects a maximum flux calibration uncertainty of 11% in the 7 to 19.5 m range. By summing from , we extrapolated the observed H2 level populations, , to the unobserved levels . We thereby account only for the warm H2, not for the total H2 column along the line of sight, which includes over of cold gas in the molecular cloud that embeds the outflow. In this cold gas, which we are not concerned with, most H2 is in its ground states and , and does not affect our analysis of the warm outflow gas seen in the higher levels.
Dividing the HD and H2 column densities, we derive a first estimate of the abundance ratio
| (11) |
3.5 Chemical depletion of HD in shocks

The OMC-1 outflow emission arises from warm molecular gas that is shock-heated by high-velocity ejecta which originates from one of the deeply embedded protostars in the vicinity of Orion IRc2. The emission is a mixture from fast, dissociative J-type shocks, in which the molecular emission comes from where molecules reform, and from slower (), partially- or non-dissociative C-shocks, in which the molecules radiate in a magnetic precursor where the temperature rises to its peak value (Fig. 9). In J-shocks that propagate into a medium with density of order , the fraction of the bulk motion energy radiated away in H2 lines is very small, of order 0.1% (Neufeld & Dalgarno 1989). In C-type shocks, however, about half the kinetic energy is converted to H2 emission. For J-type shocks to dominate the H2 and HD emission, about 1000 times more energy would have to be dissipated in fast J-shocks than in the slower C-shocks. For an even distribution of magnetic field strengths and shock velocities up to km s-1, C-shocks therefore vastly dominate the molecular emission. The outflow emission may therefore be well modeled as arising from such magnetic, partially-dissociative shocks.
Most of the deuterium is locked in HD in the dense pre-shock molecular gas. In a high-velocity C-shock, both HD and H2 are either dissociated through collisions with ions that stream through the neutral gas at a speed of order the shock velocity, or through collisions with warm H2 and H at temperatures in excess of 2500 K. In a partly dissociative C-shock, HD is depleted more than H2 because atomic hydrogen can efficiently destroy HD through the reaction
| (12) |
where K is the enthalpy difference. Figure 9 illustrates the density profiles for H2 and HD across such a C-shock. In the warmest layers, HD is depleted by up to a factor 2.4 relative to H2. In the cooling region, the atomic deuterium reacts stronger again with H2 to form HD, and the equilibrium of Eq. (12) is shifted back towards HD. Averaged over the region where the temperature exceeds 400 K, from where most of the observable emission arises, HD is depleted relative to H2 by a factor 1.67 in the particular case we display in Fig. 9.
In C-shocks propagating at velocities below 25 km s-1, H2 is not dissociated significantly, and because of the low abundance of atomic hydrogen, the chemical depletion of HD is negligible.
3.6 Deuterium abundance
To derive the deuterium abundance in the warm, shocked gas we adopt the non-LTE level distribution of HD we computed above, and further account for the possibility of chemical depletion. With the column density ratio derived for temperatures of 600–900 K and densities of , we found
| (13) |
and accounting for chemical depletion of HD by 1.67, the abundance is raised to
| (14) |
where no error was added for uncertainties in the chemical depletion factor.
The main uncertainty of our value appears to arise from the indirect measure of the HD excitation, and of the abundance of atomic hydrogen in the warm shocked region. Less dissociative shocks would require larger corrections for non-LTE level populations, which would raise the implied HD abundance: neglecting all H–HD collisions, we earlier derived , which yields [D]/[H]. Now chemical depletion should not occur in shocks with a low abundance of neutral hydrogen, so that this values reflects the actual deuterium abundance. Interestingly, we find that the effects of non-LTE and of chemical depletion nearly cancel, so that the derived deuterium abundance turns out to be not very sensitive on how dissociative the shock is.
4 Summary
ISO for the first time enabled the detection in the interstellar medium of an infrared transition in the electronic ground state of deuterated hydrogen, HD. We here report the discovery of the =0–0 R(5) line at 19.4290 m with the ISO Short Wavelength Spectrometer in the warm, shocked molecular gas of the Orion OMC-1 outflow, at the bright emission “Peak 1.” Upper flux limits for sixteen other HD lines were measured, all of which appear consistent with expectations when considering the observed 0–0 R(5) line flux.
A large number of H2 lines were detected (Rosenthal et al. in prep.) and utilized to analyze the HD observations. The near- and mid-infrared extinction toward the emitting region was derived by minimizing the dispersion in the observed H2 level column densities with respect to an LTE excitation model. Thereby we derive a near-infrared (K band) extinction of magnitudes, a 9.7 m extinction of mag, and from an estimated range of we correct the HD 0-0 R(5) flux for extinction by mag, i.e. a factor .
The dereddened H2 level populations served to estimate the excitation conditions in the gas. While H2 was assumed to have thermalized level populations, those for HD were computed in detail by making use of the H2 excitation. Due to non-LTE effects at , the total warm HD column density was found to be sensitive to the gas density and temperature at the densities estimated to prevail in the shocked gas, .
Our estimate for the observed warm HD column density is , and for the warm molecular hydrogen, . Their relative abundance is therefore .
We note that in high-velocity C-shocks, HD may be depleted relative to H2 because of an asymmetry (due to a small binding energy difference) in the deuterium-hydrogen exchange reaction . Estimating that this lowers the warm HD column by about 40%, we derive a deuterium abundance in the warm shocked gas, [D]/[H].
If the emitting shocks were on average less dissociative than assumed, the chemical depletion would be less pronounced. But at the same time, the lower H-HD collision rate would enhance the HD level population’s deviation from LTE, to the effect that our implied total column of HD would increase. We estimate that the two effects approximately cancel, and that [D]/[H] remains at , independent of how dissociative the shock actually is.
The major uncertainties in our estimate for the deuterium abundance arise from our indirect measure of the HD excitation, and since we must therefore rely on non-LTE excitation models, on the uncertainty of the preshock density and the abundance of neutral hydrogen in the shock. Future ground-based near-IR observations of ro-vibrational transition lines of HD could constrain the effects of non-LTE and thereby narrow the error margins of the deuterium abundance. Detailed shock models of the recently resolved, multiple bow-shaped emission in the Orion outflow (Schultz et al. 1998) might also yield better estimates for the pre-shock densities and shock velocities, and thereby of the H2 dissociation and of the chemical depletion fraction of HD in such shocks.
The deuterium abundance we find, , is lower than that derived through most DI absorption measurements in the local ISM, but it is consistent with that found recently by Jenkins et al. (1999) toward Orionis, , and by Wright et al. (1999) toward the Orion Bar, . This could indicate that toward Orion, the deuterium abundance is indeed somewhat lower than on average.
We are thankful to J. Lacy, B. Draine, and M. Walmsley for valuable comments, to A. Schultz for providing the NICMOS image, and to the SWS Data Center at MPE, especially to H. Feuchtgruber and E. Wieprecht, for their support. SWS and ISODC at MPE are supported by DARA under grants 50QI86108 and 50QI94023. FB acknowledges support by the Deutsche Forschungsgemeinschaft (DFG) through its “Physics of Star Formation” program. CMW acknowledges support by NFRA/NWO grant 781-76-015 and of an ARC Research Fellowship.
References
- (1) Abgrall H., Roueff E., Viala Y. 1982, A&AS 50, 505
- (2) Beatty J.J., Garcia-Munoz J.E., Simpson J.A. 1985, ApJ 294, 455
- (3) Bertoldi F. 1997. In: Heras A.M. et al. (eds.) Proc. First ISO Workshop on Analytical Spectroscopy. ESA SP-419, p. 67
- (4) Blake G.A. 1997. In: IAU Symposium 178, van Dishoeck E.F. (ed.) Molecules in Astrophysics: Probes and Processes. Kluwer, Dordrecht, p. 31
- (5) Brand P.W.J.L., Moorhouse A., Burton M.G. et al. 1988, ApJ 334, L103
- (6) Burles S., Tytler D. 1998, ApJ 499, 699
- (7) Casuso E., Beckman J.E. 1997, ApJ 475, 155
- (8) Chengaluer J.N., Braun R., Burton W.B. 1997, A&A 318, L35
- (9) Chernoff D.F., Hollenbach D.J., McKee C.F. 1982, ApJ 259, L97
- (10) Chrysostomou A., Burton M.G., Axon D.J. et al. 1997, MNRAS 289, 605
- (11) de Graauw Th., Haser L., Beintema D.A. et al. 1996, A&A 315, L49
- (12) Draine B.T. 1989. In: 22nd ESLAB Symposium, Kaldeich B.H. (ed.) Infrared Spectroscopy in Astronomy. ESA SP-290
- (13) Draine B.T., Lee H.M. 1984, ApJ 285, 89
- (14) Draine B.T., Roberge W.G. 1982, ApJ 259, L91
- (15) Draine B.T., Bertoldi F. 1996, ApJ 468, 269
- (16) Dring A.R., Linsky J., Murthy J. et al. 1997, ApJ 488, 760
- (17) Encrenaz Th., de Graauw Th., Schaeidt S. et al. 1996, A&A 315, L397
- (18) Essenwanger P., Gush H.P. 1984, Can. J. Phys. 62, 1680
- (19) Everette M.E., DePoy D.L., Pogge R.W. 1995, AJ 110, 1295
- (20) Feuchtgruber H., Lellouch E., de Graauw Th. 1997, BAAS DPS meeting, 29, no. 15.16
- (21) Geiss J., Gloeckner G. 1998, Space Sci. Rev. 84, 239
- (22) Genzel R., Stutzki J. 1989, ARA&A 27, 41
- (23) Helmich F.P., van Dishoeck E.F., Jansen D.J. 1996, A&A 313, 657
- (24) Herzberg G. 1950, Molecular Spectra and Molecular Structure. Vol.1: Spectra of diatomic molecules, Van Nostrand Reinhold, New York
- (25) Jacq T., Walmsley,C.M., Mauersberger R. 1993, A&A 271, 276
- (26) Jenkins, E.B., Tripp T.M., Wozniack P.R., Sofia, U.J, Sonneborn, G. 1999, ApJ submitted
- (27) Kaufman, M.J., Neufeld D.A. 1996, ApJ 456, 611
- (28) Kessler, M.F., Steinz J.A., Anderegg M.E. et al. 1996, A&A 1996, 315, L27
- (29) Linsky J.L. 1998, Space Sci. Rev. 84, 285
- (30) Linsky J.L. Brown A., Gayley K. et al. 1993, ApJ 402, 694
- (31) Linsky J.L., Diplas A., Wood B.E. et al. 1995, ApJ, 451, 335
- (32) Lutz D., Feuchtgruber H., Genzel R., et al. 1997, A&A 315, L269
- (33) McCollough R.P. 1992, ApJ 390, 213
- (34) Menten K.M., Reid M.J. 1995, ApJ 445, L157
- (35) Mullan D.J., Linsky J.L. 1999, ApJ 511, 502
- (36) Neufeld D.A., Dalgarno, A. 1989, ApJ 344, 251
- (37) Neufeld D.A., Melnick G.J., Harwit, M. 1998, ApJL (in press)
- (38) Pegourie B., Papoular R. 1985, A&A 142, 451
- (39) Piskunov N., Wood B.E., Linsky J.L. 1997, ApJ 474, 315
- (40) Roueff E., Flower D.R. 1999, MNRAS, in press
- (41) Roueff E., Zeippen C.J. 1999, A&A, in press
- (42) Schäfer J. 1990, A&AS 85, 1101
- (43) Schultz A.S.B, Colgan S.W.J., Erickson E.F., et al. 1998, ApJ in press
- (44) Smith M.S., Kawano L.H., Malaney R.A. 1993, ApJS 85, 219
- (45) Songaila A., Cowie L.L., Hogan C.J. et al. 1994, Nat. 368, 599
- (46) Sternberg A. 1990, ApJ 361, 121
- (47) Stolovy S.R., Burton M.G., Erickson E.F. et al. 1998, ApJ 492, L151
- (48) Timmermann R. 1996, ApJ 456, 631
- (49) Timmermann R. 1998, ApJ 498, 246
- (50) Tosi M. 1998, Space Sci. Rev. 84, 207
- (51) Tosi M., Steigman G., Matteucci F., Chiappini C. 1998, ApJ 498, 226
- (52) Turner B.E. 1990, ApJ 362, L29
- (53) Turner J., Kirby-Docken K., Dalgarno A. 1977, ApJS 35, 281
- (54) Tytler D., Fan X.M., Burles S. 1996, Nat. 381, 207
- (55) Ulivi L., De Natale P., Inguscio M. 1991, ApJ 378, L29
- (56) van Dishoeck E.F., Wright C.M., Cernicharo J. et al. 1998, ApJ 502, L173
- (57) Volk K., Kwok S. 1988, ApJ 331, 435
- (58) Wilson T.L., Rood R.T. 1994, ARA&A 32, 191
- (59) Wolniewicz L. Simbotin I., Dalgarno A. 1998, ApJS, 115, 293
- (60) Wright C.M., van Dishoeck E.F., Cox P., Sidher S., Kessler M.F. 1999, ApJ submitted
- (61) Wright E.L., Morton D.C. 1979, ApJ 227, 483