The gaseous extent of galaxies and the origin of Ly absorption systems. IV: Ly absorbers arising in a galaxy group.11affiliation: Based on observations with the NASA/ESA Hubble Space Telescope, obtained at the Space Telescope Science Institute, which is operated by the Association of Universities for Research in Astronomy, Inc., under NASA contract NAS5–26555.
Abstract
We present new GHRS observations of Ly absorption lines associated with a group of galaxies towards the QSO 15452101. We have identified eight distinct Ly absorption features in the spectrum of QSO 15452101 at a mean redshift of with a velocity dispersion of . A group of galaxies is detected in the vicinity of this QSO at a mean redshift of and velocity dispersion .
The identification of discrete absorption systems indicates that they arise in clouds of neutral hydrogen rather than in a diffuse intragroup medium. Our analysis suggests that the Ly absorption lines are associated with individual galaxies in the group, although a one-to-one relationship between absorbers and galaxies is difficult to establish in such a dense environment.
keywords:
galaxies: clusters: general – galaxies: evolution – quasars: absorption lines1 Introduction
Ly absorption due to groups or clusters of galaxies has only been detected relatively recently (Lanzetta et al. 1996, Ortiz-Gil et al. 1997, Tripp et al. 1998, Shull et al. 1998). This is because it had been difficult to identify suitable combinations of background QSOs and foreground clusters close enough to the QSO line of sight to produce Ly absorption in the QSO spectrum. The search for suitable groups was poorly motivated since Ly absorption would not be expected due to the high temperature of the intracluster medium. Furthermore the majority of Lyman-alpha absorption line data in the literature are at redshifts z (when the line is shifted into the optical band), where most clusters are still on the process of formation.
Recent observations appear to produce contradictory results: Morris et al. (1993) and Bowen, Blades, & Pettini (1996) failed to identify absorption due to clusters of galaxies, in contrast to the results of Lanzetta, Webb & Barcons (1996), Ortiz-Gil et al. (1997), Tripp et al. (1998), and Shull et al. (1998).
However, other recent work suggests that galaxies may partially retain their gaseous envelopes in a cluster environment (see Cayatte et al. 1990 for an example in the Virgo cluster). Zabludoff & Mulchaey (1998) find that galaxies in poor groups ( members) lie in a common halo which contains most of the mass of the group. Blitz et al. (1998) suggest that the High Velocity Clouds (HVCs) detected in the Local Group might be the counterparts of Lyman Limit systems, as they find similar column densities and internal velocity dispersions and subsolar metallicites. They also suggest that lower column density HVCs may correspond to Ly clouds. In their models the HVCs trace the distribution of dark matter in and around the group, following its filamentary/sheet-like structure.
Lanzetta et al. (1996) report the identification of a group of galaxies toward QSO 15452101 responsible for a broad absorption feature present in an HST Faint Object Spectrograph (FOS) spectrum of this object. The spectral resolution of these data was insufficient to show whether it was the group as a whole or individual galaxies within it which were responsible for the observed Ly absorption. Individual galaxies would give rise to discrete absorption components associated with particular galaxies. Also, galaxies at a smaller impact parameter should produce higher column densities.
In this paper we present new higher resolution observations of the QSO 15452101 using the Goddard High Resolution Spectrograph on HST.
Throughout this paper we have adopted a deceleration parameter and a dimensionless Hubble constant .
2 HST/GHRS observations of the QSO 15452101
A high resolution spectrum of the QSO 15452101 was obtained using the GHRS spectrograph with the G160M grating on August 23 1996 (Fig. 1). The observations were obtained during a series of 14 exposures each of 300s duration for a total exposure time of 4200s. The individual exposures were reduced using standard pipeline techniques and were registered to a common origin and combined using our own reduction programs. The final spectrum was fitted with a smooth continuum using an iterative spline fitting technique. The spectral resolution of the final spectrum was measured to be FWHM= Å (or FWHM=), and the continuum signal-to-noise ratio was measured to be per resolution element. Previous imaging and spectroscopic observations of the field surrounding QSO 15452101 are described in Lanzetta et al. (1996).
3 Detection and analysis of the absorption systems in the field of QSO 15452101
We detected all absorption lines above a significance level of in the spectrum of QSO 15452101. The parameters characterizing each absorption line were estimated using multi-component Voigt profile fitting (three different and independently developed software packages were used, the three of them providing the same results). The values obtained are shown in Table 1. The confidence level detection limit was found to be Å .
Two absorption lines are found at and , with a velocity separation of . A group of at least eight lines is also detected, the redshift centroid of this group being with a velocity dispersion of .
Galactic heavy element lines in the spectrum (C iv 1548,1550 and Si ii 1526) were identified and removed them from subsequent analyses (Fig.1).
4 Group of galaxies in the field of QSO 1545+2101
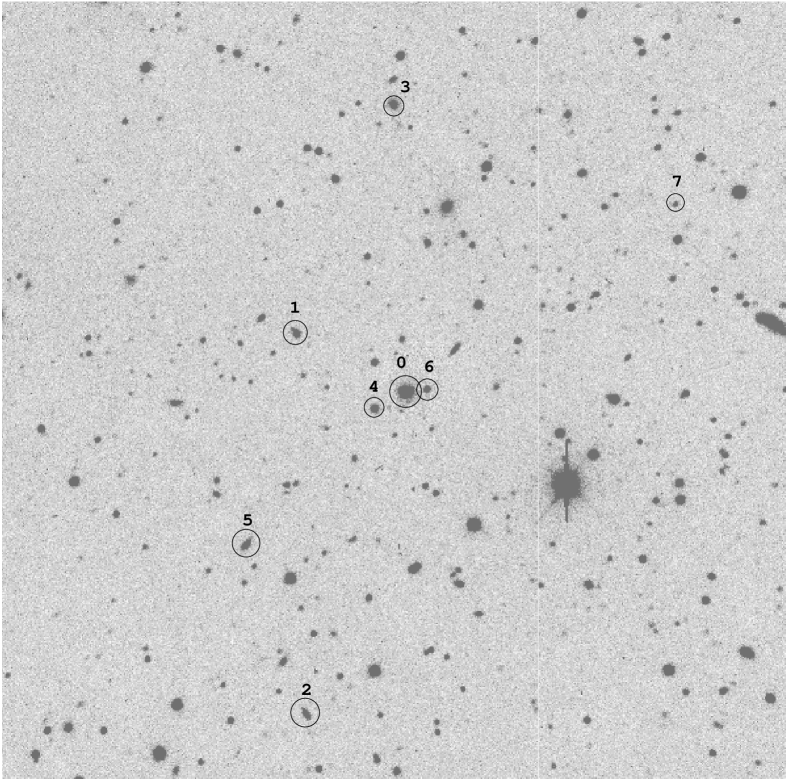
The spectroscopic galaxy sample was selected on the basis of galaxy brightness and proximity to the QSO line-of-sight. Although this sample cannot be considered complete the galaxies were selected randomly from an essentially flux-limited sample. The sample of galaxies used in this study is given in Table 2. Figure 2 is an image of the field. The galaxies in the group which were observed spectroscopically are indicated in that figure. The error in the galaxies redshift is estimated to be (Lanzetta et al. 1995).
We detected a group of seven galaxies with redshift centroid at and velocity dispersion of . Their individual impact parameters range from up to kpc.
We searched in the archives for X-ray data on this field as detecting X-ray emission from the group might help to characterize it better. Unfortunately the group is so close to the QSO (which is an X-ray source itself) that only the ROSAT High Resolution Imager data would be of any use, and there are no such data in the archive. QSO 15452101 was observed both with the Einstein Imaging Proportional Counter and with the ROSAT Position Sensitive Proportional Counter, but the extended Point-Spread-Function of both instruments resulted in QSO emission severely contaminating the region where the galaxy group might emit X-rays.
In any case, from our image of this field and the fact that the velocity dispersion that we have measured for this group is quite small, it is clear that it is a loose association of galaxies rather than a galaxy cluster. The maximum value of impact parameter in our sample ( kpc) is also the typical physical size for poor groups of galaxies (Zabludoff & Mulchaey 1998). In fact, this group is most probably the one hosting the QSO itself, as for this object (Marziani et al. 1996). One might therefore expect this group to have only between 10-20 members (Bahcall et al. 1997).
5 The relationship between the absorption systems and the galaxies
The cluster of absorption lines present in the spectrum of QSO 1545+2101 might arise in different environments. They might be intrinsic absorbers, arising either in the QSO region itself or in its near environment. The similar redshifts of the QSO and the group of absorbers in these data may point to one of these hypotheses as the right one. In addition, QSO 1545+2101 is a radio-loud object and there have been suggestions that intrinsic absorption or absorption arising in the QSO host galaxy would be stronger in radio-loud QSOs than in radio-quiet ones (Foltz et al. 1988; Mathur, Wilkes & Aldcroft 1997).
But there are also some arguments against an intrinsic origin for these lines, as discussed by Lanzetta et al. (1996). Associated absorbers of the kind described above produce rather strong absorption lines, while the lines detected in QSO 1545+2101 are relatively weak. Moreover, no corresponding metal absorption lines have been detected. With the new data from GHRS we have more evidence against the associated nature of the absorption systems: the agreement between the galaxies’ and absorbers’ redshift centroids and between their corresponding velocity dispersions suggests that both galaxies and absorbers groups share—at least—the same physical location. These characteristics lead us to reject the associated hypothesis and to consider another possible scenario: absorption arising in cosmologically intervening objects, within the same group of galaxies that hosts the QSO.
To further explore this third hypothesis a demonstration of the non-random coincidence between the galaxies and absorbers positions in velocity space is necessary. Identifying each galaxy with a single absorption line would also be very interesting. In what follows we use statistical methods to address both questions.
5.1 A cluster of absorbers arising in a group of galaxies
The group of galaxies detected toward the QSO 15452101 has a mean redshift of , compatible with the mean redshift centroid value of the group of absorption lines, (to the red of the Galactic Si ii line in Fig. 1). The absorber and galaxy velocity dispersions are similar: for the group of galaxies and for the group of absorption lines (the error in the galaxy redshifts is ). This strongly suggests a connection between the absorbers and galaxies.
There is also a galaxy in this field whose redshift is . Two Ly absorption lines are detected near this redshift at and (to the blue of the Galactic Si ii line in Fig. 1). The galaxy-absorber velocity differences are and respectively. This implies that this galaxy, whose impact parameter is kpc, could be responsible for one of the absorption lines as both values are compatible with the velocity dispersions that one finds typically in a galactic halo (). The velocity difference between the two absorption systems (), is perhaps too large for the same galaxy to be responsible for both of them. It may also be that we have not observed the actual galaxy giving rise to either of these absorption lines, since our galaxy sample is not complete.
5.1.1 Statistical analysis
Two statistical tests were carried out to investigate the relationship between the group of galaxies and absorbers. In the first, we computed the two-point cross-correlation function () between the absorbers and the galaxies. This function was normalized by computing the expected if there were no relation between absorbers and galaxies (derived using galaxy redshifts which are randomly distributed over a redshift range around the real group of absorption lines). Errors were computed using a bootstrap method, simulating 1000 samples of 7 galaxy redshifts, each set randomly selected from the real set, deriving error estimates from the distribution of 1000 values of . The final result is shown in Fig. 3 (panel ).
In the second statistical test, we applied a similar statistical method, not to the actual set of absorbers but to the individual pixel intensities in the spectrum. This way we overcome any potential problems introduced as a consequence of incorrect determination of the true velocity structure in the profile fitting process, or the presence of weak lines falling below the detection threshold. Recent analyses by Liske, Webb & Carswell (1999) show that the study of pixel intensities is more sensitive to clustering than the usual line–fitting techniques. The test is as follows: we evaluated for each pixel the value of the function , where is the intensity of pixel normalized to the continuum. Clearly, has larger values in pixels belonging to absorption lines. For pixels corresponding to metal lines (including galactic lines) we assigned a value of . Then, for each galaxy we compute the function , where refers to all the pixels located at a distance in velocity space from galaxy , being the total number of galaxies in the sample. The velocity distances considered range from up to the one spanned by the whole spectrum. This function is analogous in some sense to the two-point cross-correlation function computed before: high values of at low velocity distances reflect the tendency of the pixels corresponding to absorption lines to lie close to the galaxies. The same function corresponding, again, to a randomly selected sample of galaxies chosen from a uniformly distributed group was computed in a way analogous to the previous one and the result, after normalizing to this random case, is shown in Fig. 3 (panel ). The error bars in were computed using a bootstrap method as before. The result obtained is similar to the one obtained by computing the two-point cross-correlation function: most of the pixels belonging to absorption lines (i.e., with larger values of ) lie less than away from the galaxies.
5.2 Are absorption lines related to galaxies on a case-by-case basis?
As there is a clear complex of discrete Ly lines in the spectrum of QSO 1545+2101, we explored the possibility of a one-to-one match between galaxies and absorbers.
A Gaussian model was assumed for the distribution of galaxies in the group. The null hypothesis is that the galaxies are randomly drawn from a Gaussian whose parameters are derived from the real data. The two-point correlation functions and the function were computed in the same way as in §5.1 (see Fig. 3, panels and ). No evidence of a one-to-one correspondence between galaxies and absorbers is found.
We can estimate the maximum statistical velocity dispersion between individual absorbers and their galaxies of origin that would permit the detection of a one–to–one correspondence, assuming an intrinsic one–to–one correspondence exists. A Kolmogorov-Smirnov Monte Carlo test showed that if the average velocity dispersion between the galaxies and the corresponding absorbers were then the null hypothesis would be rejected () in % of the cases. As a typical galactic velocity dispersion is , this condition is not likely to be satisfied in practice. Another possibility is to improve the statistics. From Monte Carlo simulations we estimate that about 100 groups similar to the ones studied here are needed for a detection of this one–to–one association, for a velocity dispersion between the absorber and the galaxy of about .
6 Discussion and conclusions
We have detected a clump of absorption lines along the line-of-sight towards the QSO 15452101. A group of galaxies has also been detected, with impact parameters of the individual galaxies to the QSO line–of–sight of less than kpc. The group is probably the one hosting the QSO, so we can expect it to have about 10-20 members (Bahchall et al. 1997).
Several scenarios might give rise to the absorption. Due to the close redshift values of the QSO and the group of absorbers one could easily think that they arise either in the QSO itself or in the corresponding host galaxy. We consider that there are compelling arguments supporting the intervening system hypothesis (see Lanzetta et al. 1996) and contradicting the associated hypothesis. We now summarise those arguments.
The velocity spanned by the group of Ly absorption lines is consistent with the velocity dispersion of the group of galaxies. This implies that the Ly absorbers arising in that group occupy the same region of space as the galaxies themselves. Moreover, the spectrum of QSO 15452101 reveals a group of discrete Ly absorption lines at . Multi-component Voigt profile fitting provides a statistically good fit to the data, indicating that the absorption lines arise in overdense gas regions rather than in some smoothly distributed intragroup medium.
The average Doppler dispersion parameter of the absorption lines, b, is measured to be with a dispersion of . This value is in agreement with the values measured in the low redshift Ly forest. Therefore there is no evidence from this case for any physical difference, in terms of the b parameter, between Ly clouds lying within or outside of groups.
Two statistical analyses show that the distribution of galaxies with respect to the absorbers is not random, but that is not possible to confirm a one–to–one match due to the proximity in velocity space of the galaxies in the groups and the uncertainty on their redshifts. A Kolmogorov-Smirnov test showed that a small galaxy-absorber velocity dispersion (less than ) would be required to establish a one–to–one match. As this is well below the typical values corresponding to a galaxy potential well, another approach is required, such as having a large enough sample of clusters or groups of galaxies related to clusters of Ly absorption lines. All the facts above support the idea of a physical connection between the group of galaxies and the group of Ly absorbers.
Another piece of circumstantial evidence pointing to a one–to–one relationship between absorbers and galaxies. This concerns the number of each type of object detected. As mentioned before, the galaxy group towards QSO 15452101 contains approximately 10-20 members. According to Lanzetta et al. (1995), only a subset of them will be close enough to the QSO line of sight to produce observable Ly absorption ( kpc for a covering factor of ). We observe eight individual components in the absorption profile, consistent with the expectations from such a naïve model. There is no obvious reason why such an agreement would be found for some other quite different model (be it HVCs, filaments or any other structure). We note that the absorption lines may break up into further components at higher spectral resolution although these may then be substructure within individual galaxies.
Acknowledgements.
A.O.-G., K.M.L. and A.F.-S. were supported by grant NAG-53261; grants AR-0580-30194A, GO-0594-80194, GO-0594-90194A and GO-0661-20195A from STScI; and grant AST-9624216 from NSF. A.O.-G. acknowledges support from a UNSW Honorary Fellowship. A.F.-S. was also supported by an ARC grant. X.B. was partially supported by the DGES under project PB95-0122.References
- (1) Bahcall, J.N., Kirhakos, S., Saxe, D.H., & Schneider, D.P. 1997, ApJ, 479, 642
- (2) Blitz, L., Spergel, D.N., Teuben, P.J., Hartmann, D., & Burton, W.B. 1998, ApJ submitted (also astro-ph/9803251)
- (3) Bowen, D. V., Blades, J. C., & Pettini, M. 1996, ApJ, 464, 141
- (4) Cayatte, V., Van Gorkom, J. H., Balkowski, C., & Kotanyi, K. 1990, AJ, 100, 604
- (5) Foltz, C. B., Chaffe, F. H., Weymann, R. J., & Anderson, S. F. 1988 in QSO Absorption Lines, ed J. C. Blades, D. Turnshek, & C. Norman (Cambridge University Press), 53
- (6) Lanzetta, K. M., Bowen, D. V., Tytler, D., & Webb, J. K. 1995, ApJ, 442, 538
- (7) Lanzetta, K. M., Webb, J. K., & Barcons, X. 1996, ApJ, 456, L17
- (8) Liske, J., Webb, J. K., & Carswell, R. F. 1999, MNRAS, 301, 787
- (9) Marziani, P., Sulentic, J. W., Dultzin-Hacyan, D., Calvani, M., & Moles, M. 1996, ApJS, 104, 37
- (10) Mathur, S., Wilkes, B.J., Aldcroft, T. 1997, ApJ, 478, 182
- (11) Morris, S. L., Weymann, R. J., Dressler, A., McCarthy, P. J., Smith, B. A., Terrile, R. J., Giovanelli, R., & Irwin, M. J. 1993, ApJ, 419, 524
- (12) Ortiz-Gil, A., Lanzetta, K. M., Webb, J. K., & Barcons, X. 1997, Proceedings of the XIII IAP Colloquium (Paris), 438
- (13) Shull, J. M., Penton, S. V., Stocke, T. J., Giroux, M. L., van Gorkom, J. H., Lee, Y. -H., & Carilli, C. 1998, AJ, 116, 2094
- (14) Tripp, T. M., Lu, L., & Savage, B. 1998, ApJ, 508, 200
- (15) Zabludoff, A. I., & Mulchaey, J. S. 1998, ApJ, 496, 39
Spectrum of QSO 15452101, smoothed at the Nyquist rate. The original data have a resolution of FWHM (FWHM). Tick marks in the upper panel indicate the predicted wavelengths of Ly at the redshifts of the galaxies listed in Table 2. Tick marks in the lower panel show the positions of the detected absorption lines
Image of a field toward QSO 15452101 (north is up, east is left). Marked galaxies are the ones belonging to the group. Numbers increase with increasing z. The QSO is marked by number
(a): cross-correlation function between galaxies and absorbers normalized using a uniform distribution. The existence of a correlation between them is clear. (b): normalized function (see text). There is a clear connection between the real sample of galaxies and the pixels corresponding to absorption lines. (c): cross-correlation function between galaxies and absorbers normalized using a Gaussian distribution. No significant correlation between them is found. (d): normalized function (see text). A one-to-one match between the absorption systems and the galaxies cannot be established
| () | (Å) | ( Å) | () | () | |||
|---|---|---|---|---|---|---|---|
| 0.2504707 | 30 | 0.067 | 0.013 | 66 | 9 | 13.61 | 0.05 |
| 0.2522505 | 16 | 0.21 | 0.03 | 40 | 5 | 13.63 | 0.04 |
| 0.2634336 | 3 | 0.387 | 0.018 | 28.8 | 1.4 | 14.17 | 0.04 |
| 0.2641748 | 3 | 0.307 | 0.016 | 28.0 | 1.2 | 13.94 | 0.02 |
| 0.2645921 | 4 | 0.294 | 0.015 | 27.3 | 1.3 | 13.91 | 0.02 |
| 0.2648250 | 6 | 0.033 | 0.009 | 4 | 5 | 12.84 | 0.12 |
| 0.2650173 | 10 | 0.254 | 0.015 | 26 | 3 | 13.81 | 0.05 |
| 0.2652287 | 23 | 0.117 | 0.014 | 23 | 6 | 13.33 | 0.12 |
| 0.2654554 | 9 | 0.041 | 0.012 | 11 | 4 | 12.84 | 0.08 |
| 0.2656921 | 4 | 0.203 | 0.017 | 23.4 | 1.5 | 13.67 | 0.03 |
| (arcsec) | (arcsec) | (arcsec) | ( kpc) | |||
|---|---|---|---|---|---|---|
| -38.7 | -118.3 | 124.5 | 20.1 | 0.2510 | 306.4 | -19.4 |
| 58.3 | 31.2 | 66.1 | 19.2 | 0.2630 | 167.7 | -20.4 |
| 53.4 | -171.5 | 179.6 | 20.2 | 0.2638 | 456.4 | -19.4 |
| 7.0 | 166.5 | 166.6 | 20.6 | 0.2639 | 423.5 | -19.0 |
| 16.6 | -8.7 | 18.7 | 19.9 | 0.2639 | 47.6 | -19.7 |
| 85.2 | -81.3 | 117.8 | 18.8 | 0.2652 | 300.2 | -20.8 |
| -2.7 | -1.1 | 2.9 | 19.1 | 0.2657 | 7.2 | -20.5 |
| -21.8 | 98.8 | 101.2 | 18.8 | 0.2658 | 258.3 | -20.8 |