Soft X-ray properties of Ultraluminous IRAS Galaxies
Th. Boller
Max-Planck-Institut für Extraterrestrische Physik, Postfach 1603, 85740 Garching
1 Abstract
A sample of 323 Ultraluminous IRAS galaxies (ULIRGs) has been correlated with the ROSAT All-Sky Survey and ROSAT public pointed observations. 22 objects are detected in ROSAT survey observations, and 6 ULIRGs are detected in addition in ROSAT public pointed observations. The detection is based on a visual inspection of the X-ray contour maps overlaid on optical images of ULIRGs taken from the Digitized Sky Survey. Simple power law fits were used to compute the absorption-corrected fluxes of the ROSAT detected ULIRGs. The ratio of the soft X-ray flux to the far-infrared luminosity is used to estimate the contribution from starburst and AGN emitting processes. These results are compared with the ISO SWS ULIRG diagnostic diagram.
2 Class properties of ULIRGs
2.1 Specific observational results
2.1.1 IRAS 10026+4347
The ULIRG IRAS 10026+4347 can also be classified as a narrow-line quasar. The FWHM of the line is about 2500 , and strong optical Fe II multiplet emission is a prominent feature of its optical spectrum. The X-ray spectrum exhibits a steep X-ray continuum slope, with a photon index for a simple power law fit of , typical of narrow-line Seyfert 1 galaxies and narrow-line quasars. The (0.12.4 keV) luminosity of IRAS 10026+4347, obtained via a simple power law fit to the data, and corrected for absorption by neutral hydrogen along the line of sight, is . The ratio of the soft X-ray (0.12.4 keV) to far-infrared (40120 m) flux is 0.25. In Section 2.3 we argue that values of this ratio above about 0.003 require a contribution of an AGN component, in addition to starburst processes.
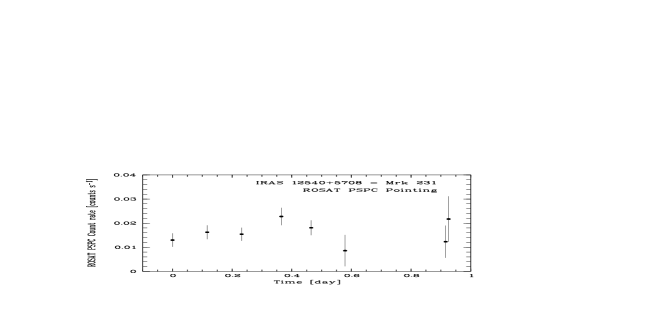
2.1.2 Mrk 231
Mrk 231 (IRAS 12540+5708) is detected both in the ROSAT All-Sky Survey and in ROSAT public pointed observations. The X-ray light curve (cf. Fig. 1), obtained from a ROSAT pointed observation, suggests some indication of variability with a doubling time scale of about 0.4 days.
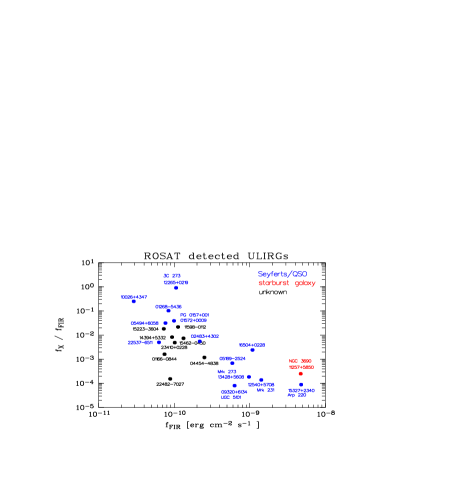
2.2 ROSAT-detected ULIRGs
22 of the 323 ULIRGs from the IRAS 1.2 Jansky redshift catalogue (Fisher et al. 1995) are detected in the ROSAT All-Sky Survey (cf. Table 1). By inspecting the structure of the X-ray emission in overlays on optical images taken from the Digitized Sky Survey, it is strongly believed, that the objects in Table 1 are potential identifications of ULIRGs in soft X-rays. Table 2 lists the ULIRGs detected in public ROSAT pointed observations, in addition to the objects detected in the ROSAT All-Sky Survey. 6 objects are detected in pointed observations, resulting in a total number of 28 ULIRGs detected with ROSAT. Although the ROSAT energy range does not allow the probing of highly obscured regions in ULIRGs, the ROSAT All-Sky Survey allows at least a statistical approach to the class properties of ULIRGs. In Section 2.3 we discuss the ratio of the soft X-ray to far-infrared luminosity of ROSAT detected ULIRGs, which can be used to estimate the relative fraction of starburst emitting processes and emission due to accretion onto supermassive black holes.
| (1) | (2) | (3) | (4) |
|---|---|---|---|
| IRAS (NED) name | log | log | log |
| [erg/s] | [erg/s] | ||
| 011660844 (-) | 45.65 | 42.89 | -2.79 |
| 012685436 (-) | 45.49 | 44.53 | -0.99 |
| 01572+0009 (PG 0157+001) | 46.05 | 44.69 | -1.40 |
| 02483+4302 (-) | 45.39 | 43.15 | -2.25 |
| 044544838 (ESO203-IG1) | 45.48 | 42.57 | -2.92 |
| 051892524 (-) | 45.66 | 42.51 | -3.16 |
| 05494+6058 (-) | 45.43 | 43.96 | -1.50 |
| 11257+5850 (NGC 3690) | 45.34 | 41.74 | -3.60 |
| 115980112 (-) | 46.04 | 44.42 | -1.66 |
| 12265+0219 (3C 273) | 46.05 | 46.06 | -0.04 |
| 14394+5332 (-) | 45.64 | 43.59 | -2.08 |
| 152233604 (-) | 45.46 | 43.75 | -1.74 |
| 154620450 (-) | 45.76 | 43.66 | -2.13 |
| 16504+0228 (NGC 6240) | 45.44 | 42.84 | -2.61 |
| 224827027 (-) | 45.62 | 41.84 | -3.81 |
| 225376511 (PKS 2253-65) | 45.59 | 43.32 | -2.30 |
| 23410+0228 (-) | 45.56 | 43.27 | -2.31 |
| 15327+2340 (Arp 220) | 45.83 | 41.78 | -4.04 |
| 13428+5608 (MRK 273) | 45.77 | 42.05 | -3.73 |
| 12540+5708 (Mrk 231) | 46.03 | 42.19 | -3.85 |
| 09320+6134 (UGC 5101) | 45.62 | 41.54 | -4.09 |
| 10026+4347 (-) | 45.59 | 45.05 | -0.60 |
| (1) | (2) | (3) | (4) |
|---|---|---|---|
| IRAS (NED) name | log | log | log |
| [erg/s] | [erg/s] | ||
| 07598+6508 | 45.86 | 43.37 | -2.53 |
| ([HB89]0759+651) | |||
| 13451+1232 (-) | 45.73 | 42.69 | -3.08 |
| 143481447 (-) | 45.95 | 42.56 | -3.42 |
| 150334333 (-) | 45.73 | 42.67 | -3.09 |
| 15250+3609 (-) | 45.61 | 42.02 | -3.60 |
| 205514250 (JB40) | 45.63 | 42.05 | -3.59 |
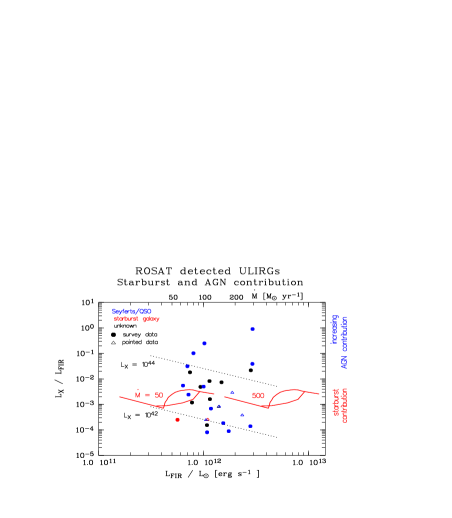
2.3 The soft X-ray to far-infrared flux ratio
Since the total X-ray luminosity of a star-forming galaxy is proportional to its total star-formation rate, one might assume that a high X-ray luminosity might just reflect a high star-formation rate. A problem with this picture arises when one compares the soft X-ray (0.12.4 keV) flux with the far-infrared (40120 m) flux. Both quantities are proportional to the star-formation rate, and an increase in the star-formation rate results in the first order in a horizontal shift of an object in Fig. 2. We (Boller & Bertoldi 1996) found that in equilibrium, the ratio of the soft X-ray to far-infrared flux is about 0.003. Considering variable star-formation rates, the ratio between both quantities varies by about a factor of 3 (see the evolutionary tracks in the right panel of Fig. 2, where an increase of the star-formation rate by a factor of 10 for a time scale of years is assumed). The total far-infrared fluxes were computed from the IRAS 60 and 100 m fluxes following Helou (1985). To compute the soft X-ray fluxes from the PSPC count rate, a simple power law spectrum of the form was assumed. The fluxes were converted into luminosities using eq. 7 of Schmidt & Green (1986). A Hubble constant of and a cosmological deceleration parameter of were adopted. In Fig. 2 (left panel) the ratio between the soft X-ray and far-infrared flux is plotted against the far-infrared flux. The right panel gives the corresponding distribution for luminosities. The ratio between the soft X-ray and far-infrared flux ranges over 4 orders of magnitude. An additional AGN contribution is necessary to reach the X-ray to far-infrared ratio for those objects with values above 0.003.
3 Comparison with ISO SWS results
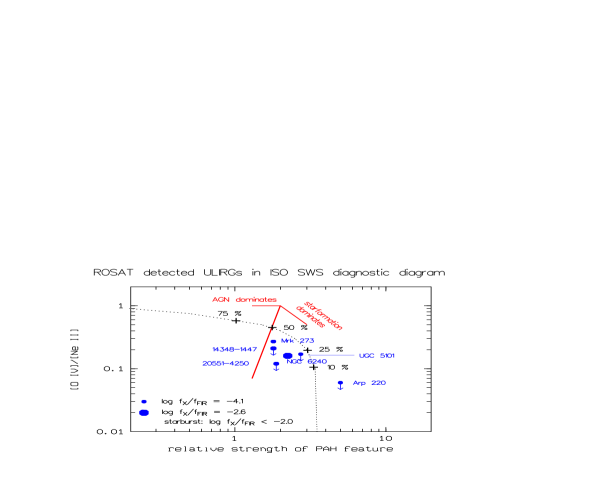
In Fig. 3 the ROSAT results are compared with the diagnostic diagram obtained from ISO SWS measurements to distinguish between starburst and AGN processes in ULIRGs. The ISO SWS diagnostic diagram shows the ratio between the high- and low-excitation fine structure lines versus the strength of the PAH m feature (see Lutz, this proceedings). The circles indicate ROSAT-detected ULIRGs which have measured values in the ISO diagnostic diagram. The size of the circle scales with increasing soft X-ray to far-infrared flux ratio. All ROSAT detected-ULIRGs in this diagram are predominantly powered by star-formation processes, as the ratio for all objects is below the critical value of 0.003. This is in agreement with the prediction from the ISO measurements, as all objects are located in Fig. 3 in the region where the AGN contribution is less than 50 per cent. For ROSAT-detected ULIRGs with ratios of the soft X-ray to far-infrared flux above a value of 0.003, no ISO SWS [O IV], Ne II or PAH feature measurements are available.
4 Future prospects for the study of ULIRGs
We have proposed to observe the most interesting ULIRGs within the guaranteed time program of XMM. We intend to extend our studies by precisely determining the spectral and timing properties of ULIRGs, to further disentangle starburst- and AGN-emitting processes in ULIRGs.
References
- [1] Boller Th., Bertoldi F., 1996, The Physics of LINERs in View of Recent Observations, Astronomical Society of the Pacific Conference Series, ed: M.Eracleous, A.Koratkar, C. Leitherer, and L. Ho, Vol. 103, p.159-162.
- [2] Fisher, K.B., Huchra, J.P., Strauss, M.A., Davis M. Yahi. A., Schlegel D. (1995), ApJS, 100, 69
- [3] Helou, G., Soifer, B.T., Rowan-Robinson, M., (1985), ApJ, L7
- [4] Schmidt, M., Green, R.F., (1986), ApJ, 305, 68