Evidence for an Expanding Molecular Superbubble in M 82
Abstract
We present evidence for an expanding superbubble in M 82 (diameter: 130 pc, expansion velocity: 45 km s-1, mass: M⊙). It is seen in the , , and lines. The superbubble is centred around the most powerful supernova remnant, 41.9+58. The CO observations show that the molecular superbubble already broke out of the disk. This scenario is supported by ROSAT HRI observations which suggest that hot coronal gas originating from inside the shell is the main contributor to the diffuse X–ray outflow in M 82. We briefly discuss observations of the same region at other wavelengths (radio continuum, optical, H I, X–rays, ionized gas). From our spectral line observations, we derive a kinematic age of about years for the superbubble. Using simple theoretical models, the total energy needed for the creation of this superbubble is of order ergs. The required energy input rate (0.001 SN yr-1) is reasonable given the high supernova (SN) rate of SN yr-1 in the central part of M 82. As much as 10% of the energy needed to create the superbubble is still present in form of the kinetic energy of the expanding molecular shell. Of order 10% is conserved in the hot X–ray emitting gas emerging from the superbubble into the halo of M 82. This newly detected expanding molecular superbubble is believed to be powered by the same objects that also lie at the origin of the prominent X–ray outflow in M 82. It can therefore be used as an alternative tool to investigate the physical properties of these sources.
Key Words.:
ISM: bubbles – galaxies: individual: M 82 – galaxies: ISM – galaxies: kinematics and dynamics – galaxies: starburst – X-rays: ISM1 Introduction
M 82 is the best studied nearby starburst galaxy (). The central few hundred parsecs of this galaxy are heavily obscured by dust and gas which hides the central starburst region against direct observations at optical wavelengths. Evidence for strong star–forming activity in the central region comes from radio (e.g. Kronberg et al. kronberg81 (1981)) and infrared observations (e.g. Telesco et al. telesco91 (1991)) and also from the prominent bipolar outflow visible in (e.g. Bland & Tully bland88 (1988), McKeith et al. mckeith95 (1995), Shopbell & Bland–Hawthorn shopbell98 (1998)) and in X-rays (e.g. Bregman et al. bregman (1995)). The massive star formation (SF) is believed to be fuelled by the large amount of molecular gas which is present in the centre of M 82.
On the other hand, SF effects the distribution and kinematics of the surrounding interstellar medium (ISM). Recent millimetre continuum observations (Carlstrom & Kronberg carlstrom90 (1990)) suggested that the HII regions in M 82 have swept up most of the surrounding neutral gas and dust into dense shells. This is in agreement with the standard picture: shells are created by young star–forming regions through strong stellar winds of the most massive stars in a cluster and through subsequent type–II supernovae (e.g. Tenorio–Tagle & Bodenheimer tenorio88 (1991)). These processes are thought to blow huge cavities filled with coronal gas into their ambient ISM (e.g. Cox & Smith cox74 (1974), Weaver et al. weaver77 (1977)). This hot interior is then believed to drive the expansion of the outer shell of swept–up material.
Once superbubbles reach sizes that are comparable to the thickness of a galaxy’s disk, the bubble will eventually break out into the halo. This then leads to an outflow of the hot gas with velocities much higher than the expansion of the shell within the disk of the galaxy. In the following we present evidence for a molecular superbubble in M 82 which already broke out of the disk and seems to contribute significantly to the well–known prominent outflow of M 82.
2 Observations
2.1 Molecular Lines
For our analysis we used the data cube obtained by Shen & Lo (shen (1995)) with the BIMA array (spatial resolution: ) and the data cube from Neininger et al. (nico13 (1998)) observed with the Platau de Bure interferometer (PdBI) (spatial resolution: ). In addition, we used unpublished PdBI data of the and transitions. These observations where carried out in April 1997 in the CD configuration, resulting in a spatial resolution of () and (), and a velocity resolution of 3.3 km s-1 and 6.8 km s-1, respectively. In order to increase the sensitivity to extended CO emission we combined the data cube with single dish measurements obtained with the IRAM 30m telescope. These observations were carried out in May 1998. The combination is essential for this particular study because the receding part of the superbubble is only marginally visible in the mere interferometer maps. A full account of the data reduction will be given elsewhere.
2.2 Evidence for an Expanding Superbubble
Fig. 1 shows the integrated line emission published by Shen & Lo (shen (1995)). The cross corresponds to the position of the supernova remnant 41.9+58 (SNR 41.9+58) which is the strongest cm continuum point–source in M 82 (Kronberg et al. kronberg81 (1981)). It is considered to be the aftermath of a ’hypernova’, which exhibits a radio luminosity 50–100 times greater than typical for type–II SNe (Wilkinson & de Bruyn wilkinson (1990)). The line along the major axis indicates the orientation of the position–velocity (pv) diagrams shown in Fig. 2.
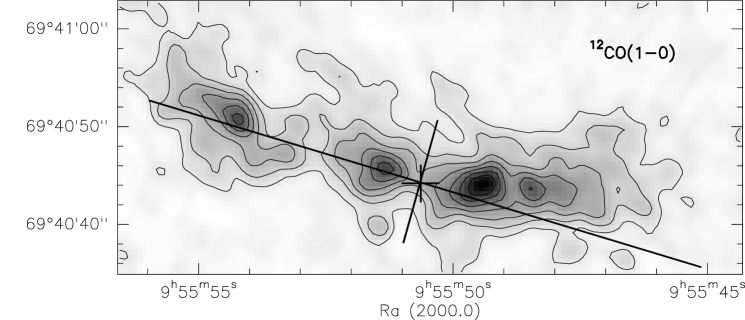
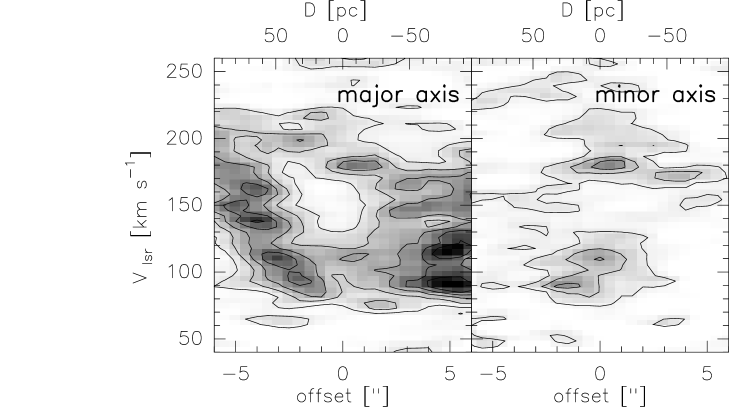
The pv–cut is orientated in such a way that the signature of the expanding superbubble is visible most distinctly. The angular axis of the pv diagrams correspond to the offset in arcseconds from SNR 41.9+58. Besides a constant velocity gradient (cf. Shen & Lo shen (1995)) the pv–diagrams show an expanding ring–like feature centred on SNR 41.9+58, with a central velocity of . The approaching velocity component of the ring is clearly seen in all cubes and is centred at . The receding component is only marginally visible in the and lines; its central velocity is about . An enlargement of the pv–diagram along the major axis is shown in Fig. 3 (left). From this diagram we estimate the radius of the ring to be () pc and the expansion velocity () km s-1. A pv–diagram along the minor axis centred on SNR 41.9+58 is presented in Fig. 3 (right). The orientation of the cut is shown in Fig. 1.
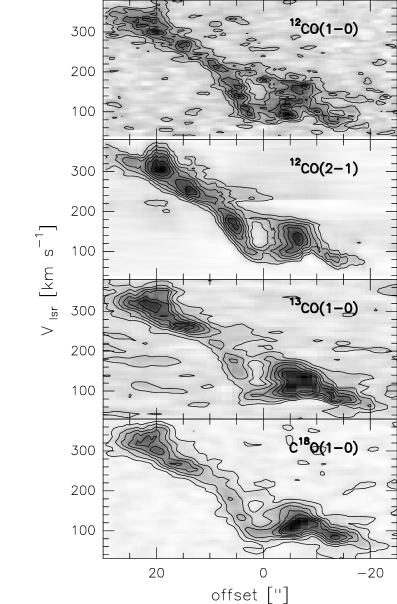
Fig. 3 (right) reveals two emission features centred at the position of SNR 41.9+58, which correspond to the approaching () and the receding component () of the expanding superbubble. Hardly any CO emission with a velocity between and is found south and north of SNR 41.9+58. The pv–diagrams therefore show that the expanding molecular shell has already broken out of the disk and now only shows the signature of an expanding molecular ring. It should be noted that the remaining molecular gas in M 82 shows clear solid–body rotation.
2.3 Other wavelengths
Radio continuum observations:
Radio continuum observations at 408 MHz by Wills et al. (wills97 (1997)) unveiled a prominent ‘hole’ of approximately 100 pc diameter around SNR 41.9+58 which they attribute to free–free absorption. They propose that this feature is due to absorption by a large H II region that has been photoionized by a cluster of early–type stars of which the progenitor of SNR 41.9+58 was originally a member. It should be noted, however, that SNR 41.9+58 is only about 50 years old (Wilkinson & de Bruyn wilkinson (1990)) and therefore cannot be the source that drives the expansion of the superbubble. But its presence supports the scenario that the expanding molecular superbubble is powered by an interior stellar cluster.
Neutral hydrogen (HI):
H I emission line studies show that the central kpc of M 82 is dominated by absorption (Yun et al. yun93 (1993)), which makes it difficult to study the H I kinematics in the central part of the galaxy. Recent H I absorption studies against supernova remnants in M 82 by Wills et al. (wills98 (1998)) disclosed two absorption features against SNR 41.9+58. The velocities of the components are and . The H I component at 87 km s-1 can be attributed to the approaching component of the expanding superbubble. The absorption feature at 200 km s-1, if associated with the receding part, seems to contradict the hypothesis that SNR 41.9+58 is located within the expanding superbubble. However, the velocity resolution of the absorption study was rather poor (26.4 km s-1) and other explanations cannot be ruled out at this point.
Optical observations:
Optical observations of the centre of M 82 suffer heavily from light absorption by the prominent dust lanes, rendering an optical analysis of this particular region impossible. HST V– and I–band images of the centre of M 82 (O’Connell et al. connell95 (1995)) do not reveal any optical sources in the vicinity of SNR 41.9+58. The prominent outflow is visible north and south of the absorbing dust lane (Bland & Tully bland88 (1988), McKeith et al. mckeith95 (1995), Shopbell & Bland–Hawthorn shopbell98 (1998)). The orientation of its filaments suggests that the outflow emerges at least partly from the location of the molecular superbubble.
X–ray observations:
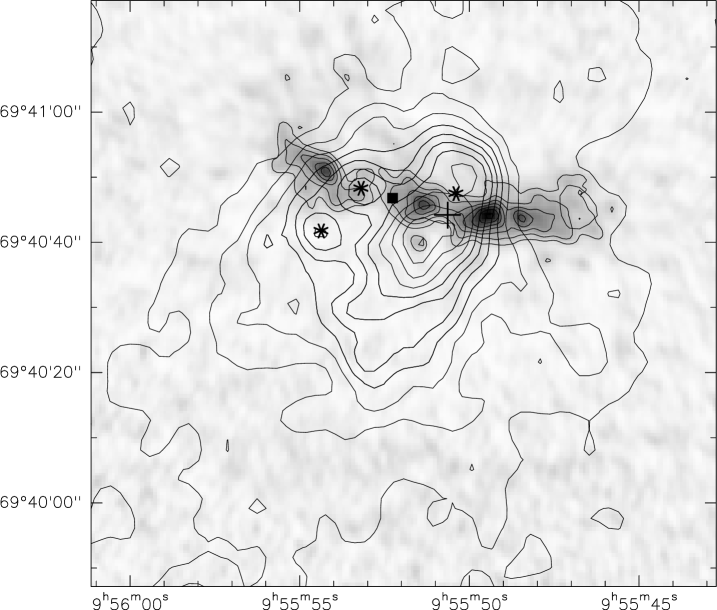
Fig. 4 shows an overlay of archival ROSAT HRI X–ray data (Bregman et al. bregman (1995)) onto the CO emission. To emphasize the diffuse, extended X–ray outflow we subtracted a model of the brightest X–ray point source at , (J2000.0) and smoothed the residual image to a resolution. The positions of the three point sources in the field are marked with stars, SNR 41.9+58 is marked by a cross (see also Bregman et al.). The overlay shows that most of the diffuse X–ray emission arises from the vicinity of SNR 41.9+58. The shape of the diffuse emission is elongated, extending several arcminutes along the minor axis of the galaxy. Model calculations by Bregman et al. show that the emission is consistent with an outflow of heated material from the central region coincident with the position of the expanding molecular superbubble.
We estimate an upper limit for the energy still present in the hot gas emerging from the superbubble. For the calculation we adopt a density and a temperature for the central region (Bregman et al.) as an upper limit for the mean values in the outflow. We find an upper limit for the energy of ergs present in a cylindrical volume with and centred on the superbubble. From the thickness of the molecular disk of M 82 () and the expansion velocity of the superbubble we estimate a time elapsed since outbreak of . The required outflow velocity to reach the observed height above the disk therefore is . This value is comparable with estimates based on particle aging as derived from radio continuum observations (Seaquist et al. seaquist85 (1985)) and measured outflow velocities in (McKeith et al. mckeith95 (1995)).
Ionized gas:
Most studies of the ionized gas in M 82 unfortunately do not provide sufficient spatial and spectral resolution to reveal details of the region under study. A high–resolution study of the Ne II emission line has been published by Achtermann & Lacy (achtermann (1995)). The integrated line emission in the south–western region of M 82 shows a similar double–peaked feature centred on SNR 41.9+58 as traced by the CO. The pv–cut along the major axis clearly shows a disturbed velocity field in the vicinity of SNR 41.9+58. The approaching side of the expanding superbubble at 95 km s-1 is clearly visible while the receding side at 190 km s-1 is only marginally seen. The diameter of the Ne II shell ( 100 pc) seems to be somewhat smaller than the corresponding CO feature, suggesting that the inner part of the expanding superbubble is ionized. Similar features are visible in the distribution and the kinematics of the H41 emission line (Seaquist et al. seaquist96 (1996)). The Ne II distribution might represent the transition from the hot coronal gas with a temperature of several K towards the cold molecular rim of the superbubble.
3 Discussion
The picture that emerges from the observations presented above is the following: a major SF event at the centre of what today shows up as the prominent expanding molecular superbubble created a cavity filled with coronal gas by the combined effects of strong stellar winds and SN explosions. The pressure of the hot–gas interior drove the expansion of the shell of swept–up material until it broke out of the disk. The subsequent outflow of hot material today shows up as diffuse X–ray emission and contributes to the prominent filaments.
From the observational parameters of the expanding superbubble (expansion velocity and diameter) we estimate a kinematic age of the superbubble of years. The kinematic age is an upper limit for the actual age since the superbubble is most probably decelerating. We use Chevalier’s equation (Chevalier chev74 (1974)) to derive the amount of energy needed to create the expanding superbubble. Since Chevalier’s equation applies to H I shells only we corrected the energy input by a factor of 2 to correct for the difference in mass between H2 and H. We estimate an ambient H2 density prior to the creation of the shell of order . This is done by converting the line integral to H2 column density using a conversion ratio of N(H2)/W(CO) = cm-2 K-1 km-1s (Smith et al. smith (1991)) and estimating the volume of the region from which material was swept up to be cylindrical with and . We derive a total energy of order ergs, which corresponds to an energy equivalent of approximately 1000 type–II SNe and the strong stellar winds of their progenitors. With the estimate for the age of the superbubble this leads to a SN rate of 0.001 SN yr-1 for the central stellar cluster. This is a reasonable number given the fact that the SN rate in the central part of M 82 was estimated to be about 0.1 SN yr-1 (Kronberg et al. kronberg81 (1981)). The total H2 mass of the superbubble is about . Less than 15% of the total energy is still present in the hot gas which emerges from the superbubble; the fraction of kinetic energy of the molecular superbubble is about 10% (ergs). It should be noted, however, that the numbers given above are only order of magnitude estimates.
The wealth of observations presented above indicates that the region under study represents an unusually active segment of the starburst in M 82. The finding of an expanding molecular superbubble in this particular region supports this view and provides clear evidence for a footprint of violent SF in the ISM of M 82. Furthermore the analysis of the molecular superbubble presents an alternative tool to investigate the energy release of the central source which drives the X–ray and contributes to the outflow.
Acknowledgements.
A.W. and F.W. acknowledge DFG grant III GK–GRK 118/2. We thank J. Shen and K.Y. Lo for making available their CO data, J. Kerp for his help on the ROSAT data and the referee, P. Kronberg, for helpful comments. We acknowledge the IRAM staff for carrying out the observations and the help provided during the data reduction.References
- (1) Achtermann J.M., Lacy J.H, 1995, ApJ 439, 163
- (2) Bland J., Tully B., 1988, Nature 334, 43B
- (3) Bregman J.N., Schulman E., Tomisaka K., 1995, ApJ 439, 155
- (4) Carlstrom, J.E., Kronberg, P.P, 1990, ApJ 366, 422
- (5) Chevalier R.A., 1974, ApJ 188, 501
- (6) Cox D.P, Smith B.W., 1974, ApJ 189, L105
- (7) Dietz K., Smith J., Hackwell J.A., Gehrz D.R., Grasdalen G.L., 1986, AJ 91, 758
- (8) Kronberg, P.P., Biermann P., Schwab F.R., 1981, ApJ 291, 693
- (9) McKeith, C.D., Greve, A., Downes D., Prada, F., 1995, A&A 293, 703
- (10) Neininger N., Guélin M., Klein U., Wielebinski R., 1998, A&A 339, 737
- (11) O’Connell R.W., Gallagher III J.S., Hunter D.A. Colley W.N., 1995, ApJ 446, L1
- (12) Seaquist E.R., Bell M.B., Bignell, R.C., 1985, ApJ 294, 546
- (13) Seaquist E.R., Carlstrom J.E., Bryant P.M., Bell M.B., 1996, ApJ 465, 691
- (14) Shen J., Lo K.Y., 1995, ApJ 445, L99
- (15) Shopbell P.L., Bland–Hawthorn J., 1998, ApJ 493, 129
- (16) Smith P.A., Brand P.W.J.L., Mountain C.M., Puxley P.J., Nakai N, 1991 , MNRAS 252, 6
- (17) Telesco C.M., Campins H., Joy M., Dietz K., Decher R., 1991, ApJ 369, 135
- (18) Tenorio–Tagle G., Bodenheimer P., 1988, ARA&A, 26, 145
- (19) Weaver R., McCray O., Castor J., Shapiro P., Moore R., 1977, ApJ 218, 377
- (20) Wilkinson P.N., de Bruyn A.G, 1990, MNRAS 242, 529
- (21) Wills K.A., Pedlar A., Muxlow T., Wilkinson P.N., 1997, MNRAS, 291, 517
- (22) Wills K.A., Pedlar A., Muxlow T., 1998, MNRAS 298, 347
- (23) Yun M.S., Ho P.T.P, Lo K.Y., 1993, ApJ 411, L17