Variation of the broad X-ray iron line in MCG–6-30-15 during a flare
Abstract
We report results on the broad iron emission line of the Seyfert galaxy MCG–6-30-15, obtained from the second long ASCA observation in 1997. The time-averaged profile of the broad line is very similar to that seen with ASCA in 1994, so confirming the detailed model fit then obtained. A bright flare is seen in the light curve, during which the continuum was soft. At that time the emission line peaks around 5 keV and most of its emission is shifted below 6 keV with no component detected at 6.4 keV ( eV). This can be interpreted as the result of an extraordinarily large gravitational redshift due to a dominant flare occurring very close to the black hole at a radius of .
keywords:
galaxies: individual: MCG–6-30-15 – galaxies: Seyfert – X-rays: galaxies1 Introduction
A major discovery from ASCA has been the discovery of a clear, broad, skewed iron line in the spectrum of the Seyfert galaxy MCG–6-30-15 (Tanaka et al 1995). This emission line has a profile matching that expected from the inner regions, from about 6 to 40 gravitational radii (i.e. 6 – 40 ), of a disk around a black hole (Fabian et al 1989). No simple alternative model is capable of explaining this profile (Fabian et al 1995). Similar skewed lines have since been found in the spectra of many other Seyfert galaxies (Nandra et al 1997; Reynolds 1997). The broad line in MCG–6-30-15 has also been clearly detected with BeppoSAX (Guainazzi et al 1999).
The 1994 ASCA observation of MCG–6-30-15 reported by Tanaka et al (1995) remains however the best example of a broad line due to the good spectral resolution of the detectors used and the long integration time of 4.5 days. Here we report on a similar long ASCA observation of the object made in 1997. We confirm in detail the time-averaged line shape, which only shows a small change in the ‘blue’ horn.
During the 1994 ASCA observation the light curve of the source showed both a flare and a deep minimum (Iwasawa et al 1996). The line profile was seen to alter, being mostly a blue horn during the flare and then showing only an extreme red horn during the minimum. These changes were assumed to be due to changes in the location in the most active regions irradiating the disk (and so producing the iron line), the flare being on the approaching side of the disk and the minimum emission from within the innermost stable orbit of a non-spinning Schwarzschild black hole (Iwasawa et al 1996). This last possibility has been explored further by Dabrowski et al (1997), Reynolds & Begelman (1998); Weaver & Yaqoob (1998) and Young, Ross & Fabian (1998).
The light curve of the source during 1997 also shows flares and dips. We examine in detail here the major flare seen during which both the continuum and line show large changes.
2 Observations and data reduction
MCG–6-30-15 was observed with ASCA from 1997 August 3 to 1997 August 10 with a half-day gap in the middle. It was also observed simultaneously with Rossi X-ray Timing Explorer (RXTE) (Lee et al 1999).
The Solid state Imaging Spectrometer (SIS; S0 and S1) was operated in Faint mode throughout the observation, using the standard CCD chips (S0C1 and S1C3). The Gas Imaging Spectrometer (GIS; G2 and G3) was operated in PH mode. We present results mainly from the SIS data in this Letter. The ASCA S0 light curve in the 0.6–10 keV band is shown in Fig. 1.

Data reduction was carried out using FTOOLS version 4.0 and 4.1 with standard calibration provided by the ASCA Guest Observer Facility (GOF). The good exposure time is approximately 231 ks from each SIS detector. The source counts are collected from a region centred at the X-ray peak within 4 arcmin in radius for the SIS and 5 arcmin for the GIS. The background data are taken from a (nearly) source-free region in the same detector with the same observing time. The efficiency of the S1 detector below 1 keV appears to be severely reduced due to the Residual Darkframe Distribution (RDD, Dotani 1998), which the current response matrix (generated from calibratione files in the FTOOLS version 4.1 release) does not take into account for. The RDD effect on the S0 data from 1CCD observations has been found to be very little (Dotani 1998). Therefore, the S1 data below 1 keV were discarded for the spectral analysis presented here. The energy resolution of the SIS at 6.4 keV when the observation was carried out had degraded to eV (FWHM), about twice that attained immediately after launch of the satellite.
3 Comparisons with the 1994 long observation
The average count rates in the 0.6–10 keV band from the S0/S1 detectors are 1.16/0.93 ct s-1(cf. 1.53/1.25 ct s-1 during the previous long observation in 1994). The average observed fluxes are erg cm-2 s-1 in the 0.5–2 keV band and erg cm-2 s-1 in the 2–10 keV band.
3.1 Total energy spectrum and warm absorber
The observed 0.6–10 keV X-ray flux during the present observation is lower by 26 per cent than that during the 94 long observation. The 3–10 keV (the iron K band, 4–7.5 keV, excluded) power-law slope is , which is similar to the 94 data. Features of the warm absorber detected are two edges due to OVII at 0.72 keV and OVIII at 0.85 keV (e.g., Otani et al 1996) and one at 1.1 keV, probably due to NeIX and/or Fe L. The 97 spectrum is harder in the low energy band than the 94 spectrum, which may be explained by an increase in absorption. Details will be reported by Matsumoto et al (in prep).
3.2 The iron K line
The 3–10 keV data were investigated for iron K line emission. The continuum spectrum was modelled with a power-law reflection model (pexrav, Magdziarz & Zdziarski 1995) modified by cold absorption of cm-2(which has virtually no effect on the 3–10 keV continuum). The parameters of pexrav, apart from photon index and normalization, were matched to the previous measurements of MCG–6-30-15: the cut-off energy, 130 keV (from the BeppoSAX observation by Guainazzi et al 1999); reflection intensity, corresponding to (Guainazzi et al 1999; Lee et al 1999); iron abundance of unity (Lee et al 1999); and inclination of the reflecting slab, 30∘ (Tanaka et al 1995). The line feature is fitted by the diskline model for a Schwarzschild black hole (Fabian et al 1989). The rest energy of the line emission is assumed to be 6.4 keV, appropriate for cold iron. A power-law () modified by reflection plus a diskline model provide a good fit ( for 729 degrees of freedom). The best-fit parameters of the diskline model are shown in Table 1.

| (1) | (2) | (3) | (4) | (5) | (6) | (7) |
|---|---|---|---|---|---|---|
| keV | deg | ph s-1 cm-2 | eV | |||
| 6.4 |
The efficiency-corrected line profile111This is not an ‘unfolded’ spectrum but obtained from the ratio, the data divided by the power-law model (folded through the detector response) best-fitting the neighbouring continuum, multiplied by the power-law (in original form). The plot is therefore independent from the model used for fitting the line. for the present data set is shown in Fig. 2, along with the one from the previous long observation in 1994 (Tanaka et al 1995). The profile from the present observation appears to be less bright in the blue peak while it shows a slightly more extended red wing. During the previous observation, the bright flare (i-3) data showed a narrow-core-dominated line profile (Iwasawa et al 1996). Such a line shape is not found during the present observation. However, this is not sufficient to explain the difference in the blue horn of the time-averaged line profiles between the two observations. Although the overall line shape is similar between 94 and 97, the steeper radial emissivity index suggests that the mean weight of the line emissivity may be slightly shifted towards the inner part of the accretion disk in 97 as compared to 94.
4 The major flare
Changes in the iron line profile were investigated in time sequence, details of which will be reported elsewhere. Here we show the peculiar behaviour of the energy spectrum and iron line during the major flare, which occured around s in the light curve (see Fig. 1 and Fig. 3 for a detailed version of the light curve around the flare). The continuum is steeper than usual (), particularly at low energies (1–3 keV band), as shown in Fig. 4.


4.1 Iron K line emission with large redshift?
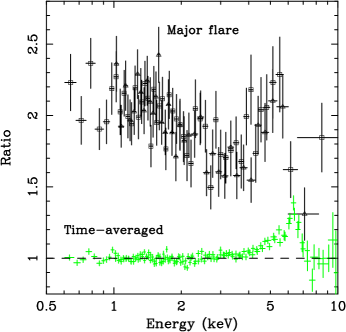
Excess emission above a power-law continuum, which is presumably due to broad iron K line emission, is found in the 4–7 keV range. The ratio plots of the data and the baseline power-law model for the intervals of the flare peak (a) and of the subsequent dip (b) are shown in Fig. 5. The baseline model is obtained by fitting a power-law to the data adjacent to the iron line band.
The line profile of the flare peak (a) shows a sharp decline at 5.6 keV, which is far below the rest energy of the line emission of Fe K, 6.4 keV, and a red-wing extending down to 3.5 keV. We have checked the GIS data which confirm the SIS result. No line emission is detected at 6.4 keV (ph s-1 cm-2, eV, 90 per cent upper limits obtained from the joint fit to the SIS and GIS data). This extremely redshifted line profile cannot be explained by the diskline for a Schwarzschild black hole because of insufficient gravitational redshift (it may arise from infalling gas, as proposed by Reynolds & Begelman 1997, but then there would also be a large absorption edge; Young et al 1998). On the other hand, the diskline model for a Kerr black hole by Laor (1991; which is for a maximally-rotating black hole) gives a good fit. The result of this diskline fit is shown in Table 5, where the rest line energy, the inner radius and inclination of the disk are assumed to be 6.4 keV, 1.235, and 30∘. The outer radius is constrained well at due to the well-defined decline of the redshifted, blue peak. The inferred negative emissivity index (it is poorly constrained) and the well-constrained outer radius perhaps suggest the line emission is concentrated in annuli around 5. A fit with a double-gaussian to the line profile is also given in Table 5. The line intensity of the line is about 3 times larger than that of the time-averaged one. The EW is eV when computed with respect to the continuum at 6.4 keV but eV to the continuum in the energy range of the observed line.
The line profile models available in XSPEC, the fits of which have just been reported above, are for complete disk annuli. It is possible however that just part of an annulus of the disk is irradiated during a flare, i.e. that part immediately below the flare itself. This offers further possible locations for the flare such as on the receding side of the disk where the peak at 5 keV is mostly due to the doppler effect, or on the approaching side much closer in where it is due to gravitational redshift. We show in Fig. 6 the locus of points which cause a 6.4 keV line in the disk frame to appear at 5 keV for an observer seeing the disk around a maximally spinning black hole at an inclination of . We have also fit the flare spectrum with model line profiles created from a disk divided into 36 azimuthal sectors and 24 radial bins between 1 and 25 . Although acceptable fits at level are found for most of the points around this locus, the region at small radii () on the approaching side of the disk is favoured most (see the confidence contours in Fig. 6). This is mainly due to the excess flux around 4 keV shown in Fig 5a and not the choice of grid size.
In the subsequent time-interval b, the averaged 0.6–10 keV count rate dropped by a factor of 2.2, compared with the flare interval (see Fig. 3). The line shape has then recovered to the ordinary one, as seen in the time-averaged spectrum (Fig. 5b). The line intensity, ph s-1 cm-2, also dropped by a factor of 2.


| Diskline (Laor 1991) | ||||||
|---|---|---|---|---|---|---|
| /dof | ||||||
| keV | deg | ph s-1 cm-2 | ||||
| 6.4 | 1.235 | 30 | 102.0/143 | |||
| Double-gaussian | ||||||
| /dof | ||||||
| keV | keV | ph s-1 cm-2 | keV | keV | ph s-1 cm-2 | |
| 101.6/140 | ||||||
5 Discussion
The long ASCA observation of 1997 has confirmed in detail the broad iron line in the Seyfert galaxy MCG–6-30-15. The time-averaged emission appears to originate from a disk extending between about 6 and 40 of a massive black hole. If the rapid variability of this source is due to flares above the accretion disk, then the long term constancy of the line profile indicates that there are usually several flares at once on the disk and that the distribution of flares is almost constant in a time-averaged sense.
The spectrum of the source, and in particular the line profile, changed dramatically during a bright flare. Unlike the bright blue horn apparent during the 1994 flare, we now see essentially a bright red horn. If this is interpreted in the context of a relativistic diskline, the dominant flare must occur at smaller radii than usual. There are two possible locations of the flare, depending on the mass of the black hole in MCG–6-30-15.
One interesting possibility is a flare localized on the approaching side of the disk at (see Fig. 6). The duration of the flare is about 1 hour while the Keplerian orbital time around a M⊙ black hole is s at . If the flare is confined within, say, 1/6 orbit at 2.5 (see Fig. 6), the duration of the flare (and peculiar line shape) requires the black hole mass to be larger than M⊙. Therefore this solution is valid only if the black hole in MCG–6-30-15 is more massive than M⊙.
The spectral fit with the model for azimuthally-averaged line emission (Laor 1991) suggested that the line emission may be produced in a narrow range of radii around 5 during the major flare (see Table 2). The duration of the flare corresponds to orbital time at 5. This is the preferred solution if the black hole mass is significantly smaller than M⊙.
There are some difficulties for the first interpretation. In order to restrict the line production to part of the disk, the flare must be placed very close to the disk surface. A flare on the approaching side of the disk is generally expected to be amplified due to relativistic beaming (e.g., Karas et al 1992), which appears to be consistent with the observed flux variation. However, at a small radii such as 2.5 on a disk inclined at , gravitational redshift and frame dragging overwhelm doppler boosting so that the emission reaching a distant observer is suppressed by more than an order of magnitude when the X-ray source is placed at 1 above the disk (M. Ruszkowski, priv. comm.). Therefore the flare would have to be intrinsically much more intense than observed. This may be possible if the emitted power increases rapidly towards inner radii around a spinning black hole. The strong light deflection implies that the reflection from the disk should also be enhanced by a factor of at the same time (see also Martocchia & Matt 1996). The closeness of the continuum source may also cause the disk surface to be highly ionized. Although the high energy end of the ASCA data is rather noisy, the 6–10 keV spectrum during the flare () suggests a possible spectral flattening which could be due to strong reflection.
The interpretations discussed above are, of course, not unique, but both require that the accretion disk extends close to the central black hole and that it spins rapidly, as suggested by Iwasawa et al (1996).
Although the profile of the broad line in MCG–6-30-15 appears to be fairly constant in a time-averaged sense, it does undergo dramatic changes every few days. Such changes offer interesting possibilities with which to probe different parts of the disk and to map the innermost regions about the black hole.
The lack of a narrow 6.4 keV line during the flare (the 90 per cent upper limit of intensity is only 40 per cent of the blue peak intensity of the time-averaged line) confirms the suggestion made by the previous ASCA observation (Iwasawa et al 1996) that there is little line emission from far out in the disk or torus. A narrow 6.4 keV line might be delayed by an hour or so, if it is produced around . Any line emission from farther out should be more constant because the variability of the line is smeared out. Evidence for such line emission appears to be weak.
Acknowledgements
We thank all the members of the ASCA team. ACF and KI thank Royal Society and PPARC, respectively, for support. Chris Reynolds is thanked for his useful comments.
References
- [1] Dabrowski Y. Fabian A.C., Iwasawa K., Lasenby A.N., Reynolds C.S., 1997, MNRAS, 288, L11
- [2] Dotani T., 1998, http://www.astro.isas.ac.jp/∼dotani/rdd.html
- [3] Fabian A.C., Rees M.J., Stella L., White N.E., 1989, MNRAS, 238, 729
- [4] Fabian A.C., Nandra K., Reynolds C.S., Brandt W.N., Otani C., Tanaka Y., Inoue H., Iwasawa K., 1995, MNRAS, 277, L11
- [5] Guainazzi M., et al, 1999, A&A, 341, L27
- [6] Iwasawa K., et al., 1996, MNRAS, 282, 1038
- [7] Karas V., Vokrouhlicky D., Polnarev A.G., 1992, MNRAS, 259, 569
- [8] Laor A., 1991, ApJ, 376, 90
- [9] Lee J.C., Fabian A.C., Reynolds C.S., Brandt W.N., Iwasawa K., 1999, MNRAS, submitted
- [10] Martocchia A., Matt G., 1996, MNRAS, 282, L53
- [11] Otani C. et al, 1996, PASJ, 48, 211
- [12] Reynolds C.S., Begelman M.C., 1997, ApJ, 488, 109
- [13] Tanaka Y., Inoue H., Holt S.S., 1994, PASJ, 46, L37
- [14] Tanaka Y. et al, 1996, Nat, 375, 659
- [15] Weaver K.A., Yaqoob T., 1998, ApJ, 502, L139
- [16] Yaqoob T., McKernan B., Ptak A., Nandra K., Serlemitsos P.J., 1997, ApJ, 490, L25
- [17] Young A.J., Ross R.R., Fabian A.C., 1998, MNRAS, 300, L11