Diffraction-Limited Imaging and Photometry of NGC 1068
Abstract
The nearby Seyfert 2 Galaxy NGC 1068 was observed with speckle imaging techniques in the near-infrared Hband (1.6 m) at the Hale 200-inch Telescope at Palomar Observatory and Kband (2.2 m) at the 10 m Keck I Telescope at the W. M. Keck Observatory.
Images with diffraction limited or near-diffraction limited resolutions of 0.′′05 0.′′1 were obtained and used to search for structure in the nuclear region. Images of the nucleus of NGC 1068 reveal an extended region of emission which accounts for nearly 50% of the nuclear flux at band. This region extends 10 pc on either side of an unresolved point source nucleus which is at most, 0.′′02 or 1.4 pc in size. Both the point source and the newly imaged extended emission are very red, with identical colors corresponding to a color temperature of 800 K. While the point source is of a size to be consistent with grains in thermal equilibrium with the nuclear source, the extended emission is not. It must consist either of nuclear emission which has been reflected off an extended dusty disk or of small grains raised to transiently high temperatures by reflected UV photons.
Current Address: Department of Physics and Astronomy, UCLA, Box 156205, Los Angeles, CA 90095
1 Introduction
As a close, luminous active galactic nucleus (AGN) [14.4 Mpc (Tully (1988)) so that 1 arcsec=72 pc), NGC 1068 has been studied at nearly every available spatial resolution and wavelength for thirty years. While classified as a Seyfert 2 based on the presence of narrow emission lines and the absence of broad ones, polarization studies have detected broad wings on its narrow emission lines (Antonucci & Miller (1985)). These observations suggest that NGC 1068 harbors an obscured Seyfert 1 nucleus whose broad lines are scattered into our line of sight. Significant modeling of the spectrum and spectral energy distribution has been done by Pier & Krolik (1993) and Granato et al. (1997) for the presence of a dusty torus which conceals the nucleus, and these models can reproduce the observed emission from the X-ray through the near-infrared.
At scales of a few hundred parsecs around the nucleus, HST narrow band (Macchetto et al. (1994)) and continuum (Lynds et al. (1991)) imaging show a non-uniform conical narrow-line region. These observations suggest that clumps of gas have been ionized by a partially collimated nuclear source. Mid-infrared measurements of this area have revealed the presence of warm gas (Cameron et al. (1993)). Previous near infrared onedimensional speckle measurements of the nucleus (McCarthy et al. (1982); Chelli et al. (1987)) showed extended emission on the 100 pc scale, and more recent twodimensional speckle work finds extended emission closer to the nucleus (Wittkowski et al. (1998)). Radio VLBI measurements (Greenhill et al. (1996)) of water maser emission demonstrate the presence of a thick torus, and high-resolution radio maps of the nucleus (Gallimore et al. 1996b ) suggest that the obscuring material takes the form of a warped disk.
The combination of these results have made the nucleus of NGC 1068 the prototypical obscured Seyfert 1. In addition, the nucleus resides in an SB host galaxy with a 3 kpc bar (Scoville et al. (1988); Thronson et al. (1989)) and active star formation in the inner 10 kpc (Telesco et al. (1988)). Authors have speculated on the relationship between this star formation and the activity of the nucleus (Norman & Scoville (1988)).
Near-infrared measurements trace the distribution of hot dust and stars in NGC 1068, and thus characterize the physical condition of the material near the nucleus. The ability to do speckle imaging with the W. M. Keck Telescope allows a resolution of 0.′′05, or 3.6 pc, at 2.2 m which for the first time provides a direct comparison between near infrared and visual (HST) measurements. We use these speckle measurements, as well as complimentary 1.6 m speckle imaging from the 200-inch Telescope and direct imaging at both wavelengths from the Keck Telescope to investigate the physical conditions in the near nuclear region of NGC 1068 on hitherto unavailable scales.
2 Observations
Speckle observations of NGC 1068 were made on four nights, 1994 October 18, 1994 December 19, and 1995 November 45, with the 200-inch Hale Telescope. A 6464 subsection of a 256256 Santa Barbara Research Center InSb array was used in order to allow continuous readout of speckle frames every 0.07 or 0.10 s. Speckle frames were collected in sets of 400 images on the AGN and on the two nearby unresolved SAO catalog stars. The sources were observed at both Hband (=1.65 m, =0.32) and Kband (=2.2 m, =0.4). Additional observations were made on three nights, 1995 December 18-20, at the W. M. Keck Observatory. Images from the full 256256 InSb array of the facility’s Near Infrared Camera (NIRC; Matthews & Soifer (1994)), were taken at a rate of one 0.118 s image every 1.5 s in sets of 100 images on the AGN and on the two nearby unresolved stars SAO 130046 and SAO 110692. A Kband (=2.21 m, =0.43) filter was used for all the observations. The basic observing strategy was reported in Matthews et al. (1996). To reduce the noise contributed by phase discontinuities between the 36 segments of the Keck Telescope, the object and calibrators were observed at 12 different pupil orientations. A summary of observations is provided in Table 1.
| Date | Cal 1 | Cal 2 | integ. | #frames | # K | # H | pixel scale | seeing |
| (SAO) | (SAO) | time (s) | per set | sets | sets | (arcsec | (arcsec) | |
| ) | ||||||||
| 200-Inch Telescope | ||||||||
| 18 Oct 1994 | 130057 | 110709 | 0.1 | 400 | 11 | 10 | 0.036 | 0.7 |
| 19 Dec 1994 | 130057 | 110709 | 0.1 | 400 | 20 | 10 | 0.036 | 0.7 |
| 4 Nov 1995 | 130057 | 110692 | 0.07 | 480 | 14 | 20 | 0.034 | 0.7 |
| 5 Nov 1995 | 130057 | 110692 | 0.1 | 480 | 16 | 14 | 0.034 | 0.9 |
| Keck Telescope | ||||||||
| 18 Dec 1995 | 130046 | 110692 | 0.118 | 100 | 11 | 0.021 | 0.5 | |
| 19 Dec 1995 | 130046 | 110692 | 0.118 | 100 | 12 | 0.021 | 0.5 | |
| 20 Dec 1995 | 130046 | 110692 | 0.118 | 100 | 16 | 0.021 | 0.4 | |
| 16 Jan 1998 | 10.0 | 1 | 3 | 4 | 0.021 | 0.4 | ||
| 16 Jan 1998 | 5.0 | 1 | 1 | 0.15 | 0.4 | |||
At both telescopes, reimaging optics were used to convert the standard detector plate scales to scales appropriate for diffraction limited imaging. At the 200-inch Hale Telescope, detector pixel scales of 0.′′034 and 0.′′036 pixelwere used and at the Keck Telescope, a detector pixel scale of 0.′′021 pixelwas used. The pixel scale at the 200-inch Telescope was chosen to oversample the Kband while still allowing diffraction limited imaging in band. The pixel scale at the Keck Telescope was chosen to sample optimally the aperture in the band.
Several long exposure images of the nuclear region were also taken at the Keck Telescope under photometric conditions in both the Hband and band. In order to avoid saturating the detector, the speckle plate scale of 0.′′021 pixelwas used for these images. The total integration times were 30 seconds at Kband and 40 seconds at band, and the seeing for these images was 0.′′45. A single 5 second Kband image of NGC 1068 was also obtained at the Keck Telescope with a pixel scale of 0.′′15/pixel and seeing of 0.′′45. Although the center is saturated, this image captured the distribution of galactic Kband flux at distances greater than 0.′′75 from the nucleus. HST infrared standard stars of (Persson (1998)) were observed both with and without the reimaging optics.
3 Data Analysis
In preliminary processing, each image was sky subtracted and flat fielded, and bad pixels were corrected by interpolation. The full NIRC frame of 256256 pixels was clipped around the centroid of each speckle frame to 128128 pixels (2.′′6 on a side). Outside this smaller field, the signal-to-noise-ratio in each pixel is less than one-fifth, so clipping cut out pixels which would add only noise to the Fourier analysis. In the 200-inch data no clipping was necessary since a smaller field was used in collecting the images. In the second stage of analysis, the object’s Fourier amplitudes and phases were recovered via classical speckle analysis (Labeyrie (1970)) and bispectral analysis (Weigelt (1987)) respectively. For the data from the Keck Telescope, both processes were modified from the standard procedure to incorporate the field rotation that occurred during the observations (Matthews et al. (1996)). The observations were made over a spread of 103∘ in parallactic angle, although the change in parallactic angle over a single stack of 100 frames was always less than 2∘. Linear interpolation was used to find the rotated pixel values in each frame. The bispectral analysis was sufficiently computationally intensive as to require the use of the Caltech Concurrent Supercomputing Facility’s nCUBE2 and Intel Delta computers.
In order to go from the Fourier components calculated above to a final image, it is necessary to include a smoothing function, or effectively a telescope transfer function; a Gaussian of FWHM equal to the where is the wavelength of the observations and is the diameter of the telescope, was multiplied by the Fourier amplitudes. Then, the amplitudes and phases were combined directly in an inverse transform to produce the final image.
4 Results
4.1 band Results from the Keck Telescope
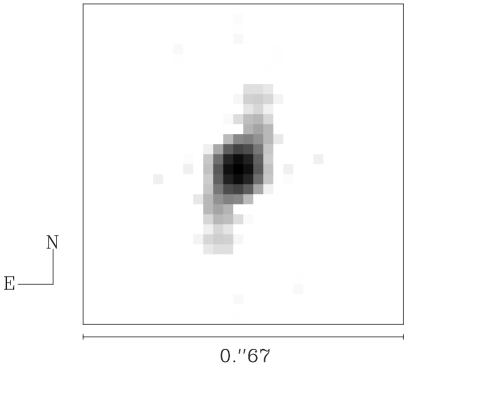
Figure 1 presents the 0.′′05 (or 3.6 pc) resolution Kband image produced with speckle imaging from using all of the nearly 4000 frames obtained in 1995 December. Each pixel is 0.′′021 0.′′021 and the field of view has been clipped to 0.′′67 on a side. The nuclear emission is seen to be comprised of two components, an unresolved point source and an extended region symmetric about the nucleus with a major axis of 0.′′3 (22 pc) and a minor axis of 0.′′18 (13 pc). The calculated Fourier phases were consistent with zero, so the extended component is symmetric about the nucleus.
For comparison with previous results and with models of the nucleus, we estimated the fractions of the total nuclear flux density arising in the point source and extended components. These quantities, along with the orientation and size of the extended emission, were found by fitting a two component model to the two-dimensional average object visibility. The fit was performed in the spatial frequency, i.e. Fourier, domain rather than the image domain so that no tapering function had to be applied to the high spatial frequencies. This model was intended not to reproduce the exact distribution of flux but to provide a robust estimate of the magnitude of the contributions of the two components.
The extended emission was modeled as a smoothly falling exponential of the form . The parameter measures the size of the extended emission, and the parameter measures the shape and orientation of the extended emission; was parameterized by an ellipticity and angle. The power determines how quickly the visibility falls with spatial frequency and hence the overall shape of the extended emission. The power was assumed, by ad-hoc phenomenological inspection, to be for the Keck Telescope Kband visibility. Since this model has only the explicit purpose of measuring the contributions from the two components, it is important for it to fit the overall shape of the visibility but unimportant whether it reproduced the details of the visibility at low spatial frequency. In particular, the lowest spatial frequencies were not used in the fit both because they are the most corrupted by global changes in the seeing in the time between when the object and calibrator were measured and because the extended flux from the galaxy causes the visibility to drop at the low frequencies.
The point source was included as a constant visibility offset, i.e. the same visibility at all spatial frequencies. The fit was performed as a minimization of the two-dimensional object visibility, where each frequency was weighted by its statistical uncertainty as calculated from the ensemble of power spectra, subject to the constraints that the parameters be greater than or equal to zero. All of the points from 020 cycles arcsec-1 were included in the fit. The salient results of this model are given in Table 2. Figure 2 shows the radial (i.e. azimuthally averaged) profiles of the measured two-dimensional visibilities and of the fit are shown. The differences between the data and model, i.e. the residuals, are also shown in the figure.
The result of the fitting demonstrates that 49% of the Kband flux density in the speckle image is contained in the unresolved core, i.e. in a diffraction limited beam, and 51% is in the extended region. The uncertainty in this fit is taken to be the uncertainty in the normalization of the power spectra, or 8%. § 5.1 describes how the total flux in the speckle image was determined.
4.2 band Results from the Palomar 200-inch Telescope
Of all the Hband data taken at the 200-inch Telescope, the observations from 19 December 1994 had the best signal to noise ratio at high spatial frequencies, so they were used for the analysis which follows. The observations from other nights are consistent with that of 19 December, but of lower quality. The final Hband image from the 200-inch Telescope, with half the resolution of the Kband image from the Keck Telescope (0.′′1 or 7.2 pc), similarly consists of both a point source and extended emission.
The same fitting procedure described in the previous section was used to fit the two-dimensional Hband visibility, but the power was taken to be . Since the value of primarily affects the shape of the visibility at low spatial frequencies (where, as noted above, the measurements are sensitive to seeing variation and the galactic emission) we make no comparison between the Hband and Kband data on these scales.
In the Hband data from the 200-inch Telescope, 63% of the flux density from the speckle image is contained in the unresolved point source (i.e. within a diffraction limited beam) and 37% is in the extended region. The uncertainty in this fit is taken to be the uncertainty in the normalization of the visibilities, or 8%. A discussion of how the total flux in the Hband image is determined is given in § 5.1.
| measurement | eccentricity | angle | fraction unresolved |
|---|---|---|---|
| Keck Kband (at 200-inch Resolution) | 0.81 | 158.2 | 0.64 |
| 200-Inch Hband | 0.81 | 159.4 | 0.63 |
| Keck Kband (at full Resolution) | 0.81 | 158.6 | 0.49 |
4.3 H K Color
The data from the Keck Telescope, at higher spatial resolution than that from the 200-inch Telescope, resolves more of the nuclear Kband flux into extended emission. In order to compute the H K colors of the unresolved point source and the extended emission, however, the Kband data from the Keck Telescope must be smoothed to the 200-inch Telescope resolution. Instead of smoothing the reconstructed image, the object visibility from the Keck Telescope data was fit out to a spatial frequency of 11.3 cycles arcsec, i.e. the same resolution obtainable at the 200-inch Telescope, using the procedure described above in § 4.1. In this case the Kband shows the same distribution of flux density as the band, i.e. 64% in an unresolved core and 36% in an extended region. Since both the Kband and Hband data show the same fraction of their respective total fluxes in the point source, the HK color of the point source is the same as that of the extended emission. The uncertainty in this color is 11%, the combination of the uncertainties in each of the fits to the visibilities. The actual value of this color is computed below in the discussion section.
4.4 Upper Limit to the Size of the Point-like Nucleus
The speckle data can be used to place an upper limit on the size of the nuclear point source. If the core were actually extended, it would have the effect of reducing the visibilities at high spatial frequencies, but instead we find the visibilities flatten out at high spatial frequencies. The fit to the Keck Telescope data, shown in a radial profile plot in Figure 2, leaves residuals of less than 10% at frequencies above 19 cycles arcsec. So, the presence of another undetected component is therefore constrained by the uncertainty in the residuals at the highest frequencies. Without making an a priori assumption as to the shape of the extension, should it be present, the upper limit to its size can be taken as the highest spatial frequency at which high S/N information was obtained in the data, in this case 19.7 cycles arcsecor 0.′′051. A more stringent upper limit to the point source size can be placed under the assumption that the true nucleus has a Gaussian shape. The width of the largest Gaussian which could be hidden in the Kband visibility data (i.e. which will not differ from the data by more than 3 at the highest spatial frequency) is 0.′′02 or 1.4 pc.
4.5 Photometry
Because of limitations deriving from the small field size, low S/N, and image wander in speckle images, it is difficult to make photometric measurements from speckle data. Therefore, we measured the total flux density in a beam the size of the speckle frames from 0.′′45 resolution long exposure images made at the Keck Telescope in both the H and bands. In a beam radius of 1.′′25, the Kband magnitude is 7.5 and the Hband magnitude is 9.26, resulting in an HK color of 1.76 mag. Aperture photometry from these images (in both magnitudes and Janskys) at a variety of other beam sizes is reported in Table 3 and shown in Figure 3.
The contribution of the galaxy to the photometry at small beam sizes was estimated by fitting the galaxy surface brightness at radii between 1.′′8 and 27′′ with a deVaucouleurs function. Extrapolating the fit to a beam of radius 1.′′25, approximately the same size as the speckle field of view, implies that only 15% percent of the flux arises in the galaxy. Furthermore, the shape of the surface brightness profile within 1.′′25 is consistent with being the sum of the deVaucouleurs profile and a point source.
| beam diameter | K | K | H | H | HK |
|---|---|---|---|---|---|
| (′′) | (mag) | (mJy) | (mag) | (mJy) | (mag) |
| 0.4 | 8.75 | 204 | 11.06 | 39 | 2.31 |
| 0.5 | 8.50 | 257 | 10.78 | 51 | 2.28 |
| 0.8 | 7.98 | 415 | 10.13 | 92 | 2.14 |
| 1.0 | 7.87 | 459 | 9.95 | 109 | 2.08 |
| 1.5 | 7.68 | 547 | 9.63 | 146 | 1.95 |
| 2.0 | 7.58 | 600 | 9.42 | 178 | 1.84 |
| 2.5 | 7.50 | 646 | 9.26 | 206 | 1.76 |
| 2.9 | 7.45 | 676 | 9.14 | 230 | 1.69 |
| 3.5 | 7.39 | 715 | 9.00 | 261 | 1.61 |
| 3.75 | 7.36 | 735 | 8.94 | 276 | 1.58 |
Uncertainties are 3% in both the K and H magnitudes. Within a diameter of 1′′, the uncertainties are systematically larger due to the effects of the seeing disk.
4.6 Comparison to Previous Measurements
The size of the near-infrared core of NGC 1068 has been the subject of investigation by many previous researchers. One-dimensional speckle by McCarthy et al. (1982) at the 3.8 m Mayall Telescope placed an upper limit of 0.′′2 on the size of the unresolved core, and found extended emission that was 25% of the total 2.2 m flux in the beam. As shown in Figure 2, the Kband visibility measured in this work is consistent with 1.0 out to 1 cycle arcsec, but in the McCarthy et al. data, the visibility decreased to 0.8 by 0.5 cycles arcsec. This is probably a consequence of their large, 5′′ by 10′′, beam, which captured more light from the galactic stars, which have large spatial extent, than our smaller 2.′′6 square beam.
Similarly, 1-D speckle at 3.6 m by Chelli et al. (1987) at the 3.6 m ESO Telescope found an unresolved core, large scale (100 pc) emission, and a third component of extended yet compact emission 0.′′2 around the nucleus. The visibility obtained by Chelli et al. agrees very well with what we report. Their data also suggested that, of the two position angles they measured, the compact extended emission was larger along an angle of 135∘ than 45∘ which is consistent with the emission we measure shown in Figure 1.
In more recent imaging with an aperture mask, Thatte et al. (1997) find that 94% of the Kband flux in a 1′′ diameter aperture comes from a point source smaller than 0.′′03. They report the flux from this source as 190 mJy. Both of these measurements disagree with what is reported above in § 4.1 and Table 3, respectively.
Recent two dimensional speckle imaging by Wittkowski et al. (1998) at the 6 m Special Astrophysical Observatory Telescope finds extended emission which is 20% of the total Kband flux and in addition places a limit on the core size of 0.′′03. These estimates came from assuming a uniform disk model for the reconstructed emission, but they admit that an alternative explanation for their data would be an unresolved central object and extended emission. Fitting their data with this model, as described in §§ 4.1 and 4.2 above, would increase the fraction of the flux density attributable to the extended emission. While of insufficient sensitivity to show the extended emission reported in this work, their results are consistent with what is described here.
5 Discussion
Discussed in this section are three components of the emission from the central 1.′′25 radius of the nucleus: (1) the central point source, (2) the newly imaged extended nuclear emission reported in § 4 (and accounting for approximately 50% of the flux at 2m previously attributed to the point source), and (3) the stars of the underlying host galaxy.
5.1 H K Color of the Nucleus
While it is possible to tell from the speckle measurements alone that the color of the point source and the color of the newly imaged extended emission are the same, it is not possible to determine the color itself. This is because speckle, as an interferometric technique, resolves out (i.e. is not sensitive to) smooth large-scale extended emission which fills the field of view. Thus, all of the flux measured in a beam the size of the speckle frames, as reported in Table 3, cannot be automatically attributed to the features observed in the speckle image. However, the color of the emission in the speckle image can be deduced by subtracting the contribution from large scale galactic emission from the total flux measured in the speckle beam. We assume that the only such contribution comes from the distribution of stars in the host galaxy.
From the deVaucouleurs model fitting described in § 4.5 the galactic stellar contribution to the 1.′′25 radius speckle beam was determined to be 97 mJy at band, or 15% of the total Kband emission. Since no large (38′′ square) image of NGC 1068 at Hband such as the one taken at Kband was available, it was assumed that the color of the galactic stellar population was 0.3 mag in the nuclear region, i.e. the same color as measured in aperture photometry off the nucleus (Thronson et al. (1989)). Combining this color with the Kband measurement, it was calculated that 118 mJy, or 57%, of the Hband emission in the 1.′′25 radius beam is due to stars. All flux in excess of the galactic stellar contribution, was assumed to come from the nucleus plus extended emission reported in § 4, and this flux then has an color of 2.5 mag. If there is another population of stars in excess of the assumed galactic contribution, this estimate of the color would be low. If there is substantial reddening of the stars in the nucleus compared with far from the nucleus, this estimate would be high. However, = 2.1 mag can safely be considered a lower limit to the color based on the aperture photometry reported in Table 3. The statistical uncertainty in this color is a combination of the uncertainties in the photometric calibration, the aperture photometry, and the fit to the photometry, for a total of 9%. Combined with the uncertainty in the visibility fitting from §§ 4.1 and 4.2, our best estimate of the color of the extended emission is 2.5 0.2 mag.
5.2 Possible Mechanisms for Extended Emission
It is of interest to consider the origin of the observed extended nuclear emission. There are several possibilities: it could be emission from stars, from nuclear light reflected off dust or electrons, or emission from hot dust, either in equilibrium or from single photon heating.
The color of the extended emission, 2.5 mag, is significantly redder than that of any stellar population. Thus, if the emission is from stars, it must be highly extincted. A color excess of 2.2 mag, obtained from assuming the stars have the same intrinsic color as the galactic stars far from the nucleus, (i.e., =0.3 mag) necessitates =34 mag. This is similar to the extinction found in the center parsec of our own Galaxy and produced in models of thermal emission from dust in a thick torus in NGC 1068 (Efstathiou et al. (1995); Young et al. (1995)). It is, however, much higher than the extinction of =02 mags suggested in the data of Thatte et al. (1997) for the central stellar cluster. It is known, however, that the extinction is quite patchy near the nucleus (Blietz et al. (1994)). The extended emission reported in this work is smooth over a length of 20 pc, and the substantial reddening required for the extended emission to be from stars seems unlikely to be similarly smooth over this scale.
A bigger problem with this hypothesis comes from the luminosity of the extended emission. Kband imaging spectroscopy of the nuclear region (Thatte et al. (1997)) has revealed the presence of a dense stellar cluster, which, based on the equivalent width of the CO band-head, accounts for 7% of the total nuclear luminosity. However, 50% of the nuclear flux is resolved by speckle. The Kband luminosity of the extended region, if it is emitted isotropically, is 4.7108 L⊙, a factor of ten larger than the stellar luminosity given in Thatte et al.
Finally, in this scenario the fact that the point source and the extended emission have the same color would be purely accidental unless the point source is also composed of stars. If the extended near-infrared structure is comprised of stars, it is also unlikely to be a continuation of a larger scale structure in the host galaxy. NGC 1068 does have a well known large scale ( 1 kpc) stellar bar (Scoville et al. (1988); Thronson et al. (1989)), but it is also oriented at a position angle of approximately 45∘.
Light from the point source reflected off dust or electrons in the narrow-line region would, on the other hand, provide a natural explanation for the similar colors of the point source and extended emission. The nucleus is highly (45%) polarized at 2.2m in a 4′′ beam suggesting that there is extensive scattering of the nuclear radiation (Lebofsky et al. (1978)). There are three possible sources of scattering: the warm electron gas which scatters the broad line emission, another population of electrons, or dust. The warm electrons modeled by Miller, Goodrich, & Matthews (1991) are located at least 30 pc from the nucleus, i.e. outside the extended emission reported here. Therefore scattering from these electrons is unlikely be the source of the extended region. Scattering from other electrons which are within a few parsecs of the point source would also tend to reflect the broad line region, so it is reasonable to conclude that there is no second population of electrons beyond that found by Miller et al.
The albedo, and wavelength dependence thereof, of an ensemble of dust grains varies widely with their size distribution (e.g. Lehtinen & Mattila (1996)). For the small grains that are to be expected in high UV-radiation field locations such as that around NGC 1068, observations and theory (Draine & Lee (1984)) predict that the albedo at 2.2 m is approximately 20% lower than at 1.6 m. Therefore, if the observed extended emission were reflected light from the point source of NGC 1068, it would be significantly bluer than the point source itself, whereas we observe the same color in the two sources. On the optimistic assumption that the albedo at 2.2 m has a value of 0.8 and that the dust scatters isotropically, the central source would have a true 2.2 m luminosity which is 15 times greater than observed.
Observations by Glass (1997) have shown that the nucleus of NGC 1068 became steadily brighter at Kband over a twenty year span from 1976 to 1994 before leveling off. He did not detect a concomitant rise in the Hband emission, but this is understandable given the galactic stellar contamination of his 12′′ beam. If the nuclear emission comes from dust on the inner edge of the torus which is heated to just below its sublimation point, an increase in luminosity will push the inner edge of the torus further away from the nucleus but not change the intrinsic color of the emission. However, the time constant for destroying grains may be long enough, on the order of years (Voit (1992)) so that an increase in luminosity produces temporarily higher temperatures and therefore bluer colors.
The light crossing time of the extended emission reported in § 4 is approximately 10 yr, so if it is reflected point source light, it should show a 10 yr lag in color compared to the point source. We do not know what the color of the point source was 10 years ago, but for it to have been just red enough to offset the tendency of dust reflection to make the emission bluer would be quite a conspiracy.
The final possibility is that the extended emission comes from hot dust. The color temperature implied by an HK color of 2.5 mags is 800 K. Taking the central luminosity of the AGN as , we can calculate that the dust grains which would be heated to this temperature in equilibrium would lie at most 1 pc or 0.′′01 (for silicate grains) from the point source. The extended emission reported in this paper is a factor of 10 larger. It has been suggested by other authors (Baldwin et al. (1987); Braatz et al. (1993); Bock et al. (1998)) that extended 10 m emission on 200 pc scales may be caused by heating of grains by the central source if the luminosity is beamed along the direction of the radio jets rather than emitted isotropically. The good spatial correspondence between the mid-infrared and radio jet (Cameron et al. (1993); Bock et al. (1998)) also lends credence to this idea. The component of the radio jet thought to lie at the infrared point source (Gallimore et al. 1996a ), S1, sits in a region of extended radio continuum emission which lies at a position angle of 175∘. A beaming factor of 200 which would be sufficient to explain the extended mid-infrared emission would also be sufficient to produce 800 K grains at 10 pc from the point source. By contrast, Efstathiou et al. (1995) derive a beaming factor of 6 based on their fit to the near-infrared spectrum of the nucleus, and this would be insufficient to heat grains to 800 K, 10 pc from the point source.
It is possible that the extended near-infrared emission is from hot dust which is heated not externally (i.e. by the central AGN), but internally, for example, by an interaction with the jet. The jets are observed to drive the motion of the emission line gas (Axon et al. (1998)), so it is reasonable to assume that they are dumping energy into the circumnuclear gas. More complete models would have to be made to examine this hypothesis.
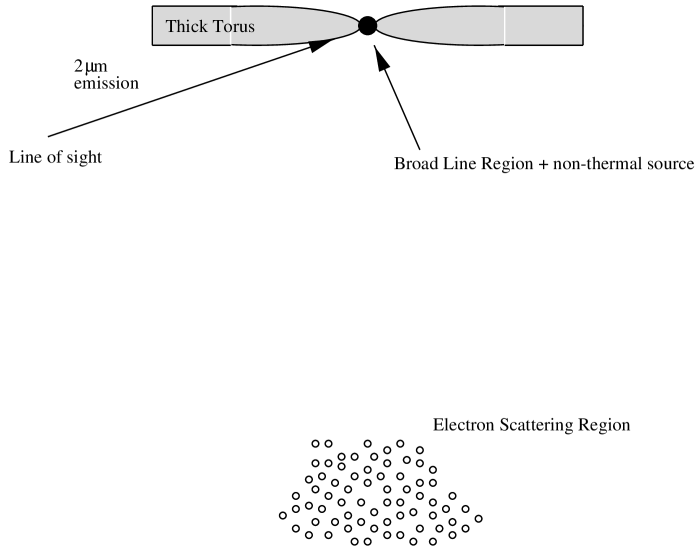
A natural explanation for the high color temperature which is reconcilable with an isotropically emitting central source would be single photon heating of small grains (Sellgren et al. (1984)). The rate of UV photons necessary to produce the total Kband luminosity of the extended nuclear emission can be calculated if one knows the mass of dust present in the region. If the hydrogen density is 105 cm-3 (Tacconi et al. (1994)), the dust to gas mass ratio is 10-2, and the grains radiate with unity efficiency in the infrared, the rate of photons needed per grain is 10-5 s-1. This rate is well below that expected from the intrinsic UV/X-ray spectrum of NGC 1068 (Pier et al. (1994)). However, polycyclic aromatic hydrocarbons (PAHs) are thought to be destroyed by intense X-ray/UV radiation fields (Voit (1992)) and the 3.3 m emission feature associated with PAHs has not been unambiguously detected at the nucleus (Bland-Hawthorn et al. (1997)). However, if the dust along the edges of the extended torus, as in Figure 4, were illuminated by UV photons which were reflected off of the high lying electron cloud and yet protected from the nucleus by the bulk of the torus, the X-ray flux they intercept would be substantially reduced. Miller et al. (1991) predict that if the optical depth to electron scattering is about 0.1 and there is a dusty disk of dimension 1020 cm surrounding the central region, then about 10% of the central UV luminosity would be back scattered onto the disk. If the disk is not uniform, as is likely considering the lumpy high resolution radio maps, some regions would have high enough column density to stop the grain destroying X-rays, yet see a reflected UV flux sufficient to create transient grain heating.
5.3 Comparison to Models and Line Emission
In the model of infrared emission from NGC 1068 (e.g. Pier & Krolik (1993); Efstathiou et al. (1995); Granato et al. (1997)) commonly found in the literature, the central source is surrounded by an optically thick torus. The torus is heated by the ultraviolet and X-ray photons from the accretion disk plus black hole system to which it is optically thick, but ionizing photons escape along the axis of the torus. The inner radius of the torus, 0.2 pc, is set by the sublimation point of the dust, and its outer radius, 40 pc (Granato et al. (1997)), is set by models of its infrared emission. The line of sight to this torus is nearly edge on, passing through 70-1000 magnitudes of visual extinction, depending on the model, and therefore does not permit a direct view of the central source. The 12 m emission observed is produced by the thermal radiation from hot dust on the inner edge of the torus, which, because it is on the edge, escapes through a region of moderate extinction. The geometry of the torus is constrained by the conical shape of the narrow-line region to have an opening angle of approximately 45∘. A cartoon of this model is shown in Figure 4. The 2 pc upper limit placed on the size of the point source in § 4.4 is consistent with this model, but the fact that the extended emission we observe is much larger than the size of the inner edge of the torus means that we must add to this picture. The emission we observe at 10 pc from the nucleus could come from a larger scale dusty structure, perhaps an extension of the torus, if the emission can be produced by one of the mechanisms outlined in § 5.2.
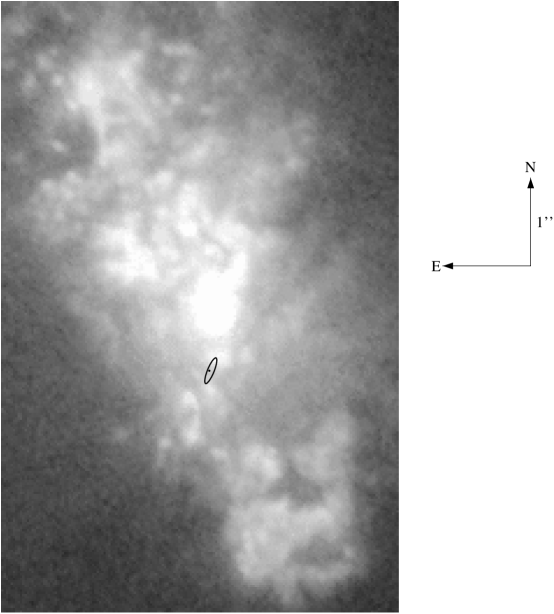
Light scattering off of dust is observed in the narrow-line region much further from the central source (Miller, Goodrich, & Matthews (1991)) than predicted by models of the spectral energy distribution (Efstathiou et al. (1995)). The narrow-line emission comes from clouds excited by the central source (Macchetto et al. (1994)), and it extends to hundreds of parsecs, at a position angle of approximately 45∘. The placement of the 2 m point source and extended region, shown superposed on the HST narrow-line image in Figure 5, shows that the extended 2 m emission lies alongside the bright emission knots in the visual ionization cone. Of course, the registration of the infrared and optical images is not known to exquisite precision. The best estimates from Thatte et al. (1997) have a 0.′′1 uncertainty in the registration and this uncertainty nearly encompasses the size of the extended near-infrared emission.
6 Conclusions
Two components of the nuclear 2.2 and 1.6 m emission of NGC 1068, in addition to its galactic stellar population, have been detected with speckle imaging on the Keck and 200-Inch Telescopes. The observations reveal an extended region of emission that accounts for nearly 50% of the nuclear flux at band. This region extends 10 pc along its major axis and 6 pc along its minor axis on either side of an unresolved point source nucleus which is at most, 0.′′02 or 1.4 pc in size.
Both the point source and the newly imaged extended emission are very red, with identical colors corresponding to a color temperature of 800 K. While the point source is of a size to be consistent with grains in thermal equilibrium with the nuclear source, the extended emission is not. The current data do not allow us to unambiguously determine the origin of the extended emission, but it is most likely either scattered nuclear radiation from an extended dusty disk or emission from thermally fluctuating small grains heated by reflected nuclear UV photons.
References
- Antonucci & Miller (1985) Antonucci, R. R. J., and Miller, J. S., 1985, ApJ, 297, 621
- Axon et al. (1998) Axon, D. J., Marconi, A., Macchetto, F. D., Capetti, A., and Robinson, A., 1997, Ap&SS, 248, 69
- Baldwin et al. (1987) Baldwin, J. A., Wilson, A. S., and Whittle, M., 1987, ApJ, 319, 84
- Bland-Hawthorn et al. (1997) Bland-Hawthorn, J., Lumsden, S. L., Voit, G. M., Cecil, G. N., and Weisheit, J. C., 1997, Ap&SS, 248, 177
- Blietz et al. (1994) Blietz, M., Cameron, M., Drapatz, S., Genzel, R., Krabbe, A., van der Werf, P., Sternberg, A., and Ward, M., 1994, ApJ, 421, 92
- Braatz et al. (1993) Braatz, J. A., Wilson, A. S., Gezari, D. Y., Varosi, F., and Beichman, C. A., 1993, ApJ, 409, L5
- Bock et al. (1998) Bock, J. J., Marsh, K. A., Ressler, M. E., and Werner, M. W., 1998, ApJ, 504, 5
- Cameron et al. (1993) Cameron, M., Storey, J. W. V., Rotaciuc, V., Genzel, R., Verstraete, L., Drapatz, S., Siebenmorgen, R., and Lee, T. J., 1993, ApJ, 419, 136
- Capetti et al. (1995) Capetti, A., Macchetto, F., Axon, D. J., Sparks, W. B., and Boksenberg, A., 1995, ApJ, 452, L87
- Chelli et al. (1987) Chelli, A., Perrier, C., Cruz-Gonzalez, I., and Carrasco, L., 1987, A&A, 177, 51
- Draine & Lee (1984) Draine, B. T. and Lee, H. M., 1984, ApJ, 285, 89
- Efstathiou et al. (1995) Efstathiou, A., Hough, J. H., and Young, S., 1995, MNRAS, 277, 1134
- (13) Gallimore, J. F., Baum, S. A., O’Dea, C. P., and Pedlar, A., 1996a, ApJ, 458, 136
- (14) Gallimore, J. F., Baum, S. A., and O’Dea, C. P., 1996b, ApJ, 464, 198
- Glass (1997) Glass, I. S., 1997, Ap&SS, 248, 191
- Granato et al. (1997) Granato, G. L., Danese, L., and Franceschini, A., 1997, ApJ, 486, 147
- Greenhill et al. (1996) Greenhill, L. J., Gwinn, C. R., Antonucci, R., and Barvainis, R., 1996, ApJ, 472, L21
- Labeyrie (1970) Labeyrie, A. 1970, A&A, 6, 85
- Lebofsky et al. (1978) Lebofsky, M. J., Rieke, G. H., and Kemp, J. C., 1978, ApJ, 222, 95
- Lehtinen & Mattila (1996) Lehtinen, K., and Mattila, K., 1996, A&A, 309, 570
- Lynds et al. (1991) Lynds, R., et al., 1991, ApJ, 369, L31
- Macchetto et al. (1994) Macchetto, F., Capetti, A., Sparks, W. B., Axon, D. J., and Boksenberg, A., 1994, ApJ, 435, L15
- Matthews et al. (1996) Matthews, K., Ghez, A. M., Weinberger, A. J., and Neugebauer, G., 1996, PASP, 108, 615
- Matthews & Soifer (1994) Matthews, K. and Soifer, B. T. 1994, Astronomy with Infrared Arrays: The Next Generation, ed. I. McLean, Kluwer Academic Publications (Astrophysics and Space Science, v. 190, p. 239)
- McCarthy et al. (1982) McCarthy, D. W., Low, F. J., Kleinmann, S. G., and Gillett, F. C., 1982, ApJ, 257, L7
- Miller, Goodrich, & Matthews (1991) Miller, J. S., Goodrich, R. W., and Mathews, W. G., 1991, ApJ, 378, 47
- Norman & Scoville (1988) Norman, C. and Scoville, N., 1988, ApJ, 332, 124
- Persson (1998) Persson, S. E., Murphy, D. C., Krzeminski, W., Roth, M., Rieke, M. J., 1998, AJ, 116, 2475
- Pier & Krolik (1993) Pier, E. A., and Krolik, J.H., 1993, ApJ, 418, 673
- Pier et al. (1994) Pier, E. A., Antonucci, R., Hurt, T., Kriss, G., and Krolik, J., 1994, ApJ, 428, 124
- Scoville et al. (1988) Scoville, N. Z., Matthews, K., Carico, D. P., and Sanders, D. B., 1988, ApJ, 327, L61
- Sellgren et al. (1984) Sellgren, K., 1984, ApJ, 277, 623
- Tacconi et al. (1994) Tacconi, L. J., Genzel, R., Blietz, M., Cameron, M., Harris, A. I., and Madden, S., 1994, ApJ, 426, L77
- Telesco et al. (1988) Telesco, C. M., and Decher, R., 1988, ApJ, 334, 573
- Thatte et al. (1997) Thatte, N., Quirrenbach, A., Genzel, R., Maiolino, R., and Tecza, M., 1997, ApJ, 490, 238
- Thronson et al. (1989) Thronson Jr., H. A., Hereld, M., Majewski, S., Greenhouse, M., Johnson, P., Spillar, E., Woodward, C. E., Harper, D. A., and Rauscher, B. J., 1989, ApJ, 343,158
- Tully (1988) Tully, R. B., Nearby Galaxies Catalog (New York: Cambridge University Press)
- Young et al. (1995) Young, S., Hough J. H., Axon, D. J., Bailey, J. A., and Ward, M. J., 1995, MNRAS, 272, 513
- Voit (1992) Voit, G. M., 1992, MNRAS, 258, 841
- Weigelt (1987) Weigelt, G. 1987, Optics Comm., 21, 55
- Wittkowski et al. (1998) Wittkowski, M., Balega, Y., Beckert, T., Duschl, W. J., Hofmann, K. H., and Weigelt, G., 1998, A&A, 329, L45