HI and OH absorption at
Abstract
We report on WSRT observations of HI and OH absorption at a redshift of towards the radio lens PKS 1830-21. The mm wave transitions of several molecular species have already been observed in absorption towards PKS 1830-21 at this redshift. At mm wavelengths the source structure is dominated by two extremely compact components, the northeast (NE) and southwest (SW) components. At lower frequencies the continuum emission is much more extended and there is also a broad Einstein ring connecting the NE and SW components. This larger extent of the continuum means that the HI and OH spectra sample a much larger region of the absorber than the mm wave spectra.
The HI spectrum that we obtain is asymmetric, with a peak at km/s with respect to the main molecular line redshift of . Weak mm wave molecular absorption has also been detected towards the NE component at this same velocity. The HI absorption, however, covers a total velocity width of 300 km/sec, including velocities well to the red of the deep molecular features, and is fully resolved suggesting that it is spatially widespread. In OH we detect both the 1667 and the 1665 MHz transitions, and the velocity-integrated ratio of their optical depths is consistent with what is expected in thermal equilibrium. The OH spectrum has a velocity width comparable to that of the HI spectrum, suggesting that it too is widespread in the absorber. The lack of a prominent HI peak in the spectrum at the velocity corresponding to the SW component, suggests that the galaxy responsible for the absorption at has a central molecular disk many kpc in size, and that HI may be deficient in this central region.
Our observations are sensitive to the large scale kinematics of the absorber, and to first order the implied dynamical mass is consistent with the lens models of Nair et. al. (1993). Higher spatial resolution is however critical in order to better constrain the lensing models.
Key Words.:
Cosmology: observations – galaxies: abundances – Radio lines: ISM – ISM: abundances1 Introduction
Neutral gas at high redshifts is most easily observed through the Lyman- transition of the hydrogen atom, which with current technology can be detected in absorption against the UV continuum of QSOs even at column densities as low as low as atoms/cm-2. The bulk (by mass) of the neutral gas however is found in the few very high column density systems(Rao and Briggs, 1993), where one could in principle expect a non trivial molecular fraction. However, quantitative predictions of the molecular fraction are difficult to make since the conversion of gas from atomic to molecular form depends on a variety of environmental factors like the UV background, the metallicity and the dust content, all of which are poorly constrained at high redshift. On the observational front, despite searching a large sample, mm molecular lines have been detected in absorption at high redshifts only from four sources (of which two are gravitational lenses and two appear to arise from gas associated with the AGN itself) (Wiklind & Combes 1998). Here we discuss the case of PKS 1830-21, which is the brightest known radio lens.
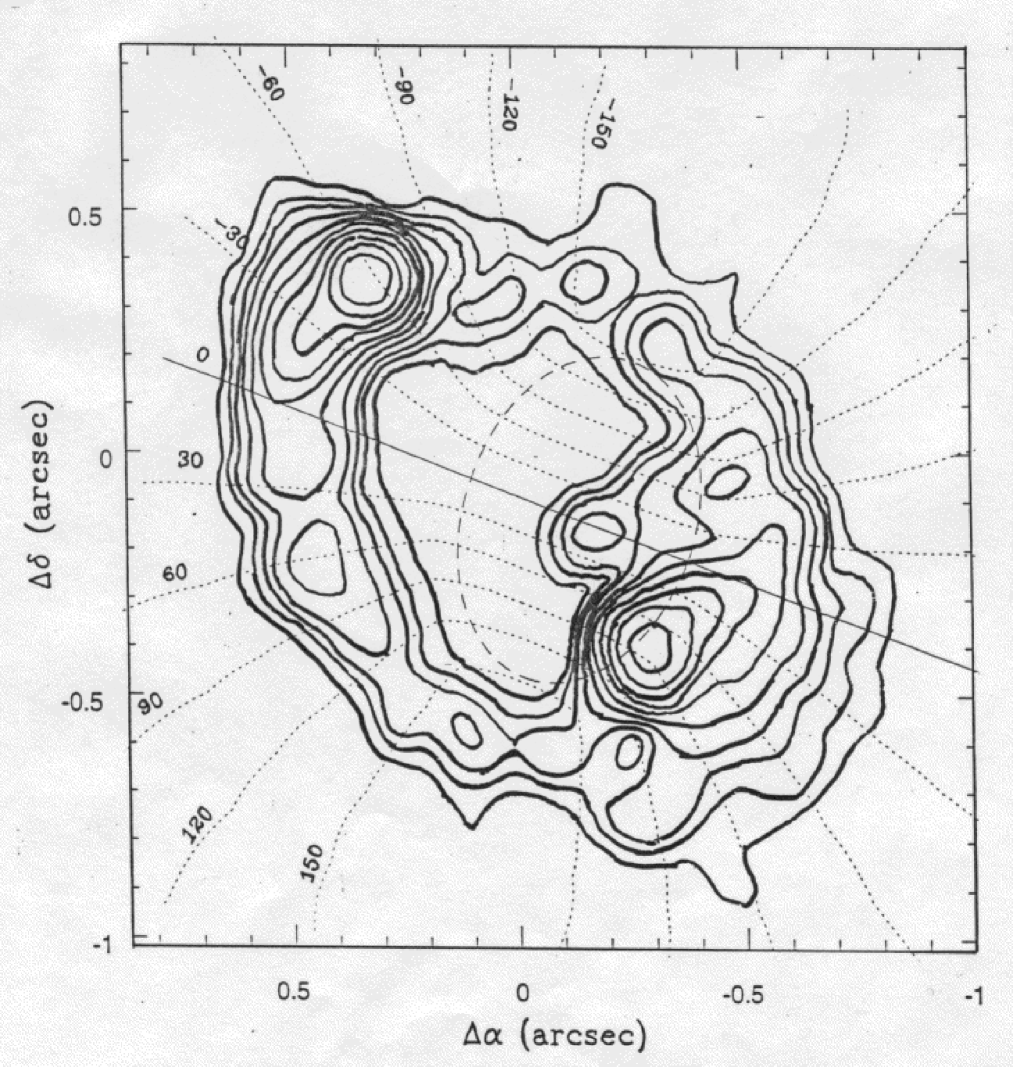
PKS 1830-21 was identified as a candidate gravitational lens on the basis of its peculiar radio spectrum and morphology (Rao & Subhramanyan 1988, Subhramanyan et. al. 1990, Jauncey et. al. 1991). The radio structure (see Figure 3) consists of two compact flat spectrum components separated by (henceforth called the northeast (NE) and southwest (SW) components respectively), joined by a steep spectrum ring. At a frequency of 1.7 GHz roughly one third of the observed flux comes from the ring and each of two compact components. At the redshifted frequencies of HI (753 MHz) and OH (884 MHz) the ring is expected to be even more dominant. The lack of simultaneous multi-frequency flux density measurements of sufficient angular resolution (in view of the strong variability of 1830-21) makes a more accurate assessment of the ring flux and the relative components fluxes at the low frequencies not possible at present.
For long, no optical counter part has been found for 1830-21 (Djorgovski et. al. 1992), largely because of confusion arising from its low galactic latitude, although there is now some evidence for one (Courbin et. al. 1998). Two independent gravitational lensing models have been proposed for PKS 1830-21, (Nair et. al. 1993, Kochanek & Narayan 1992). At the time that these models were made no redshift was available either for the source or the lens.
The redshift of the lens is now known to be from molecular line observations (Wiklind & Combes 1996). The absorption spectra against the NE and the SW image are very different (Frye et. al. 1996, Wiklind & Combes 1998), ruling out the possibility that the molecules at are associated with the background quasar itself. The bulk of the molecular absorption occurs against the SW component, although much weaker absorption is also seen in some molecules against the NE component. The velocity separation between the absorption seen against the NE image and the SW image is 147 km/s. In addition to the molecules seen at , HI absorption has also been seen towards PKS 1830-21, but at a lower reshift of (Lovell et. al. 1996). The velocity width of this HI line is km/s and it has been interpreted as arising due to absorption in a dense spiral arm of a low redshift spiral galaxy. No molecular absorption has been detected from this lower redshift system (Wiklind & Combes 1997).
In what follows we report on WSRT observations of the HI and OH absorption arising from the system at . At mm wavelenghts only the extremely compact, flat spectrum components of the background source have sizeable flux. Consequently the spectra sample a region of order only a few tens of parsecs across. At the HI and OH frequencies however, the background source is considerably more extended. These lines are thus more suited to probe the large scale kinematics of the absorbing system as well as to determine the averaged physical properties on a kpc scale.
2 Observations and data reduction
The observations were done with the broad band UHF receivers installed at the WSRT as part of the on going WSRT upgrade. The HI observations are summarized in Table 1 and the OH observations in Table 2
| Date | Bandwidth | Channel Separation |
|---|---|---|
| MHz (km/s) | (km/s) | |
| 03/Nov/96 | 2.5 (996) | 31 |
| 15/Nov/96 | 5.0 (1992) | 31 |
| 08/Jan/97 | 2.5 (996) | 1 |
| Date | Bandwidth | Channel Separation |
|---|---|---|
| MHz (km/s)† | (km/s)† | |
| 17/Nov/96 | 5.0 (1696) | 26.5 |
| 15/Dec/96 | 5.0 (1696) | 26.5 |
-
†
The velocity scale is for the 1667 MHz transition.
The OH observations were made using the standard interferometric mode and the data were reduced using NEWSTAR, the WSRT data reduction package. 1830-21 is spatially unresolved at the WSRT baselines. The data from the two observing runs were added together (after applying the appropriate heliocentric Doppler correction) and is shown in Figure 2. In addition, a lower resolution but larger total bandwidth spectrum was also obtained. This spectrum (which is not included here) is substantially the same as that shown in Figure 2. No broader absorption features were detected.
The high resolution HI spectrum, Figure 1c was obtained using the WSRT as a compound interferometer (CI), where the telescope was divided into two phased arrays and the output of these phased arrays was fed into the correlator. This mode achieves high spectral resolution at the expense of losing spatial information. However since PKS 1830-21 is not resolved at the WSRT, there is no loss of spatial information in the CI mode. The CI data was reduced using the WASP package (Chengalur 1996). The spectrum agrees well with that of Carilli et. al. (1997), apart from the region near , where their spectrum is badly affected by interference. The line is fully resolved and reaches a peak optical depth of 5.5%.
The lower resolution HI spectra Figure 1a&b were obtained in the standard interferometric mode and reduced using NEWSTAR. The observation on 15/Nov/96 used a much larger bandwidth, however again no new broad absorption feature was detected. As in the case for OH (but this time with better sensitivty and a longer time baseline), there is no measureable difference between the spectra obtained over a period of months. The flux densities were calibrated via reference to 3C48 for which we adopt a flux of 25.5 Jy at 753 MHz and 22.7 Jy at 884 MHz, which are based on the Baars et al. (1997) scale.


3 Discussion
With peak optical depths of only 0.007 and 0.005 in the two OH absorption lines the profile shape is not so well defined as that of the HI line. However, it is clear that the OH spectrum and the HI spectrum have similar overall velocity widths. Since the separation of the two OH lines is 350 km/sec we conclude that they do not overlap, consistent with the height of the continuum inbetween the two absorption features.
The 1667 MHz transition has an integrated optical depth that is larger than that of the 1665 MHz transition. Within the measurement errors the ratio of the optical depth is consistent with the 9:5 ratio expected in thermal equilibrium. There is evidence that at zero velocity the 1665 MHz line is deeper than the 1667 MHz line, suggesting variations in opacity of the 1665/1667 transitions. This could be related to the much larger molecular line optical depth at zero velocity than at -147 km/sec. We hope to address this issue with future more sensitive observations of the OH lines.
The optical depth (), the velocity width, the overall optical depth ratio, and the ratio of the OH column density to the excitation temperature () are all within the range of OH absorption seen towards the centers of low redshift galaxies (Schmeltz et. al. 1986). Under the assumption that the absorption arises from a rotating galaxy disk, the large OH velocity width implies that the covering factor of the OH absorbing gas is . In the Nair et. al. model, the distances of the SW and NE images from the lens center are 1.8 kpc and 3.8 kpc respectively (for km/s/Mpc and ), and hence OH would have to be widespread in the central 5–6 kpc of the galaxy.
The HI spectrum is highly asymmetric, with a peak at km/s, the same velocity where weak molecular absorption is seen against the NE core. The HI peak is then presumably gas seen in absorption against the very compact NE component. If one assumes that this component has of the total flux then for the gas lying in front of the NE component , compatible with galactic numbers of cm-2, and K.
The red wing of the HI absorption profile shows a weak but resolved feature at zero velocity, corresponding to the deep molecular absorption. The contrast in the ratio of HI optical depth at the two velocities, compared to that of the OH molecules, is striking. One possibility is that the gas in front of the SW component is primarily molecular, (i.e. similar to what is seen in many early type spirals). Because the size of the radio source at 753 MHz is estimated to be at least 200 milliarcseconds (cf Patnaik and Porcas, 1995) corresponding about 1.5 kpc, several orders of magnitude larger than at mm wavelengths, this lack of HI must indicate a genuine lack of HI in a substantial part of the inner galaxy. This, in conjunction with the OH spectrum, then suggests that the system is an early type spiral with a large central molecular disk, at least 5–6 kpc in size. The broad component in the HI spectrum is presumably the result of HI seen in absorption primarily against the steep spectrum ring.
Since at low frequencies the ring has no gaps and the center of the lensing galaxy must lie inside the ring, then without recourse to any specific lensing model it follows that the ring must cut across both the receding and approaching sides of the major axis (Figure 3). For reasonable rotation curves the ring will cut across the major axis well beyond the rising part of the rotation curve. In principle then, the velocity width of the HI spectrum ( km/s) corresponds to twice the rotation velocity of the galaxy (apart from an inclination correction). In practice however since the emission from the ring is weakest at the points where it cuts across the major axis, the rotation velocity could be somewhat underestimated. From the model in Nair et. al. (1993) it is straighforward to compute the velocity that one should see in absorption against the SW and the NE cores. The observed velocities are indeed obtained provided one changes the position angle slightly. The inclination angle in the Nair et. al. model is , however this gives the mass inside the central 4 kpc as , which is somewhat low for a source redshift . As suggested by Wiklind & Combes (1998), the inclination angle may be closer to , and the true rotation velocity more like km/s, more typical of early type spirals.
In summary then, the OH and HI spectra are consistent with the lens being an early type spiral at a redshift of .
References
- (1) Carilli, C. L, Menten, K.M., Reid, M.J., Rupen, M.P. and Claussen, M. astro-ph 9801157.
- (2) Chengalur, J. N., NFRA note 453, 1996.
- (3) Courbin, F. et. al., 1998 to appear in APJL.
- (4) Djorgovski, S., et. al., 1992 MNRAS 257, 240.
- (5) Frye B., Welch, W. J., & Broadhurst. T., 1997 ApJ 478, L25
- (6) Jauncey, D. L. et. al., 1991 Nature, 352,132.
- (7) Kochanek, C. S. & Narayan R., 1992 ApJ 401, 461.
- (8) Lovell, J.E.J. et. al., 1996 ApJ, 472, L5.
- (9) Nair S., Narasimha D., & Rao, A. P.1993 ApJ 407, 46.
- (10) Patnaik, A. et al. 1994 In Proceedings of the 1993 Leige Symposium on Graviational Lensing
- (11) Patnaik, A. & Porcas, R. 1995 In: Kochaneck, C.S. and Hewitt, J. N. Proc. of IAU Symposium 173, Astrophysical Applications of Gravitational Lensing, Kluwer Academic Publishers.
- (12) Rao, A. P. & Subhramanyan, R., 1988 MNRAS 231, 229.
- (13) Rao, S. & Briggs, F. 1993 ApJ 419, 515.
- (14) Schmeltz, J. T., Baan, W. A., Haschick, A. D., & Eder, J. 1986 AJ 92, 1291.
- (15) Subhramanyan, R., Narasimha, D., Rao, A. P., & Swarup, G. 1990 MNRAS 246, 263.
- (16) Wiklind, T. & Combes, F., 1998 ApJ 500, 129.
- (17) Wiklind, T. & Combes, F., 1996 Nature, 879,139.