The Intra-cluster Medium Influence on Spiral Galaxies
Abstract
We made a detailed analysis of the sample of 39 cluster spiral galaxies of various types observed at H wavelength by Amram et al. (1992 to 1996), with a scanning Fabry-Perot. We plotted the outer gradient of their rotation curves as a function of the deprojected cluster-centric distance. The rotation curves of late type galaxies markedly rise far from the cluster center. This suggests evolutionary effects, since early types show no special trend. We suggest that the evolution process within a cluster leads late type galaxies to exhibit flatter curves when they get closer to the center, on their way to evolving into early type galaxies.
Galaxies: fundamental parameters: general: interactions: kinematics and dynamics: spiral
1 Introduction
The study of cluster galaxies helps us understand and constrain models of galaxy-evolution. Recently, several authors have used samples of thousands of galaxies to outline the main global properties of galaxies in clusters (see Adami et al. 1998 and references therein) such as the relation between the galaxy type with its environment or with its cluster centric distance. Some other studies (Rubin et al. 1988 and Whitmore et al. 1988: RWF hereafter, Amram et al. 1992 to 1996: hereafter AmI, II, III, IV and V or Sperandio et al. 1995: Sp hereafter) have made a more precise analysis (although with smaller samples) of the spiral morphological types to determine if their rotation curves are related to the cluster centric distance. However, these last studies suffer from an evident bias: they are based on a bidimensional analysis. Projection effects could explain the contradictory results among the authors. We analysed the sample of 45 galaxies observed by Amram et al. (AmI, AmIII and AmIV) in various clusters and used a statistical deprojection technique (based on the density profile of each of the spiral morphological types) to extract the main properties of the spiral galaxies in clusters and to constrain the models. In section 2 we describe the samples and the methods to discard interloppers. Section 3 describes the deprojection technique and the results. We discuss the implications in the last section.
| Cluster | Gal. name | OG () | d2D(Mpc) | d3D(Mpc) | d3D(Mpc) | d3DII(Mpc) | Morph. type | Authors ref. |
|---|---|---|---|---|---|---|---|---|
| A0262 | NGC668* | -2 | 2.14 | 2.97 | 0.66 | 3.03 | 3 | AmIII |
| NGC669 | 7 | 2.17 | 2.58 | 0.70 | 3.78 | 2 | Am III | |
| NGC688* | 0 | 1.66 | 2.66 | 0.84 | 2.82 | 3 | AmIII | |
| NGC753* | -5 | 1.33 | 2.43 | 0.75 | 2.39 | 4 | AmIII | |
| UGC1347* | 5 | 0.32 | 1.52 | 0.97 | 1.59 | 5 | AmIII | |
| UGC1493* | -1 | 2.88 | 3.41 | 0.47 | 3.25 | 2 | AmIII | |
| A0539 | UGC3269* | 7 | 1.20 | 2.33 | 0.80 | 3.51 | 4 | AmI |
| UGC3282* | 5 | 0.86 | 2.06 | 0.89 | 2.48 | 6 | AmI | |
| A1367 | NGC3861 | -9 | 0.37 | 1.64 | 0.99 | 0.45 | - | AmIII |
| NGC3883* | -2 | 1.65 | 2.60 | 0.66 | 2.45 | 3 | AmIII | |
| A1656 | NGC4921 | 0 | 0.76 | 1.97 | 0.92 | 0.81 | 2 | AmIII |
| UGC8161* | 12 | 2.72 | 3.32 | 0.40 | 2.93 | - | AmIII | |
| Z130-008* | 21 | 4.90 | 6 | AmI | ||||
| Z160-058* | 19 | 2.90 | 3.42 | 0.31 | 3.34 | 5 | AmI | |
| Z160-106 | 35 | 1.15 | 2.29 | 0.81 | 3.72 | -2 | AmI | |
| A2151 | IC1179 | 5 | 0.14 | 1.38 | 1.05 | 1.12 | - | AmIII |
| NGC 6045 | 10 | 0.14 | 1.33 | 1.04 | 0.43 | 5 | AmI | |
| NGC 6050 | 1 | 0.14 | 1.35 | 1.04 | 0.49 | 5 | AmIII | |
| NGC6054* | 3 | 0.17 | 1.36 | 1.04 | 0.56 | 3 | AmIII | |
| UGC10085* | 8 | 7.30 | 6 | AmI | ||||
| DC1842-63 | DC 10* | 32 | 0.11 | 1.30 | 1.05 | 0.63 | - | AmIV |
| DC24* | 8 | 0.15 | 1.34 | 1.04 | 0.72 | 4 | AmIV | |
| DC39* | -3 | 0.19 | 1.38 | 1.04 | 1.31 | 3 | AmIV | |
| DC47 | 13 | 0.31 | 1.51 | 1.02 | 1.47 | - | AmIV | |
| WR42 | 5 | 0.89 | 2.08 | 0.88 | 1.66 | 2 | AmIV | |
| Cancer | NGC2558* | 2 | 0.69 | 1.90 | 0.93 | 1.86 | 2 | AmI |
| NGC2595* | 6 | 1.90 | 2.82 | 0.60 | 2.10 | 5 | AmI | |
| UGC4329* | -5 | 0.44 | 1.67 | 0.99 | 1.09 | 6 | AmI | |
| UGC 4386 | 24 | 0.91 | 2.09 | 0.88 | 1.54 | 3 | AmI | |
| Z119-043* | 2 | 0.47 | 1.68 | 0.98 | 0.95 | - | AmI | |
| Z119-051* | 22 | 0.43 | 1.64 | 0.99 | 1.05 | - | AmIII | |
| Z119-053* | 6 | 0.32 | 1.52 | 1.02 | 1.16 | - | AmI | |
| Pegasus I | NGC7536* | 13 | 5.20 | 4 | AmI | |||
| NGC7591* | -7 | 1.62 | 2.63 | 0.68 | 2.13 | 4 | AmIII | |
| NGC7593* | 8 | 3.00 | 3.48 | 0.29 | 3.40 | 5 | AmI | |
| NGC7631* | 4 | 0.29 | 1.49 | 1.02 | 0.43 | 3 | AmI | |
| NGC7643* | 5 | 3.64 | 3.82 | 0.38 | 3.89 | 5 | AmI | |
| UGC12498* | -7 | 0.26 | 1.45 | 1.03 | 0.56 | 3 | AmI | |
| J2318+0633* | 5 | 1.62 | 2.63 | 0.68 | 3.84 | - | AmIII |
We have assumed here H0=75 km.s-1Mpc-1.
2 The sample
We use here the shape of the Rotation Curve (RC hereafter) of spiral galaxies to study the effect of the intra cluster medium on the halos of these galaxies. Amram et al. (AmI, AmIII and AmIV) observed 45 cluster galaxies with a scanning Fabry-Perot interferometer and with 3.6m telescopes (CFHT or ESO) at H wavelength. They drew detailed velocity fields with high resolution (both spectral and spatial) and derived the RC with a much better precision than can be done with slit spectroscopy. A detailed comparison of both techniques is given in AmI.
The shape of the outer part of the RCs is given by the outer gradient ”OG”, defined as the difference between the velocity at 0.4R25 and 0.8R25, normalized to the maximum velocity of the RC. R25 is the optical radius of a galaxy defined to the point where the surface brightness is 25 mag/arcsec2.
From the total sample of 45 galaxies Amram et al. could measure 39 OG (AmV). In some cases, the OG were obtained by a slight extrapolation of the RC. These 39 galaxies are listed in Table1, with the corresponding OG and the distance parameters that are discussed in section 3.
Although the OG is perhaps not the best parameter to define the tendency of a rotation curve to rise or decrease beyond the optical radius it has been used by many authors and appears as a common language. Also it is easy to compute as soon as the RC of a galaxy is available.
In order to get a sample as clean as possible we decided to discard the galaxies for which the OG was obtained with too large an extrapolation. We only kept those for which the RC reached at least 0.7R25. We thus excluded WR 42 and NGC 4921. The original data for NGC4921 had been obtained with rather bad weather conditions and were of rather poor quality, providing a RC with large error bars, and the OG was found abnormaly large (22). Although, we re-observed it at CFHT in 1995 in better conditions, with the same instrument, and find now a flat curve with OG close to zero. However it still remains the result of an extrapolation since the RC barely reaches 0.6R25.
We also discarded galaxies with a high extinction: we thus removed the galaxies with an inclination greater than 75 degrees, namely NGC 669 and UGC 4386 (both having an inclination of 80 degrees).
We also removed interacting galaxies to avoid effects due to the interaction on the RC. Six galaxies were thus excluded (see appendix for details).
This severe selection finally limits the total sample to 29 galaxies marked with a * in Table 1. They were homogeneously selected in 8 nearby distinct clusters and have morphological types lying between 2 and 6 (following the RC3 classification : de Vaucouleurs et al. 1989) although six of them have no clearly defined type.
In this respect the case of DC 10 deserves an explanation. Although it is refered to as a type 1 galaxy in the RC3 its type is most probably around 4, as suggested in AmIV, and we decided to attribute no definite type to this galaxy. Furthermore its OG is abnormally high (32), although it successfully passed all the selection criteria, placing it clearly outside our average distribution of points on Fig.1 (its d2D and d3D values are respectively 0.11 and 1.3 Mpc). We have no explanation to this, but we suppose that this galaxy suffers from projection effects that are impossible to correct due to its apparent position very close to the center of its cluster.
We also checked the projected clustercentric distances given by the authors by using an X-Ray determination of the center whenever possible (for A262, A539, A1656, A2151 and Pegasus). The difference between the centers used by the authors and the X-ray centers are quite small (typically less than 0.1 Mpc) and may be neglected regarding the cluster centric distances used here (see Tab. 1).
3 Other samples of Rotation Curves
We looked through the literature for other RCs of cluster galaxies, in order to extend our number of OG values. The other main samples of RC are all obtained through slit spectroscopy. We now discuss these samples.
Mathewson et al. (1992) : Of 965 spiral galaxies for which they give H RC only 261 belong to clusters. Applying our selection criteria (i.e. removing too much inclined galaxies, interacting ones and those with RC within 0.7R25) we keep fewer than 100 galaxies. Many of the remaining galaxies exhibit RCs with strong asymetries or dispersions and are not suited for obtaining reliable OG values. Furthermore most of them are found in loose clusters, not useful for the study of environmental effects. At last we deal with fewer than 10 galaxies in rich clusters (some of them being already found in our own sample: AmI + AmIII + Am IV) and we decided not to use this sample.
Mathewson and Ford (1996) : They added 1051 H RC of galaxies to the previous sample. Applying the same selection criteria, we keep fewer than 40 galaxies. Furthermore it was hard to get reliable values of OG from the published curves and we decided not to use this sample for our paper.
Persic and Salucci (1995) : This is a subsample of Mathewson et al. with 80 high quality RCs of galaxies. Most of them are field galaxies and, after rejection of that are too inclined, it remains only a few galaxies in loose clusters. Hence, we did not use this sample.
Courteau (1997) : The sample contains 304 field galaxies from the UGC catalogue, but none in clusters.
Corradi and Cappacioli (1991) : This catalogue of kinematical data about 245 galaxies is based on kinematical studies found in the literature. It is not a compilation of RCs but provides an interesting classification of the shape of the RC around the optical radius, with three classes : rising, flat and decreasing. We use these data in section 5 (discussion and conclusion).
Dale et al. (1997,1998) : Dale published a huge sample of 522 RC of late-type cluster galaxies in his PH D thesis. The data, now completed by the morphological type information, are being prepared for publication. The two first papers that are already published contain 145 RCs of cluster galaxies, of which 89 remain after removing higly inclined ones and those with abnormal radial velocities. The use of these RC is not straightforward however, since no R25 is available for these galaxies (the parameters given by the authors are R23.5 and R83, radius of the isophote containing 83% of the total emission in the I band). So that there is no direct way for getting OG from these data. Moreover, some of the last 89 galaxies have a RC not enough extended to allow a determination of OG.
Almost all of the samples listed above were intended to check the Tully-Fisher relation. Let us now examine the samples specificaly devoted to the study of OG in cluster galaxies :
Rubin et al. (1988) and Whitmore et al. (1988) : They measured 16 OG, 10 for early type galaxies (Sa + Sb) and 6 for late type galaxies (Sc). Most of them were measured with more accuracy, owing to the scanning Fabry-Perot, by AmI and AmIII. Only 2 galaxies satisfying our selection criteria could be added to the sample discussed in this paper, namely, UGC 12417 and WR 66.
Distefano et al. (1990) : They measured 15 OG of galaxies, most of them in the Virgo cluster. For the 9 OG values that were obtained by a combination of H and HI data, the optical RC could not be drawn far enough and we discarded them. Finally there are only 5 galaxies from this sample (1 early and 4 late) satisfying our selection criteria : NGC 4254, NGC 4294, NGC 4501, NGC 4651 and NGC 4654.
Sperandio et al. (1995) : They measured 16 OG of galaxies in the Virgo cluster (2 early and 16 late), 4 of which (2 early and 2 late) satisfy our selection criteria : NGC 4178, NGC 4480, NGC 4639 and NGC 4713.
From the 3 above samples, according to our selection criteria, it is possible to add 11 galaxies to our own sample of 29 galaxies from Fabry-Perot observations discussed in section 2. We did not plot them on Fig. 1 for sake of homogeneity (the 11 extra galaxies having been observed through slit spectroscopy) but it is worth noting already that these addition data reinforce the conclusions reached from the analysis discussed hereafter (see end of section 4).
4 Analysis
4.1 Deprojection
We have used the results of Adami et al. (1998) to find a way to deproject statistically the cluster-centric distances of our sample of galaxies. The method is based on the distribution profile of the spiral galaxies. Using a very large sample of about 2000 galaxies in 40 clusters, they have shown that the Sa+Sb galaxies (resp. Sc+Sd+Sm+Irr) follow a King profile with a core radius of 0.212 Mpc (respect. 0.263 Mpc). We have assumed these profiles for the present galaxies and via the Abel inversion, we have statistically deprojected these King profiles (they have the same core radius in 2 or 3 dimensions). We note that the values we get are only statistical estimations and must not be interpreted as reliable values for individual galaxies.
For each galaxy we have made 106 random generations of the spatial cluster-centric distance according to the given 3D King density law. We have kept only the distances greater than the observed projected distance (the projected distance observed in the sky plane being always lower than the 3D distance). The dispersion of these distances gives an estimation of the error we have for each galaxy (according to the size of the error, some of our galaxies are consistent with a central location in the cluster).
Finally, we have imposed a maximum radius for the cluster equal to 4 Mpc. This is about the maximum virial radius observed for the clusters (see e.g. Carlberg et al. 1996). A larger distance would imply that the isothermal sphere model (and then the deprojection method) is not valid.
We note that we computed here a value similar to the analytical mean weightened with a truncated King profile (due to the large number of realizations). Two galaxies with the same projected cluster-centric distance will have the same deprojected distance. To take into account this degeneracy, we have used a second deprojected distance: a single value generated by a random generator and weighted for the King profile (taking into account the 2D constraint), as suggested by the referee. This gives different values of the deprojected distance for a given projected distance. This allows to evaluate the robusteness of the 2 methods.
In Table 1 we give, for each galaxy, the mean likely 3D distance from the center of the cluster (hereafter d3D) computed from the observed projected distance in the sky (d2D), the second estimation of the 3D distance (d3DII) and the error we have for d3D (d3D).
The adopted maximum radius of 4 Mpc led us to not apply any deprojection to the galaxies with projected distances greater than this radius : they were considered to be field galaxies in the present paper (this is the case for the 3 outermost galaxies of our sample).
4.2 Results
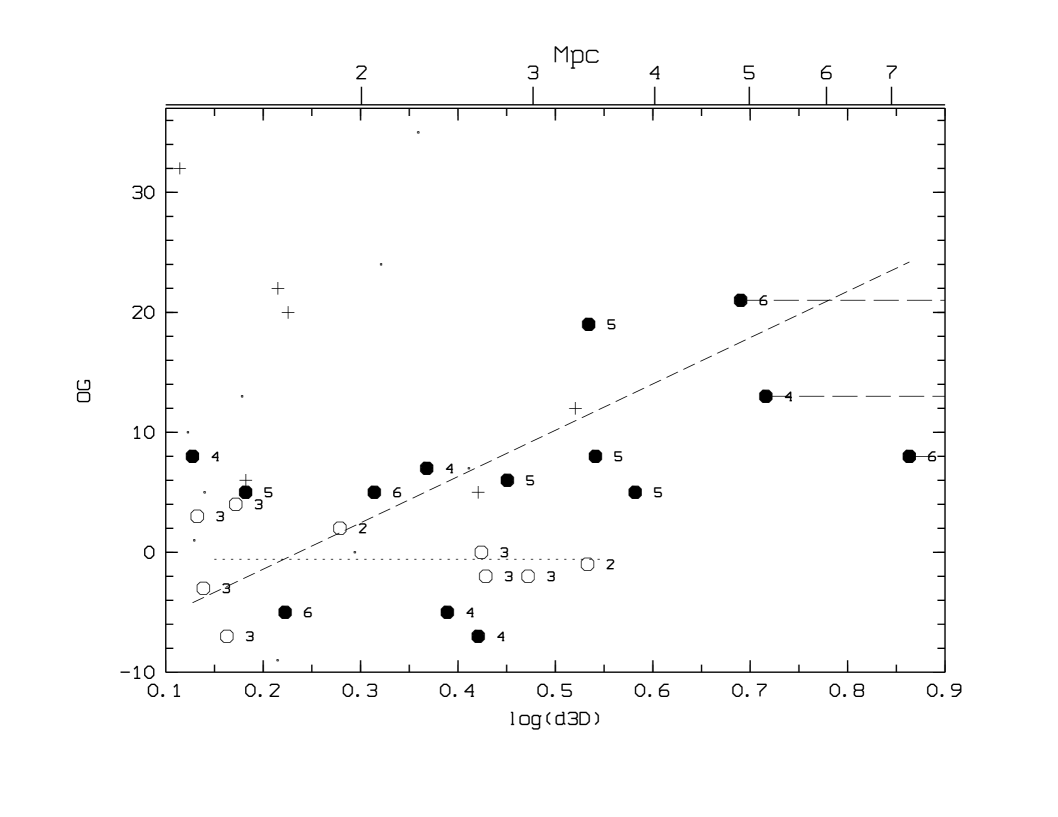
Fig. 1 shows the variation of OG as a function of d3D for the 39 galaxies of AmV having a measured OG. The plot is the same as in Fig. 13 of AmV with d3D instead of d2D (only one OG value has changed in the meantime, that for NGC 4921 which is now at 0 from the new data obtained at CFHT).
AmV found no correlation between OG and the distance to the cluster center. Using the d3D distance does not change this result since, as explained below, it may only amplify an already existing gradient.
With the selected sample of 29 galaxies following the selection criteria discussed in section 2 (that is to say discarding the galaxies plotted as simple points on Fig.1) there is still no clear tendency of OG to vary with the distance, especially since the dispersion is quite large.
Discarding now the galaxies with no defined type (23 galaxies remaining, with open and filled circles) things become clearer and there is a marked tendency of OG to increase with the distance.
OG is found to increase as a function of distance following the relation:
OG = (35.820.8)log10(d3D) + (-8.918.3)
N.B. This linear relation uses the bissector method from Isobe et al. 1990. The value of the Spearman’s rank correlation (Press et al 1992) is 0.11.
Using the d3DII estimator, we get consistent results with however a lower value of the slope: (23.221.9). The two results being consistent, we have choosen to use hereafter only the d3D statistical estimator.
Using the more usual projected distance d2D, instead of the corrected spatial distance d3D, one finds :
OG = (12.69.8)log10(d2D) + (3.18.7)
The measured slope is much steeper when using the deprojected distance (about 3 times). This is because the deprojection method significantly increases the distance of galaxies close to the cluster center, thus shortening the distance range and amplifying any gradient of OG as a function of distance. We remark that the deprojection method, when applied to galaxies at the same projected distance, will place late types further than early types, although the difference is not significant (for instance this difference is less than 3 % for d2D = 2 Mpc, whereas it would be more than 10% between ellipticals and late types).
The slope found here with the 2D distances (with the sample limited to galaxies of well defined type) is significant, although it is much smaller than the slope originally claimed by RWF (our slope is about three times smaller than their value).
Let us now look at the behaviour of galaxies depending on their type :
On Fig. 1 one can see that OG remains constant for early type galaxies, whatever their location within the cluster, meanwhile there is a marked tendency of OG to increase with the distance to the cluster center with late type ones.
The linear relation found for early type galaxies (bissector method from Isobe et al. 1990) is (with the Spearman’s rank correlations respectively equal to 0.21 and 0.19, indicating a better correlation):
OG = (-0.100.14)log10(d3D) + (0.553.3)
and that for late type ones:
OG = (38.618.4)log10(d3D) + (-9.1316.2)
Both relations are plotted respectively as a dotted line and a dashed line on Fig. 1.
N.B. The 11 galaxies (4 early and 7 late) discussed at the end of section 3 (observed through slit spectroscopy by other authors) show the same trend, although with a high dispersion since it is a very small sample, and the tendency remains the same when adding them to our own sample, leading to the following linear relations:
OG = (4.715.3)log10(d3D) + (4.009.0) for the early types
OG = (32.920.3)log10(d3D) + (-6.9813.1) for the late types
5 Discussion and conclusion
We have shown from a selected homogeneous sample of 29 spiral galaxies that the OG increases with the 3D cluster centric distance with a significant slope for late type galaxies, meanwhile early ones show no peculiar tendency.
Looking at the morphological types, one can see that the early types are dominant in the inner part of the clusters, meanwhile late types are found in the outer parts (see open and filled circles on Fig. 1).
This segregation phenomenon between early type and late type spirals has been demonstrated by Adami et al. (1998) from the analysis of a sample of 2000 galaxies in 40 clusters. It appears as the natural extension of the segregation already well known for elliptical, S0 and spiral galaxies in clusters (e.g. Melnick and Sargent, 1977; Dressler, 1980; Whitmore and Gilmore, 1991; Stein, 1997). This distribution of galaxies, depending on their type, may explain the observed tendency for OG to increase with the distance to the center of a cluster, since there is a correlation between the morphological type and the shape of the RC, as shown by Corradi and Cappacioli (1990). They have shown indeed, from a sample of 167 galaxies, that flat curves are associated to the earlier types and rising curves to the late types. We confirm this effect when analysing the larger sample (245 galaxies) catalogued by Corradi and Capaccioli (1991) for which they give 200 shapes of RC.
Fig. 2 shows the histogram of the distribution of types for the 73 rising RC of that sample (there are only 14 decreasing curves, evenly distributed among the different types, and 112 flat curves for which the histogram is practically the complement of Fig. 2). Among the 73 galaxies with rising RC, 15 are found isolated and may be considered as field galaxies, meanwhile 58 are found in groups or clusters. On Fig. 2 we plotted indeed two histograms side by side, one for the 51 field galaxies (hatched areas) and another one for the 148 cluster galaxies (gray areas). The same trend is observed in both cases, namely that the percentage of rising curves clearly increases regularly from early to late type spirals (we also checked that on our own sample of 39 cluster galaxies).
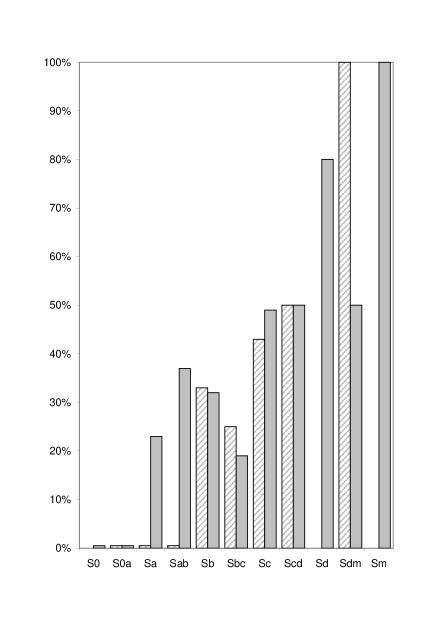
This suggests that the value of OG is more dependent on the type of a galaxy than on its evolution within a cluster. We conclude that the correlation between OG and the morphological type of galaxies seen on Fig. 1 mainly reflects the importance of the dark halo, increasing with the type.
Then the tendency of OG to increase with the distance to a cluster center, although remaining a controversial subject, could mainly reflect the morphological segregation of galaxies, those with larger values of OG being found preferentially in the outer parts of the clusters.
We now conjecture why there is a marked tendency of OG to increase with the distance for late type spirals, meanwhile the OG of early type spirals remains around zero.
Our results suggest that the effects of evolution within clusters predominantly affect late type galaxies, since the shape of their RC is more clearly dependent on their position within the cluster than for the early type galaxies.
We propose the following scenario:
Galaxies in a cluster are undergo to interactions which make them evolve. Those getting closer to the center will experience a larger number of interactions, thus losing a significant fraction of their halo and exhibiting less rising RC. This is why OG is found to be smaller in the central part of the clusters. Finally, with time elapsing, galaxies gradually reach more stable orbits closer to the cluster center meanwhile they evolve toward earlier types, as suggested by the trend observed in both the distribution and the velocity dispersion profiles for the different morphological types by Adami et al. (1998). The early type galaxies have almost finished their evolution within the cluster, now remaining on more circular orbits (also closer to the center) than the late type ones. Their behaviour is more homogeneous and they show no special trend. The late type galaxies are still evolving, with those closer to the cluster center being more evolved and displaying smaller OG values, because they have experienced a larger number of interactions. As time runs they will eventually turn into early type galaxies.
A question remains however : Early types being closer to the center should experience more interactions, hence loosing more material from their halo and exhibiting more decreasing RCs. On the contrary we have seen that their OG remains around zero and does not show any significant variation with the distance to the cluster center. This could be because they are moving in the denser parts of the cluster, hence accreting material more or less compensating the fraction of halo lost during interactions. Another possible explanation is that we have no type 1 (Sa) nor type 0 (S0a) galaxies in our sample (because the data we used are based on emission lines measurements), maybe preventing to see any tendency that could be more clearly seen with very early types.
Besides explaining the tendency of OG to increase with the distance to the cluster center, the proposed scenario would also explain why the behaviour is different for early and late type galaxies.
Our severe selection criteria, looking for high quality RCs of cluster galaxies, led us to work on a rather limited sample. The main result of our study, namely that early type galaxies exhibit flat RCs whatever their location in the cluster, while late type ones have all the more rising RCs as they are found further from the cluster center, needs however to be confirmed with larger homogeneous samples.
Acknowledgements.
AC acknowledges the staff of the Dearborn Observatory for their hospitality during his postdoctoral fellowship. DR acknowledges the staff of the Anglo Australian Observatory for their hospitality during her postdoctoral fellowship, she thanks the french ministery of foreign affairs for its help with a Lavoisier grant. The authors thank the referee for very useful and constructive comments. The authors thank M. Ulmer for a detailed reading of the revised manuscript.Appendix A Appendix: Discussion on the six interacting galaxies removed from the sample
Z 160-106: the interaction with its companion may explain the strange shape of the RC, with a very high value of OG, found in AmI ; also it is quite surprising to find H emission in this type of object, which is the only type -2 galaxy in our sample, making it all the more suspect.
DC 47: probably an interacting pair as explained in AmIV.
NGC 6045: already at the limit of being excluded for its high inclination, 75 degrees, it appears warped with a companion at the end of the eastern arm, see AmI.
NGC 6050 / IC 1179: they appear to be an interacting pair although they have flat RCs. Since there is a 1500 km.s-1 difference in systemic velocities, we suggest that it is maybe a superposition, see AmIII.
NGC 3861: has a close companion superimposed on a spiral arm, see AmIII.
References
- (1) Adami C., Biviano A., Mazure A., 1998, AA 331, 439
- (2) Amram P., le Coarer E., Marcelin M., et al., 1992, AAS 94, 175: AmI
- (3) Amram P., Sullivan W., Balkowski C., et al., 1993, ApJ 403, L59: AmII
- (4) Amram P., Marcelin M., Balkowski C., et al., 1994, AAS 103, 5: AmIII
- (5) Amram P., Boulesteix J., Marcelin M., et al., 1995, AAS 113, 35: AmIV
- (6) Amram P., Balkowski C., Boulesteix J., et al., 1996, AA 310, 737: AmV
- (7) Calberg R., Yee H., Ellingson E. et al., 1996, ApJ 462, 32
- (8) Corradi R. and Capaccioli M., 1990, AA 237, 36
- (9) Corradi R. and Capaccioli M., 1991, AAS 90, 121
- (10) Courteau S., 1997, AJ 114, 2402
- (11) Dale D.A., Giovanelli R., Haynes M.P. et al., 1997, AJ 114, 455
- (12) Dale D.A., Giovanelli R., Haynes M.P. et al., 1998, AJ 115, 418
- (13) Distefano A., Rampazzo R., Chincarini G., de Souza R., 1990, AAS 86, 7
- (14) Dressler A., 1980, ApJ 236, 351
- (15) Isobe T., Feigelson E.D., Akritas M.G., Babu G.J., 1990, ApJ 364, 104
- (16) Mathewson D.S., Ford L., 1996, ApJSS 107, 97
- (17) Mathewson D.S., Ford L. and Buchhorn, 1992, ApJ 389, 5
- (18) Melnick J., Sargent W., 1977, ApJ 215, 401
- (19) Persic M., Salucci P., 1995, ApJSS 99, 501
- (20) Press W., Teukolsky S., Vetterling W., Flannery B., 1992 ”Numerical Recipes” Cambridge University Press
- (21) Rubin V., Whitmore B., Ford W., 1988, ApJ 333, 522: RWF
- (22) Sperandio M., Chincarini G., Rampazzo R., de Souza R., 1995, AAS 110, 279: Sp
- (23) Stein P. 1997, AA 317, 670
- (24) de Vaucouleurs G., de Vaucouleurs A., et al., 1989, the Third Reference Catalog: RC3
- (25) Whitmore B., Forbes, D., Rubin V., 1988, ApJ 333, 542: RWF
- (26) Whitmore B., Gilmore ., 1991, ApJ 367, 64