Relation between Kilohertz QPOs and Inferred Mass Accretion Rate in 4 LMXBs
Abstract
I summarize the available RXTE data of the 4 low-mass X-ray binaries (LMXBs) and Atoll sources Aql X–1, 4U 1728–34, 4U 1608–52, and 4U 1636-53. I concentrate on the relation between the frequencies of the quasi-periodic oscillations at kilohertz frequencies (kHz QPOs) and the X-ray flux and colors of these sources. In these 4 sources the kHz QPOs are only observed in a narrow range of spectral states (as defined from the X-ray color-color diagrams). I show that despite its complex dependence upon the X-ray flux, the frequency of the kHz QPOs is monotonically related to the position of the source in the color-color diagram. These findings strengthen the idea that in LMXBs the X-ray flux is not a good indicator of the mass accretion rate, , and that the observed changes in the frequency of the kHz QPOs in LMXBs are driven by changes in .
-
(1) Astronomical Institute “Anton Pannekoek”, University of Amsterdam, Kruislaan 403, NL-1098 SJ Amsterdam, the Netherlands
-
(2) Facultad de Ciencias Astronomicas y Geofisicas, Universidad Nacional de La Plata, Paseo del Bosque S/N, 1900 La Plata, Argentina
Email: mariano@astro.uva.nl
1 Introduction
In the past 3 years the Rossi X-ray Timing Explorer (RXTE) has discovered kilohertz quasi-periodic oscillations (kHz QPOs) in the persistent flux of 19 low-mass X-ray binaries (LMXB; see [1] for a review). In almost all cases the power density spectra of these sources show twin kHz peaks that, as a function of time, gradually move up and down in frequency, typically over a range of several hundred Hz.
Initially, data from various sources seemed to indicate that the separation between the twin kHz peaks remained constant even as the peaks moved up and down in frequency [2]. In some sources a third, nearly-coherent, oscillation has been detected during type-I X-ray bursts, at a frequency close to , or twice that value (see [3] for a review). These two results suggested that a beat-frequency mechanism was at work [2, 4], with the third peak being close to the neutron star spin frequency or twice that. In sources for which only the twin kHz QPO, and no burst oscillations, were observed the frequency difference was interpreted in terms of the neutron star spin frequency as well. But the simple beat-frequency interpretation of the kHz QPOs is not without problems [5, 6, 7, 8, 9], and other ideas discarding one or more elements of this basic picture, but still predicting definite relations between the observed frequencies, have been proposed [10, 11, 12].
One interesting result obtained from these RXTE observations is the complex dependence of the QPO frequencies upon X-ray flux, which is usually assumed to be a measure of the mass accretion rate . One example is 4U 1608–52 [13]: While on time scales of hours frequency and X-ray flux are well correlated, at epochs separated by days to weeks the QPOs span the same range of frequencies even if the average flux differs by a factor of 3 or more (see also [14, 15]). In this case, however, the QPO frequency is very well correlated to the position of the source in the color-color diagram [13].

Here I summarize some results from RXTE observations of 4 LMXBs: Aql X–1, 4U 1728–34, 4U 1608–52, and 4U 1636-53. (Some of these results have been published before [15, 13, 9] or will be presented in more detail elsewhere [16, 17]). Here I focus on the relation of the frequencies of the kHz QPOs to the X-ray flux and colors of the source. These results cast some doubt about the recently reported detection of the orbital frequency at the innermost stable orbit in 4U 1820–30 [18].
2 Results
As an example, in Figure 1 I show a power spectrum of 4U 1608–52 in the range Hz, where the two QPOs are seen simultaneously. Two, sometimes simultaneous, kHz QPOs are also present in the power spectra of 4U 1728–34 and 4U 1636–53. For Aql X–1 only one kHz QPO has been observed so far.
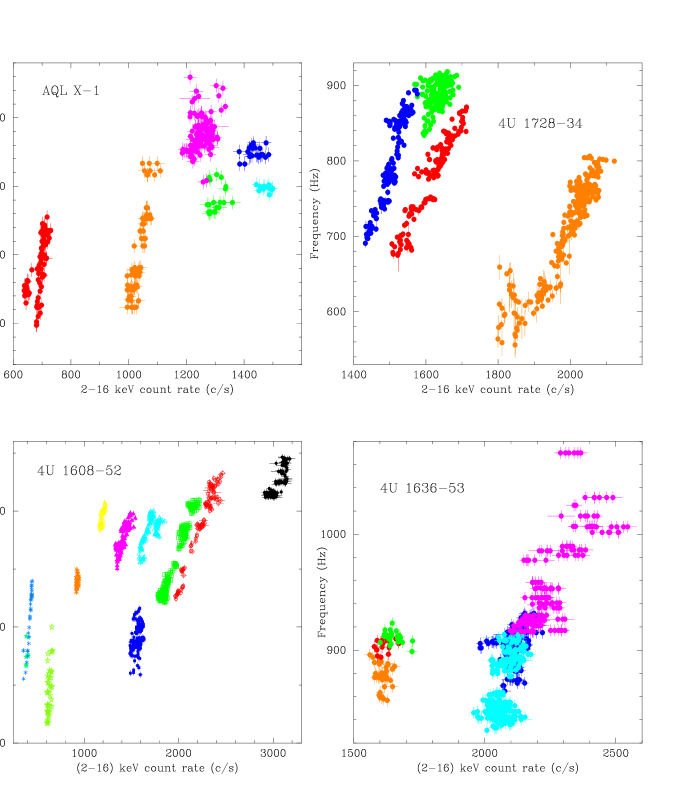
As I already mentioned, the frequencies of these kHz QPOs slowly change as a function of time. In Figure 2 I show the relation of the frequency of one of the kHz QPOs (for 4U 1728–34, 4U 1608–52, and 4U 1636–53 it is the kHz QPO at lower frequencies; for Aql X–1 it is the only kHz QPO detected so far) vs. source count rate in the keV energy range. From this figure it is apparent that the dependence of the kHz QPO frequencies upon X-ray intensity is complex (the same result is obtained if the keV source flux is used instead of the count rate).
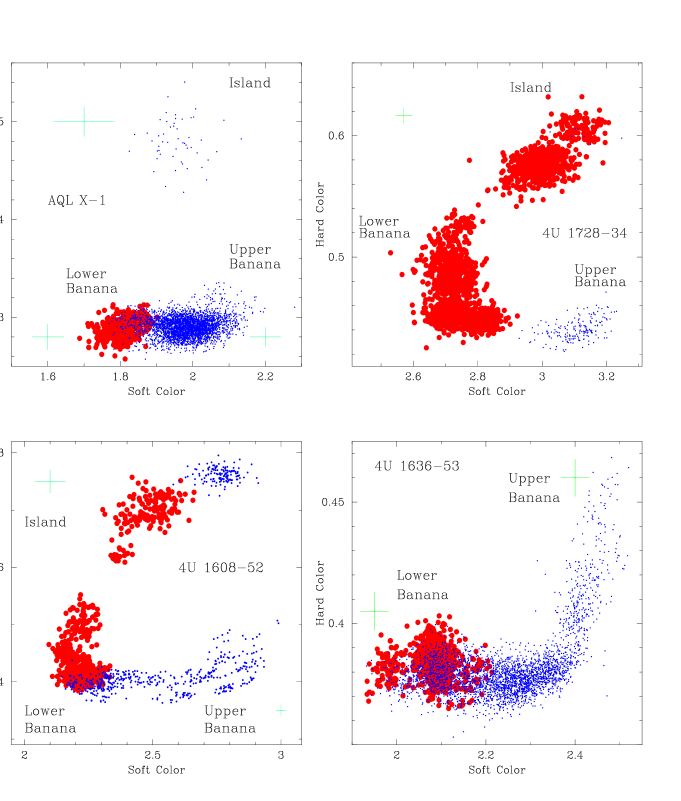
In Figure 3 I show the color-color diagrams of Aql X–1, 4U 1728–34, 4U 1608–52, and 4U 1636-53. The soft and hard colors are defined as , and , respectively, where is the background subtracted source count rate for the indicated energy range. These color-color diagrams are typical of the so-called Atoll sources [19]. Except for 4U 1636-53, which RXTE only observed in the banana branch, the other three sources move across all the branches of the atoll.
Interestingly, there seems to be a close relation between the position of the source in the color-color diagram and the appearance of kHz QPOs in the power spectrum: the QPOs are only detected in the lower banana and the moderate island states, and disappear both in the upper banana and in the extreme island states (red circles and blue dots indicate time intervals with and without kHz QPOs, respectively).
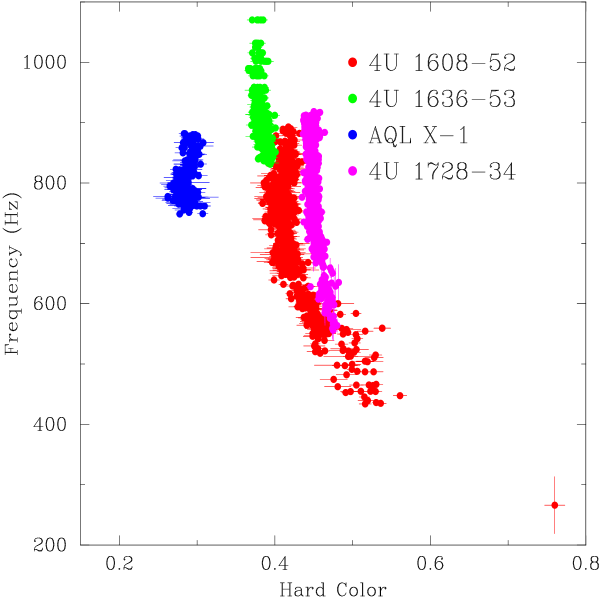
In Figure 4 I present the relation of the frequency of one of the kHz QPOs (as in Fig. 2, for 4U 1728–34, 4U 1608–52, and 4U 1636–53 it is the kHz QPO at lower frequencies; for Aql X–1 it is the only kHz QPO detected so far) as a function of hard color (see Fig. 3) for the same intervals shown in Figure 2. The complexity seen in the frequency vs. count rate diagram (Fig. 2) is reduced to a single track per source in the frequency vs. hard color diagram.
The shapes of the tracks in Figure 4 suggest that the hard color may not be sensitive to changes of state when these sources move into the banana in the color-color diagram (particularly in the case of Aql X–1, because the banana branch is almost horizontal in this diagram). To further investigate this, I parametrized the color-color diagram in terms of a one-dimensional variable that measures the position of the source along the atoll. I call this variable , in analogy to what is usually called for the other class of LMXBs, the Z sources. The shape of the color-color diagram is approximated with a spline, and a value of is assigned to each point according to the distance (along the spline) of that point to a reference point in the diagram.
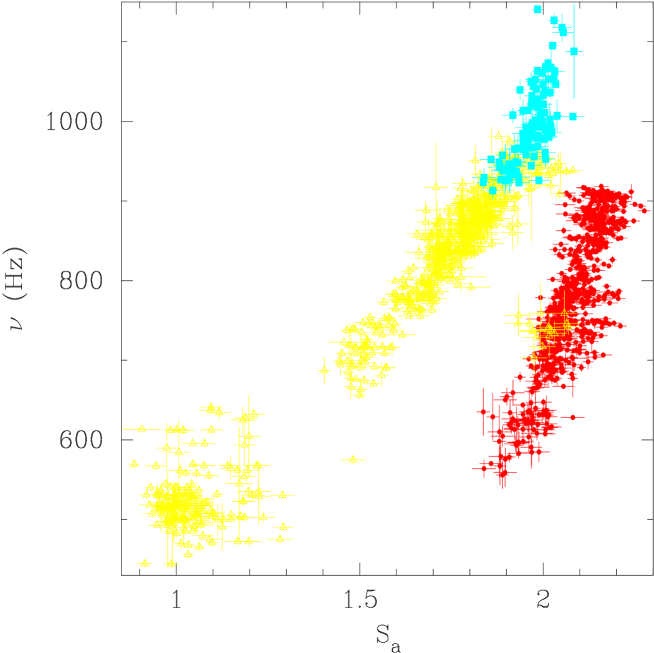
In Figure 5 I present the relation between the frequencies of the two QPOs in 4U 1728–34 vs. . I arbitrarily defined at colors (3.02,0.59), and at colors (2.75,0.46) (see Fig. 3). Red circles in this figure correspond to the kHz QPO at lower frequencies (the same data presented in Figure 2). The blue squares correspond to the frequency of the kHz QPO at higher frequencies, and the yellow triangles correspond to measurements in which I only detect one of the kHz QPOs; however, from the location of each point in this diagram it is possible to determine whether it is the QPO at higher or lower frequencies.
3 Discussion
These results show that a total lack of correlation between frequency and count rate on time scales longer than a day (Fig. 2) can coexist with a very good correlation between frequency and position in the X-ray color-color diagram (Fig. 4 and 5). The frequency of the QPO increases with , as the source moves from the island to the banana. Only on time scales of hours does the QPO frequency appear to also correlate well with count rate. The presence of the QPOs also correlates well with the position in the color-color diagram: the QPOs are only detected in the lower banana and the moderate island states, and disappear both in the upper banana and in the extreme island states (Fig. 3).
In the Atoll sources is thought to increase monotonically with along the track in the color-color diagram, from the island to the upper banana [19], whereas X-ray count rate tracks much less well [20, 21, 22]. The properties of the power spectra below Hz depend monotonically upon [19]. The result that the frequency of the kHz QPO is well correlated to , but not to X-ray count rate, implies that the kHz QPO frequency also depends monotonically upon inferred . In Z sources similar conclusions have also been reached [23].
Further support for this interpretation comes from the simultaneous analysis of the low and high frequency parts of the power spectra. In 4U 1728–34 the kHz QPO frequencies were recently found to be very well correlated to several Hz power spectral properties [24], while a similar result was obtained for a number of other Atoll (and Z) sources [25]. In all these sources, not only the position in the color-color diagram and the various low frequency power spectral parameters, but also the frequencies of the kHz QPOs are all well correlated with each other. This indicates that the single parameter, inferred to be , which governs all the former properties also governs the frequency of the kHz QPO.
X-ray intensity is the exception: it can vary more or less independently from the other parameters. In 4U 1608–52, it can change by a factor of (see Fig. 2) while the other parameters do not vary significantly. If as inferred, this constancy of the other parameters means that does not change, then this indicates that strongly variable beaming of the X-ray flux, or large-scale redistribution of some of the radiation over unobserved energy ranges is occurring in order to change the flux by the observed factors, without any appreciable changes in the X-ray spectrum. Perhaps the governing all the other parameters is the through the inner accretion disk, whereas matter also flows onto the neutron star in a more radial inflow, or away from it in a jet.
All current models propose that the frequencies of the kHz QPOs, which are thought to reflect the Keplerian orbital frequency of accreting matter in a disk around the neutron star, increase monotonically with , because the inner edge of the disk moves in when increases. However, the accretion disk cannot move closer to the neutron star than the radius of the innermost stable circular orbit, even if keeps increasing. This means that the frequency of the kHz QPOs should “saturate” at a value corresponding to the Keplerian frequency at the innermost stable orbit for a given source.
None of these 4 sources show evidence for a saturation of the frequency of the kHz QPOs at a constant maximum value as increases, different from what was inferred for 4U 1820–30 [18]. In 4U 1820–30 the kHz QPO frequencies increase with count rate up to a threshold level, above which the frequencies remain approximately constant while the count rate keeps increasing. Assuming that count rate is a measure for , this was interpreted as evidence for the inner edge of the disk reaching the general-relativistic innermost stable orbit. However, the results presented above indicate that count rate is not a good measure for . Inspection of Figure 2 suggests that with sparser sampling some of those plots could easily have looked similar to that of 4U 1820–30. It will therefore be of great interest to see if in 4U 1820–30 the saturation of QPO frequency as a function of count rate is still there when this parameter is plotted as a function of position in the X-ray color-color diagram.
Acknowledgments
This work was supported in part by the Netherlands Research School for Astronomy (NOVA), the Leids Kerkhoven-Bosscha Fonds (LKBF), and the NWO Spinoza grant 08-0 to E.P.J. van den Heuvel. MM is a fellow of the Consejo Nacional de Investigaciones Cientificas y Tecnicas de la Republica Argentina. This research has made use of data obtained through the High Energy Astrophysics Science Archive Research Center Online Service, provided by the NASA/Goddard Space Flight Center.
References
References
- [1] van der Klis, M., in Proc. of the 3rd William Fairbank Meeting, Rome June 29 - July 4 1998 (astro-ph/9812395)
- [2] Strohmayer, T. E., Zhang, W., Swank, J. H., Smale, I., Titarchuk, L., Day, C. & Lee, U., ApJ, 469, L9 (1996)
- [3] Strohmayer, T. E., Swank, J. H., & Zhang, W., ApJ, 503, L147 (1998)
- [4] Miller, M. C., Lamb, F. K., Psaltis, D., ApJ, 508, 791, (1998)
- [5] van der Klis, M., Wijnands, R. A. D., Horne, K., & Chen, W., ApJ, 481, L97 (1997)
- [6] Méndez, M., van der Klis, M., Wijnands, R., Ford, E. C., van Paradijs, J., & Vaughan, B. A., ApJ, 505, L23 (1998)
- [7] Méndez, M., van der Klis, & van Paradijs, J., ApJ, 506, L117 (1998)
- [8] Ford, E. C., van der Klis, M., van Paradijs, J., Méndez, M., Wijnands, R., & Kaaret, P., ApJ, 508, L155 (1998)
- [9] Méndez, M. & van der Klis, M., ApJ, in press (1999)
- [10] Titarchuk, L., Lapidus, I., & Muslimov, A., ApJ, 499, 315 (1998)
- [11] Stella, L. & Vietri, M., Phys. Rev. Lett., 82, 17 (1999)
- [12] Lamb, F. K., Miller, M. C., & Psaltis, D., in preparation (1999)
- [13] Méndez, M., van der Klis, M., Ford, E. C., Wijnands, R., & van Paradijs, J., ApJ, 511, L49 (1999)
- [14] Ford, E., et al., ApJ, 475, L123 (1997)
- [15] Zhang, W., Jahoda, K., Kelley, R. L., Strohmayer, T. E., Swank, J. H., & Zhang, N., ApJ, 495, L9 (1998)
- [16] Reig, P., Méndez, M., van der Klis, M., Ford, E. C. ApJ, to be submitted (1999)
- [17] Méndez, M., et al., in preparation (1999)
- [18] Zhang, W., Smale, A. P., Strohmayer, T. E., & Swank, J. H., ApJ, 500, L171 (1998)
- [19] Hasinger, G., & van der Klis, M., A&A, 225, 79 (1989)
- [20] van der Klis, M., Hasinger, G., Damen, E., Penninx, W., van Paradijs, J., & Lewin, W. H. G., ApJ, 360, L19 (1990)
- [21] van der Klis, M., ApJS, 92, 511 (1994)
- [22] Prins, S., & van der Klis, M., A&A, 319, 498 (1997)
- [23] Wijnands, R., et al., ApJ, 490, L157 (1997)
- [24] Ford, E. & van der Klis, M., ApJ, 506, L39 (1998)
- [25] Psaltis, D., Belloni, T., van der Klis, M., ApJ, in press (1999)